Performance Assessment of Solar-Based Hydrogen Production via H2SO4 Cycle
|
|
|
- Karzan Petrovat
- 9 yıl önce
- İzleme sayısı:
Transkript
1 Performance Assessment of Solar-Based Hydrogen Production via H2SO4 Cycle Fatih Yilmaz 1*, M. Tolga Balta 2, Resat Selbas 3 1 Department of Electrical and Energy, Vocational Schools of Technical Sciences Aksaray University, 68100, Aksaray, Turkey 2 Department of Mechanical Engineering, Faculty of Engineering, Aksaray University, 68100, Aksaray, Turkey 3* Department of Energy Systems Engineering, Faculty of Technology, Suleyman Demirel University, 32100, Isparta, Turkey Abstract * [email protected] Utilization of solar energy has become important and significantly it is expected to increase in the following years. Therefore, the performance of thermal power plants integrated with solar energy should be improved, urgently. In this study, thermodynamic performance analyses of solar based hydrogen production via H2SO4 cycle is examined in the adoption of certain conditions. Energy and exergy analyses of the system is carried out by EES (Engineering Equations Solver). The performance evaluation of the system were examined and illustrated with figures. The energy and exergy efficiency of H2SO4 cycle are calculated as 43.85%, and 63.39% respectively. Keywords: Energy, exergy, solar energy, hydrogen production. I. Introduction The extensive utilization of fossil fuels that release green houses gases into atmosphere and has led to some environmental problems such as ozone layer depletion and global climate change. Due to such negative effects of using fossil fuels in the nature, researchers have started looking into alternative fuels. The consumption of the energy has increases in the world, in consequence of growth in population and industrialization, nowadays, non-renewable energy sources, such as coal, natural gas and oil account for more than 85% of primary energy consumption of worldwide. Thus fossil energy source used for meeting the demands accelerating to several environmental problems (Dincer, 1998; Dincer, 2002). Also keep in mind that, fossil fuels must be regarded as s finite resources. In this regard, many scientists suggested that many solutions to these environmental problems. One of the important solutions is implementing hydrogen economy. Renewable based hydrogen seem to be a potential candidate to replace fossil fuels. Awad and Veziroglu (1984), suggested that the importance of hydrogen in removing environmental damages generated by combustion of fossil fuels. In presentday conditions hydrogen economy, hydrogen is mostly produced from fossil fuels energy sources and still releases greenhouse gases in to the atmosphere. Hydrogen production via thermochemical watersplitting cycles driven by waste heat and off peak electricity is more sustainable compared to present hydrogen production processes for sustainable hydrogen production for hydrogen economy (Balta et al, 2014). In the literature numerous investigators (Balta et.al, 2014; McQuillan et. al, 2005; Brown et. al, 2003; Carty et.al, 1981; Beghi, 1986, Ratlamwala et. al, 2012) have published on various thermochemical cycles for hydrogen production. Solar based on hydrogen production via thermochemical cycle have been reviewed and analyzed by Pregger (2009) and Yilmaz et. al, (2016). Hwang (2003), studied improvement of the thermochemical water-splitting SI (sulfur- iodine) process by electro-electrodialysis. The electroelectrodialysis (EED) was carried out to improve HI concentration process in the thermochemical watersplitting H2SO4 (Sulfur-Iodine) process.. Thermochemical water-splitting cycle representing a modification of the classical H2SO4 cycle is proposed carried out by Prosini et al, (2009).Thermodynamics studies were carried out thermogravimetric and differential thermal analysis. Finally an energy balance to evaluate the theoretical energy efficiency was computed. Caple at al, (2015) conducted experimental modeling of hydrogen producing steps in a novel sulfure-sulfur thermochemical water splitting cycle. This study the results of the experimental and modeling work warrants further development of this novel sulfur-sulfur thermochemical water splitting cycle. Mawdsley et al (2012) studied sulfur trioxide electrolysis studies: Implications for the sulfure iodine thermochemical cycle for hydrogen production. In this paper we describe our efforts to develop a sulfur trioxide (SO3) electrolyzer that could lower the temperature of the SO3 decomposition step in the sulfure iodine and hybrid sulfur thermochemical cycles. The plant sizing and evaluation of hydrogen production costs from advanced processes coupled to a nuclear heat source sulphur iodine cycle performed by Leybros et al, (2010). This paper they presents the analysis conducted for the sulphur iodine cycle, which leads to a hydrogen production cost around 12 euro/kg. The main contributions to that cost are discussed. Steinfeld (2002), reported a two-step thermochemical cycle for hydrogen production from water using solar energy and evaluated exergy efficiency of 29% and 36% for two different solar concentration ratios namely 5000 and respectively. Zedtwitz et al. (2006), studied hydrogen production via solar thermal 446

. II.")

2 decarbonisation of fossil fuels using three different routes and reported an exergy efficiency of 32% for solar decomposition of Natural gas, 46% for solar steam reforming of Natural gas and 46% for solar steam gasification of coal. In recent years many studies on hydrogen production via various thermochemical and hybrid cycles have been performed by many researchers. But a few studies are discussed and compared energy and exergy analyses of H2SO4 cycle. The main purpose of this paper is to discuss energy and exergy analyses of solar based on H2SO4 cycle. Therefore, energy and exergy analyses of the system is carried out by EES (Engineering Equations Solver). II. Description of cycles Here, H2SO4 cycle is selected for a performance assessment in the present study and is described below. The H2SO4 cycle a temperature between 80 and 850 o C is required for different steps. Theoretically, the H2SO4 cycle is accomplished in three steps. The H2SO4 cycle is a both heat and electricity to produce hydrogen from water at a maximum process temperature of 850 o C. The H2SO4 cycle consists of the following three chemical reactions: H2SO4 H2O+SO2+1/2O2 I2+SO2+2H2O 2HI+H2SO4 2HI I2+H2 (I) (II) (III) The schematic diagram for H2SO4 the process are illustrated in Fig 1. In the step I the H2SO4 decomposition reaction is an endothermic that produce oxygen (O2) at the end. This reaction proceeds in two stages; at first, gaseous H2SO4 decomposes into H2O and SO3 at 400 C- 500 C. Secondly, SO3 decomposes into SO2 and O2 at about 800 C with the help of a solid catalyst. Fig 1. Schematic illustration of H2SO4 cycle (Adapted from Orhan, 2011) The reaction in step II is called Bunsen reaction, in which exothermic sulfur dioxide (SO2) gas absorption takes place in the liquid phase at 20 C-100 C. Gaseous SO2 reacts with iodine (I2) and water (H2O) to generate an aqueous solution of hydriodic acid (HI) and sulfuric acid (H2SO4). Then the two kinds of acids that produced at the end of reaction are separated by liquid-liquid phase separation in the existence of excess iodine. The HI breakdown reaction step III generates hydrogen with a low endothermic heat of reaction at 300 C-500 C in the gas phase. The reaction can also be carried out in the liquid phase (Orhan, 2011; Xinxin and Kaoru, 2005). By carrying out these three reactions in sequence, water is decomposed into hydrogen and oxygen as a net result of cycle. Thermochemical water decomposition, potentially driven by solar energy with a The H2SO4 cycle splits water into hydrogen and oxygen. Fig 2. A schematic flow diagram of solar based H2SO4 cycle 447
3 III. Analysis The thermodynamic analysis of the considered system is general based on the principles of mass, energy and exergy balance for the each control volume. For this purpose, we perform following assumptions to solve the balance equations; The considered system runs at steady state with a constant solar irradiation. The pressure drops and heat losses are negligible. The kinetic and potential energies are negligible. The reference environment temperature (T0) and pressure (P0) values are 298 K and 100 kpa, respectively. In the chemical reaction, reactants and products is a pressure of 1 atm. The electrochemical cell potential is assumed as 0.54 V. For a general steady-state, steady-flow process, the three balance equations, namely mass, energy and exergy balance equations, are employed to find the work input, the rate of exergy destruction, energy and energy efficiencies. For the steady-state process, the mass, energy and exergy balance for the each control volume can be expressed as follows: m in = m out or m R = m P (1a) (1b) where m is the mass flow rate, and the subscript in stands for inlet and out for outlet and also subscript R stands for reactants and P for products.. The general energy balance can be expressed in the rate form as; E in E out = E s (2) which becomes ; Q W = M OUTH OUT M INH IN (3) where Q and W denote heat and work, respectively. The heat transfer for a chemical process involving no work is determined from the energy balance. For a steady-state reaction process, the energy balance reduces to; Q W = n P (h f + h h ) P n R (h f + h h ) R (4) where h f is specific enthalpy of formation, h is specific enthalpy at reference state and h is specific enthalpy in kj/kmol, n stands for number of moles and subscripts R and P represents reactants and products, respectively. Exergy analysis can be used beneficially to analyze 448 and improve the efficiency. The exergy balance for a process can be written as; Ex sys = E x in E x out E x dest (5) where E x in and E x out are the rate of net exergy transferred by heat, work and mass, and E x dest is the rate of exergy destruction. For a steady-state system, Ex sys is zero, so Eq. (5) becomes; E x Q E x W + E x mass,in E x mass,out = E x dest (6) The exergy associated with a process at a specified state is the sum of two contributions: physical and chemical: ex = ex ph + ex ch (7) By ignoring the specific kinetic and potential exergy of the compounds, specific exergy term can be written as: ex = (h h 0 ) T 0 (s s 0 ) + ex ch (8) where h is enthalpy, s is entropy, and the subscript zero indicates properties at the reference (dead) state of P0 and T0. The last step of H2SO4 cycle reaction III, involves electrolysis, the amount of electrical energy demand is calculated using the Nernst equation in a given state, depending on the change in Gibbs free energy, G, as shown by (Barbir, 2005). G = nfe (9) where F denotes Faraday s constant, which is taken as C/mol, E is the cell potential of the cells and n is the number of moles of electrons exchanged in an electrochemical reaction. Electrical energy demand is determined by; W el = G (10) After writing mass, energy and exergy balances for the system, the enthalpy and entropy values of each compound and elements of H2SO4 cycle are evaluated with Shomate equations. h h 0 = AT + B T2 + C T3 + D T4 E 1 + F H (11) T s = Aln(T) + BT + C T2 2 + D T3 3 E 1 2T 2 + G (12) where T is 1/1000 of the specified temperature (in K) of compound and A, B, C, D, E, F,G and H are constants, as given in Table 1 for reactants and products. The exergy efficiency of the steps can be written as; ψ step = Eẋ out Eẋ in (13) where Eẋ in is the specific exergy that enters with the reactants plus heat, and Eẋ out is the specific exergy
4 exiting the system with the products plus heat. The overall energy efficiency of the H2SO4 cycle, can be described as; η overall = LHV H2 Q+W el (14) where Q is the heat supplied to the cycle, as the lower heating value of hydrogen which is taken as kj/mol. W el is the electrical energy demand of the electrolysis step. Table1. Enthalpy of formation reference entropy and Shomate constant for chemical compounds (Nist, 2016) Compounds h f0 (kj/mol) s 00 (kj/mol*k) A B C D E F G H H2SO H2O (850 o C) SO SO O I2 (120 o C) HI H I2 (450 o C) H2O (120 o C) The exergy efficiency of the overall system is defined as the ratio of the exergy of the hydrogen (H2), over the total exergy input, which can be determined from ψ overall = E x H 2 Eẋ in +W el (15) where Eẋ in is the thermal exergy input to the process and W el is the electrical energy demand of the step III, and E x H2 is the exergy content of hydrogen produced by the cycle. IV. Results and discussion This paper presents a theoretical performance evaluation of solar based H2SO4 cycle for hydrogen production system through energy and exergy analyses. In Fig. 3, the variation of exergy efficiency for the step I with reaction temperature is shown for reference temperatures 298 K. As can be seen in this figure, exergy efficiency of this step I decreases with the reaction temperature increases from 1073 K to 1173 K. Energy Efficiency T 0 =298 K Reaction Temperature (K) Energy Efficiency Exergy Efficiency Fig 3. Effects of the reaction temperature on the exergy efficiency for the step I. The variation of exergy efficiency for the step II with reaction temperature is shown for two reference 0.71 Exergy Efficiency 449 temperatures of from 278 K to 298 K, respectively seen in Fig 4. Exergy efficiency of this step II decreases with the reaction temperature increases from 303 K to 393 K for all reference temperatures. As can be seen in this figure, at higher reference environment temperature exergy efficiency becomes lower. Exergy Efficiency Reaction Temperature (K) T 0 =298K T 0 =278 K Fig 4. Effects of the reaction temperature and reference environment temperature on the exergy efficiency for the step II. The variation of energy and exergy efficiency rates for step III with the reaction temperatures is shown in Fig. 5. In this figure, energy and exergy efficiency are increases with the reaction temperature varying from 623 K to 723 K. This step also hydrogen production step. While environment temperature is 298 K in Fig. 5, the exergy efficiency of the step III is calculated to 89.8 % reaction temperature at 723 K. The overall energy and exergy efficiencies of the cycle are calculated. It is found that energy and exergy efficiencies of the system become 63.39% and 43.85%, respectively, at a reference environment temperature of 298 K. The variation of energy and exergy efficiencies of the cycle with the reference environment temperature is illustrated in Fig. 6. The exergy efficiency of the overall cycle increases from 58.68% to % with the
5 reference environment temperature increasing from 258 K to 298 K, although energy efficiency of this cycle remains constant while the reference environment temperature increasing. of producing hydrogen at a large scale with no harmful greenhouse. Thus, proposed cycle has good potential and appears to be promising thermochemical cycle in following years Nomenclature Exergy Efficiecny Efficiecny Fig 5. Effects of the reaction temperature on the exergy and energy efficiency for the step III Fig 6. Variation of energy and exergy efficiencies of the H2SO4 cycle with the reference environment temperature. V. Conclusions Exergy Efficieny Energy Efficieny Reaction Temperature (K) T 0 =298 K Reference Environment Temprature (K) Energy Efficiecny Exergy Efficiecny There are a few paper related to this H2SO4 cycle in literature. In this study analyzed of a solar based on H2SO4 cycle for hydrogen production through energy and exergy. In this regard, we have presented both energy and exergy efficiencies of the overall cycle, but only in this analyses solar heliostat system considered for heat demand of the heat exchangers. Some concluding remarks can now be drawn from this study as follows; The energy and exergy efficiency H2SO4 cycle are calculated as 43.85%, and 63.39% respectively based on the conditions and parameters consider. The H2SO4 thermochemical cycle is one of the promising hydrogen production methods without emitting any greenhouse gases to the atmosphere. For the step III electrolysis at 0.54 V requires kj(e) per mol H2 produced. This study is conducted to provide an alternative way Energy Efficiency 450 E Cell potential E Energy rate, kw E x Exergy rate, kw ex ph Specific physical exergy, kj/kg ex ch Specific chemical exergy, kj/kg F Faraday s constant, C/kmol g Gravitational acceleration, m/s 2 h f Specific enthalpy of formation, kj/mol h Specific enthalpy, kj/mol h Specific enthalpy at reference state, kj/mol n Molar flow rate, mol/s n Number of moles, mol G Change in Gibbs free energy, kj η Energy efficiency ψ Exergy efficiency D destruction el electricity f formation in input, inlet out output, outlet P product R reactant r reaction s system 0 reference or dead state References Awad HA, Veziroglu TN. Hydrogen vs synthetic fossil fuels. Int J Hydrogen Energy,9:355-66(1984). Balta, M. T., Dincer, I., Hepbasli, A. Performance assessment of solar-driven integrated Mg-Cl cycle for hydrogen production, International Journal of Hydrogen Energy, 39, (2014). Barbir F. PEM fuel cells theory and practice. Elsevier; (2005). Brown LC, Besenbruch GE, Lentsch RD, Schultz KR, Funk JF, Pickard PS, et al. High efficiency generation of hydrogen fuelsusing nuclear power, General Atomics Project 30047, Final Technical Report GA- A24285, Beghi GE. A decade of research on thermochemical hydrogen at the Joint Research Centre, Ispra. International Journal of Hydrogen Energy,11(12):761-71(1986). Carty RH, Mazumder MM, Schreider JD, Pangborn JB. In: Thermochemical hydrogen production, vol. 1e4. Chicago, IL: Gas Research Institute for the Institute of Gas Technology; p. GRIe80/0023 (1981).
6 Caple, K., Kreider, P., Yeung, N.A., Yokochi, A., Experimental modeling of hydrogen producing steps in a novel sulfuresulfur thermochemical water splitting Cycle, International Journal of Hydrogen Energy, 40, (2015). Dincer I. Technical, environmental and exergetic aspects of hydrogen energy systems. Int J Hydrogen Energy, 27:265-85(2002) Dincer I. Energy and environmental impacts: present and future perspectives. Energy Sources,20(4/5):427-53(1998). Hwang, G.J. Onuki, K., Nomura, M., Kasahara, S., Kim, J.W., Improvement of the thermochemical watersplitting IS (iodine sulfur) process by electroelectrodialysis, Journal of Membrane Science, 220, (2003). Science, Mechanical Engineering Program University of Ontario Institute of Technology, 264p, (2011). Yilmaz, F., Balta, MT., Selbas, R., A review of solar based hydrogen production methods, Renewable and Sustainable Energy Reviews, 56, (2016) Zedtwitz PV, Petrasch J, Trommer D, Steinfeld A. Hydrogen production via the solar thermal decarbonisation of fossil fuels. Solar Energy, 80: (2006). Xinxin W., Kaoru O., "Thermochemical water splitting for hydrogen production utilizing nuclear heat from an HTGR", Tsinghua Science and Technology, Vol. 10, pp , (2005). Mawdsley, J.R., Carter, J.D., Myers, D.J., Lewis, M.A., Krause, T.R., Sulfur trioxide electrolysis studies: Implications for the sulfure iodine thermochemical cycle for hydrogen production, International Journal of Hydrogen Energy, 37, , (2012). McQuillan BW, Brown LC, Besenbruch GE, Tolman R, Cramer T, Russ BE. High efficiency generation of hydrogen fuels using solar thermo-chemical splitting of water: annual report, GA-A24972, San Diego, CA; National Institute of Standards and Technology (NIST). [accessed ]. Pregger T, Graf D, Krewitt W, Sattler C, Roeb M, Moller S. Prospects of solar thermal hydrogen production processes. International Journal of Hydrogen Energy, 34: (2009). Prosini, P.P., Cento, C., Giaconda, A., Caputo, G., Sau, S., A modified sulphur iodine cycle for efficient solar hydrogen Production, International Journal of Hydrogen Energy, 3, (2009). Ratlamwala, T.A.H., Dincer, I., Aydin, M., Energy and exergy analyses and optimization study of an integrated solar heliostat field system for hydrogen production, International Journal of Hydrogen Energy, 37, (2012) Steinfeld A. Solar hydrogen production via a two-step water splitting thermochemical cycle based on Zn/ZnO redox reactions. International Journal of Hydrogen Energy,27: (2002). Orhan, M.F., A Thesis Submitted in Partial Fulfillment of the Requirements for the Degree of Doctor of Philosophy, The Faculty of Engineering and Applied 451
7 Exergoeconomic and Optimization of a Solar Based Integrated Energy System for Hydrogen Production Shoaib Khanmohammadi 1,*, Parisa Heidarnejad 2, Nader Javani 3, Hadi Ganjehsarabi 4 1 Department of Mechanical Engineering, School of Energy, Kermanshah Universityof Technology, Kermanshah, Iran 2 Faculty of Environment, University of Tehran, Tehran, Iran 3 Department of Mechanical Engineering, Yildiz Technical University, Istanbul, Turkey 4 Department of Mechanical Engineering, Erzincan University, Erzincan, Turkey *Corresponding author: [email protected] Abstract Rapid growth of population, depletion of fossil fuel resources and associated greenhouse gas emission make alternative energy resources increasingly important for the near future. In the recent years, solar energy has attracted a huge attention and a noticeable growth in many regions of the world. In the current research, an integrated renewable based energysystem consisting of asolar flat plate collector is used to generateelectricity, provide cooling load and hydrogen production as an energy carier. A parametric study to determinethe main design parameters and their effects on the defined objective functions is carried out. Moreover, a multi objective optimization is implemented in order to introduce the optimal design conditions based on evolutionary genetic algorithm. Keywords: Flat palate collector, multi objective, chiller, total cost rate, exergy efficiency I. Introduction Figuring out a creative way and at the same time a feasible way to recover energy from solar irradiation without greenhous gas emission, has been one of the major challenges in the very recent years. Designing a system with higher efficiency and lower cost is one of the most important issues in the field of thermodynamic system design (Ahmadi, Dincer et al. 2015). Solar flat plate collector with simple design and feasible construction process is one of the promising technology can be used to utilize this renewable energy source (Ahmadi, Dincer et al. 2013). Since 1980s, different types of solar collectors such as solar dishes, parabolic trough, and solar tower is used to produce energy products. The key point in a solar system design is suitable combination of subsystem to gain the maximum performance with minimum expend cost. There is a numerous study devouted to design of the solar based energy system. Farahat et al. (2009) developed a model for optimization of a flatplate collector to determine the optimal performance parameters. In a part of their study a simulation program to calculate the thermal and exergetic performance of a flat plate collector was developed. The result of their numerical study showed a good agreement with experimental measurments. Hepbasli (2008) performed a comprehensive review on exergtic analysis and assessment of renwable energy sources for sustainable future. The study covers a wide range of renwable energy resources. The solar energy includes a complete formulation of exergy and definition of exergy efficiency for flaty plate collectors. The solar flat plate collector can provide the hot water less than 100 which is suitable inorder to feed the other energy system. Berhane et. al. (2010) investigated a solar assisted absorption chiller to produce cooling capacity. Since the cooling demand coincident with availability of solar radiation, this system can be promising obtion for the region with hot climate. Their analysis include bi-criteria optimization of proposed systembased on minimization of the total cooling cost and measured environmental cost over system entire life cycle. The need for fresh water in the area with high intensity solar radiation is an interesting option. Agustin et al.( 2010) analysed and optimizeda low temperature solar organic Rankine cycle (ORC). The proposed system include the use of solar radiation as a prime mover to produce fresh water via reverse osmosis (RO) process. Their result showed that the minimum apparatus area with R227ea as working fluid in solar irradiance 1000 W/m 2 and condensation temperature of 30 will be achieved. In the present research, an integrated system comosed of a solar flat plate collector, an organic Rankine cycle (ORC), a PEM electrolyzer and a single effect absorption chiller is designed and optimized. A parametric study to determine the effective parameters on the system performance is carried out. An evolutionary optimization to find the optimum conditions for poropsed system is implemented. II. System Description The integrated system in this study is composedof a solar flat plate collector, an organic Rankine cycle (ORC), a PEM electrolyzer and a single effect absorption chiller as shown in Figure 1.Performance and design parameters for the hybrid system in the initial state are shown in Table
8 Tab. 1: Some Performance charectristics of the system Parameter Unit Value Flat plate collector area (A p ) m Inlet temperature to collector 27 Collector mass flow rate kg/s 5 Incident solar energy per unit area of the absorber plate (I) W/m Optical efficiency (η = τα) Organic RankinevCycle maximum temperature (T 3R ) 50 Water temperature inlet to ORC evaporator (T 3s ) 60 The ratio of ORC output electricity feed to PEM (-) 0.5 Figure 1 shows a schematic of a hybrid system and different components in the cycle to be discussed. III. Thermodynamic Modeling The components of the hybrid system considered under steady state condition as a control volume. III.1. Flat plate solar collector As shown in Figure 1, water enters the solar collector at point 1s and is heated. The useful heat gained rate by the working fluid can be written as Q u = m colc p (T 2s T 1s ) (1) where T2s, T1s, Cp and m col are the water outlet temperature, inlet temperature, specific heat at constant pressure and mass flow rate. The Hottel-Whillier equation for the heat gained by the flat plate collector considering heat losses from the collector is calculated as (Farahat, Sarhaddi et al. 2009): Q u = A P F R [(τα)i Q L ] (2) wheret0 is the ambient temperature and the FR is heat removal factor, defined as: F R = m colc p [1 e { F U l A P m col C p } ] (3) U l A P Here, F is collector efficiency factor which is approximately for this case and Ul is the overall collector loss coefficient, obtained from (Farahat, Sarhaddi et al. 2009) In equation (2)(τα) is optical efficiency and Iis solar radiation intensity s Condenser Desorber 8 Solution Exchanger 3s 9 W Evaporator 10 Absorber R O.R.C. Turbine G Electricity O.R.C. Evaporator 4R O.R.C. Condenser C2 H2O in T=TPEM Heat Heat E xchanger H2O ( K) H2O; O2 1s O.R.C. Pump C1 PEM electrolyzer H2 O2 Seprator 2R 1R O2 Wp Fig. 1: Schematic diagram of hybrid system integrated with solar flat plate collector Hot H2O Also, Q L in equation (2) is defined as: Q L = U l (T in T 0 ) (4) The energy efficiency of the solar flat plate collector is expressed asη = Q u IA P III.2. Organic Rankine Cycle According to the schematic of the main system shown in Figure 1, the hot water enters the Organic Rankine Cycle evaporator at point 3S and drives this cycle. The governing equations of the Organic Rankine Cycle at steady state condition are as follows: Organic Rankine cycle operator: mcol h3s mcol h1s m2rh2r m3rh3r (5) Organic Rankine cycle turbine: T 3R 3R 4R W m h h (6) Organic Rankine cycle condenser: m h h m h h (7) cooling out,cooling in,cooling 1R 1R 4R 453
9 Organic Rankine cycle pump: is,pump h h h h 2s III.3. PEM Electrolyzer (8) In this research hydrogen is used as our energy carier. Thus, a PEM electrolyzer for hydrogen production is used. The electricity and heat arefeed to the electrolyzer to drive the electrochemical reactions in PEM electrolyzer. As shown in Figure 1, liquid water at ambient temperature enters a heat exchanger that heats it to the PEM electrolyzer temperature before it enters the electrolyzer. Leaving the cathode at the reference temperature, the hydrogen produced stored in a storage tank. The oxygen gas produced at the anode is separated from the water and oxygen mixture and then cooled to the reference environment temperature. The remaining water is returned to the water supply stream for the next hydrogen production cycle. The overall PEM electrolysis reaction is water splitting, i.e., electricity and heat are used to separate water into hydrogen and oxygen. More details about thermochemical modeling of the PEM electrolyzerare given elsewhere (Ahmadi, Dincer et al. 2013). III.4. Absorption Chiller The principle of mass conservation and the first and second laws of thermodynamics are applied to each component of the single-effect absorption chiller. The governing and conservation equations for total mass and each material of the solution for a steady state and steady flow case follow (Khanmohammadi and Azimian 2013): m i m o ( m x) i ( m x m ) 0 (9) (10) Here, is the working fluid mass flow rate and x is mass concentration of Li-Br in the solution. For each component of the absorption system, a general energy balance is written (Ameri, Ahmadi et al. 2008): Q W m h o o (11) m h The cooling load of the absorption chiller is defined as: Q cooling = m (h 11 h 12 ) (12) Further information about the thermodynamic modeling and energy balances for each component is given in(palacios Bereche, Gonzales et al. 2012). III.5. Economic Modeling The main aim of the economic modeling is to obtain i i 454 the cost functions of each component and a calculation of the final cost rate of the system. There are various methods for determining purchase equipment cost in the terms of the designed parameters. Here, the function presented by Bejan et. al. (Bejan and Moran 1996), Ahmadi (Ahmadi 2013), Khanmohammadi and Azimian (Khanmohammadi, Azimian et al. 2013) with some modifications done in accordance with local conditions and interest rate in Iran. The following table shows the cost functions for each component of the hybrid system in terms of design parameters. Tab. 2: Cost functions for each component Components Cost functions ORC Evaporator ORC Pump ORC Turbine ORC condenser Absorption chiller Flat plate collector Z Z Z Z Z Z EVA Pump tur 0.85 Eva 0.65 Pump 0.75 tur A A 200 W 4750 W Condnser Chiller Flat plate Q 235 A Condnser 0.67 eva flatplate Since each device in a system is expected to be working in a specific time frame, the cost rate of each device is a good indicator to calculate the cost rate in $/s represented by Z. The cost rate of each device is determined as (Khanmohammadi, Atashkari et al. 2015): Z = Z kcrfφ N 3600 (13) where Zk is the purchase cost of the kth component, and CRF is the capital recovery factor (equation (14)). Also, N is the annual number of operation hours for the unit, and φ is the maintenance factor, which is often III.6. System Assesment To perform an exact evaluation of the system and the impact of the design parameters on thermodynamic and economic performance, the exergy efficiency and the final cost rate are considered as two objective functions. These objective functions are defined as follows: m Ex Ex Ex H2 H2 cooling Electricity (14) Ex in,coolector C Z Z Z Z total Flat plate PEM Pump,R EV,R Z Z Z Tur,R cond,r Chiller III.7. Optimization (15) A multi-objective optimization using the evolutionary genetic algorithm and the objective functions as system exergy efficiency and final cost rate for a trigeneration system is carried out. The decision
10 variables from the system parameter study and their effect on the objective functions are determined. In this study, given the parameter analysis of the system, five variables influencing the system performance are taken into account. These parameters includemaximum ORC temperature ( ), inlet temperature to ORC evaporator ( A P T 3S T 3R ),total area of flat m col ) plate collector ( ), collector mass flow rate ( and solar radiation intensity (I) that are selected as decision variables. The following table shows the reasonable range of each of the parameters and also relevant restrictions. Tab. 3: Decision variables and their reasonable range Restriction Cause 44 T3R 54 Thermodynamic Limitation 55 T3S 65 Thermodynamic Limitation 3000 A 8000 Commercial limitation col P 3 m I 6000 Technical limitation Environmental Limitation Using aniterative method and stochastic search strategy and by modeling of life evolution process, genetic algorithm seeks to find the optimal solutions. The main characteristic of evolutionalgorithms is a population in which people are regarded as a series of design parameters and decision variables and the optimal solution will be chosen among them. IV. Results and Discussion This section includes the result of analysis of the integrated system, parametric study based on defined objective functions and multi objective genetic algorithm based optimization of system. IV.1. Exergy and Economic Analysis of Hybrid System The results of exergy and economic analysis of hybrid system arepresented in Table 4. Tab. 4: Exergy and economic analysis results Parameter Unit Value Electricity out put kw 15.4 Qooling capacity kw 48.8 Hydrogen Production rate kg/day 0.28 Total exergy efficiency (%) 2.07 ORC turbine cost rate $/h 9.69 ORC pump cost rate $/h 0.05 ORC evaporator cost rate $/h ORC condnser cost rate $/h Solar flat plate cost rate $/h Absorption chiller cost rate $/h 2.31 PEM electrolyzer cost rate $/h 2.27 Total cost rate of system $/h As it can be seen, the exergy efficiency of the system is 2.07 % which is relatively low compare to other energy systems which isdue to the fact that energy from sun with high temperature convert to other form of energy in a relatively low temperature so a large part of exergy destructs can be seen in this process. The results of economic analysis indicate that a large part of total cost rate of the system devote to the solar flat plate collector. The cause of high cost rate of the flat plate collector is the big size of this component and large area of this apparatus. IV.2. Parametric Study Results The effect of the main decision variables on the performance of the hybrid system is investigated. Figure 2 show the effect of the collector mass flow rate variation on two defined objective functions. It can be seen that an increment in the mass flow rate of collector increase overall exergy efficiency and total cost rate of system. Overal exergy efficiency (%) Collector mass flow rate (kg/s) Fig. 2: Variation of two objective functions with collector mass flow rate Figure 3 presentsvariation of the different outputs of system with the collector mass flow rate variation. It can be found that in the higher collector mass flow rate the hydrogen production rate and electricity increases while cooling capacity experience an increment and decrement as it can be seen. Out put (kw) Cooling Electricity Collector mass flow rate (kg/s) Fig. 3: Variation of main outputs of system with mass flow rate of collector The effect of maximum ORC temperature on objective functions is illustrated in Figure 4. As it can be concluded the results show that improvement one objective deteriorate another. This characteristic is so important in the multiobjective optimization Total cost rate ($/h) 7 Hydrogen production rate (kg/day)
11 Overall exergy efficiency (%) T 3R ( C) Fig. 4: Effect of maximum ORC temperature on objective functions Also, result show that the cooling capacity is not sensitive to T3R, while an increase in this parameter has a positive effect on the hydrogen production rate and electricity of the system (Figure 5). Output (kw) Fig. 5: Effect of maximum ORC temperature on outputs Since the solar radiation intensity,varies during the day and changing this parameter affects the system performance,it selected as one of performance parameter. The results for changing this parameter show that electricity output no change with variation of solar radiation intensity while cooling capacity increase with increment of this parameter. in adittion, it can be found that with these change as it can be seen in Figure 6 the overall exergy efficiency of system expereince a severe decrement. Output(kW) T 3R ( C) Q cooling Electricity Electricity Q cooling Solar radiation intensity (W/m 2 ) Fig. 6: Effect of solar radiation intensity on the overall exergy efficiency and outputs From Figure 7 It can be seen that reduction the collector Total cost rate ($/h) Hydrogen Production rate (kg/day Overall exergy efficiency (%) area leads to increase the overall exergy efficiency and total cost rate of the system, which is two positive change. But it should be mentioned that lower collector area menas that lower out put of the system. Overall exergy efficiency (%) Collector area (m 2 ) Fig. 7: Effect of collector area on objective functions The effect of an increment in the collector area on the oututs is illustrated in the Figure 8. The results reveal that with an increase in collector area electricity has no change while cooling load and and exergy destruction rate of the system expreince a large growth. Total exergy destruction (kw) Fig. 8: Effect of collector area on the exergy destruction rate and some outputs Another important parameter, which has a significant effect on the performance of the system is the inlet temperature to the ORC evaporator (T 3s ). Figure 9 show that increasing this temperature from 55 to 57 decrease the total cost rate of the system and after that from 57 to 65 the total cost rate has a sharp increment. Also, overall exergy efficiency of the system continuously increases with the increament the inlet temperature to the ORC evaporator. Overal exergy efficiency (%) Collector area (m 2 ) Electricity Qcooling Fig. 9: Effects of (T 3s ) on the objective functions T3s ( C) Total cost rate ($/h) Output (kw) Total cost rate ($/h) 456
12 To better understanding the cause of these changes variation of main outputs of system with the change of (T 3s ) is investigated in Figure 10. The analysis of result indicate that the increment of (T 3s ) has a negative effect on cooling capacity of system which can decrease it from 60 kw to 38 kw, while electricity and hydrogen production rate of system increase for the same range of change for (T 3s ). Tab. 5: Charectristics of selected points on Pareto curve Points A B C T 3R ( ) T 3s ( ) A P (m 2 ) m col(kgs 1 ) I (w/m 2 ) Outputs (kw) Fig. 10: Effects of (T 3s ) on the main outputs IV.3. Optimization Results Q cooling Electricity The Pareto front diagram for two objective functions and the range of the changes in decision variables are depicted in Figure 11. As it could be seen, by an increase in the system efficiency, the final cost will be increased. The point A on the curve shows the optimal state for the cost, irrespective of the efficiency as the objective function. In addition, the point C shows the best point when the only objective function is the system efficiency. It is clear that both functions cannot remain at the most optimal modes. Fig. 11: The diagram of Pareto front for two objective functions in terms of changes in the decision variables As it could be seen from Figure 11, the ideal point with such characteristics is not a component of the problem solving points on Pareto curve. Although all the points on the curve are the optimal solutions of the problem, the closest point to the ideal point on the Pareto curve in terms of distance can be considered as a final optimal solution. Which for this problem the point B can be select as optimal case T 3s ( C) Table 5 show the charecrtistics for the selected points (A-C) for the optimization problem Hydrogen production rate (kg/day) 457 As it can be seen (Figure 11), the optimal values of exergy efficiency and system cost rate on the Pareto curve change from 1.6% to 3.6% and from 125$/h to 165$/h, respectively. In order to find a suitable relationship between the exergy efficiency and final cost rate of the system, a curve is fitted on the points obtained from multi-objective optimization. The fitted curve relation can be express as follow: C (16) total V. Conclusions In this reseach, a detailed model of ahybrid system is performed. A parametric analysis is carried out on the design variables. In all of cases there is conflict between two defined objective functions namely exergy efficiency of the system and the final cost rate of the system. The most important results of this study include: Cost analysis shows that a large part of the cost price of the system is related to flat plate collector with $/h. The parametric analysis of the system shows that the collector mass flow rate variations in the considered range can enhance the system efficiency by 1.6 % to 3 %. The results indicate that the maximum Organic Rankine Cycle temperature increment in the given rangecan increasesthe hydrogen production rate from 0.24 kg/day to 0.36kg/day. The results of multi-objective optimization on the basis of the objective functions of the system under consideration indicate that the system exergy efficiency can increase up to 3.55%. Also, by considering the overall cost of the system as the only optimization objective, the overall cost rate decreases up to 125 $/h. By considering both objective functions namely exergy efficiency and the system overall cost, it is possible to consider the optimal point in terms of exergy and economic performance of the point B, which has the minimum distance to the ideal point. A useful and interesting relationship that shows the final cost rate function compared to efficiency function can be also used for predicting each of these functions in contrast to another function. Nomenclature A P 2 Area ( m )
13 C p Specific thermal capacity(kj/kgk) FR heat removal factor F Collector efficiency factor I Solar radiation intensity (W/m 2 ) Collector mass flow rate (kg/s) ORC Organic Rankine Cycle PEM Proton exchange membrane Subscripts in Inlet state out Outlet state R organic Rankine cycle S Solar Refrence state Greek symbols Operation and maintenance factor Exergy efficiency m col References Ahmadi, P. (2013). Modeling, analysis and optimization of integrated energy systems for multigeneration purposes, Faculty of Engineering and Applied Science, University of Ontario Institute of Technology. resources for a sustainable future." Renewable and Sustainable Energy Reviews 12(3): Khanmohammadi, S., K. Atashkari and R. Kouhikamali (2015). "Exergoeconomic multi-objective optimization of an externally fired gas turbine integrated with a biomass gasifier." Applied Thermal Engineering 91: Khanmohammadi, S. and A. R. Azimian (2013). "Exergoeconomic Evaluation of a Two-Pressure Level Fired Combined-Cycle Power Plant." Journal of Energy Engineering. Khanmohammadi, S., A. R. Azimian and S. Khanmohammadi (2013). "Exergy and exergo economic evaluation of Isfahan steam power plant." International Journal of Exergy 12(2): Palacios Bereche, R., R. Gonzales and S. A. Nebra (2012). "Exergy calculation of lithium bromide water solution and its application in the exergetic evaluation of absorption refrigeration systems LiBr H2O." International Journal of Energy Research 36(2): Ahmadi, P., I. Dincer and M. A. Rosen (2013). "Energy and exergy analyses of hydrogen production via solar-boosted ocean thermal energy conversion and PEM electrolysis." International Journal of Hydrogen Energy 38(4): Ahmadi, P., I. Dincer and M. A. Rosen (2015). "Performance assessment of a novel solar and ocean thermal energy conversion based multigeneration system for coastal areas." Journal of Solar Energy Engineering 137(1): Ameri, M., P. Ahmadi and S. Khanmohammadi (2008). "Exergy analysis of a 420 MW combined cycle power plant." International Journal of Energy Research 32(2): Bejan, A. and M. J. Moran (1996). Thermal design and optimization, John Wiley & Sons. Delgado-Torres, A. M. and L. García-Rodríguez (2010). "Analysis and optimization of the lowtemperature solar organic Rankine cycle (ORC)." Energy Conversion and Management 51(12): Farahat, S., F. Sarhaddi and H. Ajam (2009). "Exergetic optimization of flat plate solar collectors." Renewable Energy 34(4): Gebreslassie, B. H., G. Guillén-Gosálbez, L. Jiménez and D. Boer (2010). "A systematic tool for the minimization of the life cycle impact of solar assisted absorption cooling systems." Energy 35(9): Hepbasli, A. (2008). "A key review on exergetic analysis and assessment of renewable energy 458
14 Exergy Analysis and Optimization of a Solid Oxide Electrolysis Cell for Hydrogen Production Abdullah A. AlZahrani 1,2*, Ibrahim Dincer 1 1 University of Ontario Institute of Technology, Faculty of Engineering and Applied Science, 2000 Simcoe Street North, Oshawa, Ontario, L1H 7K4, Canada. 2 Umm Al-Qura University, College of Engineering and Islamic Architecture, Department of Mechanical Engineering, Al Abdeyah, Makkah, 5555, Saudi Arabia. * [email protected] Abstract In this paper, a model is developed to include both exergy and electrochemical analyses, for the Solid Oxide Electrolysis Cell (SOEC) to analyse and assess its performance under optimized operating conditions and state properties for optimum hydrogen production. In this modeling study, the effects of a number of operating conditions, such as temperature and current density on the cell potential and energy and exergy efficiencies are investigated. The effects of operating temperature on the exergy destruction rate are also evaluated for a range of operating current densities. The overall Solid Oxide Electrolyzer energy efficiency is found to be 77%, while the exergy efficiency is 82.5%. The exergy destruction at reduced operating temperature increases significantly. Keywords: Solid oxide electrolysis cell, energy, exergy, high temperature electrolyzer, hydrogen production. I. Introduction The environmental challenge, which has been created by the increasing fossil fuel consumption and the subsequent carbon emission, mandates a significant attention not only to the economic cost of the current energy resources but also to the environmental consequences of using these resources. Renewable energy resources such as solar, wind, and geothermal energy are the most promising options to replace the finite fossil fuel resources, however, among the major limitations of these resources is that they are intermittent and site-dependent. This limitation reduces commerciality of these resources. Therefore, storage is required to reduce the mismatch between energy production and demand and also to facilitate subsequent transportation of this energy. Currently, batteries are the common storage solution integrated with renewable energy resources however batteries suffer low storage capacities and short lifetime. Using hydrogen as storage mechanism and carbon-free energy carrier, recently been pursued as promising storage alternative when produced form environmental friendly resource. Electrolysis technology is the technology that being relied on to produce hydrogen from water through a process involves electricity utilization to split water to oxygen and hydrogen. In contrast to conventional hydrogen methods that require hydrocarbons as a feedstock such as steam methane reforming (SMR), partial oxidation, and coal gasification, and emit massive amounts of carbon dioxide and other pollutant into the atmosphere, electrolysis can be clean technology and environmental friendly if renewable electricity resources utilized. Presently, only 4% of the total world hydrogen consumption is produced form electrolysis while about 96% is produced from the aforementioned conventional technologies (Dincer (2012)). The concept of hydrogen production using renewable electricity resources has been investigated in a number of research studies. For example, the solar photovoltaics (PV) powered low temperature electrolyzers estimated to achieve up to 13%. The interest in high temperature electrolyzers compared with low temperature electrolyzers is derived by the higher conversion efficiency and lower electricity consumption. Ni et al. (2007) conducted an energy and exergy analysis of solid oxide steam electrolyzer for hydrogen production. They pointed out that SOE is expected to switch from an endothermic mode to an exothermic mode with reducing the operating temperature. This is because of the increase in the cell polarizations (irreversibilities) which released in a form of heat may exceed the required thermal energy. It was also shown that the difference between energy and exergy efficiencies reduces with the reduction in the thermal energy to total energy fraction. Ni et al. (2006) investigated concentration overpotentials of solid oxide cell operating in electrolysis cell mode in comparison with fuel cell mode. They reported that in electrolysis mode the hydrogen electrode shows more vulnerability to high concentration overpotential, in contrast to fuel cell mode, where oxygen electrode was more vulnerable. The same authors also reviewed the development of hydrogen production using SOEC (Ni, Leung et al. 2008). Manage et al. (Manage, Hodgson et al. 2011) discussed the technical and economic aspects hydrogen production from different technologies. The authors focused on 459
15 the economic feasibility of the high temperature SOEs. They showed that for SOE technology can archive an efficiency of up to 90%. However, for SOEs to be competitive with conventional technologies such as SMR, which currently produces hydrogen at 2.50$/kg, environmental measures and regulation must be introduced to leverage the carbon free hydrogen and electricity resources. Buttler et al. (2015) conducted a techo-economic study on high temperature SOE-based hydrogen production using a 1-D model. They concluded that high temperature integration might be more economically viable compared with thermo-neutral operation. A number of researches leaped into experimental investigation of a lab and small scale SOECs and stacks. For example, Idaho lab have been pursuing the subject of high temperature SOE-based for hydrogen production though nuclear plants integration. Ebbesen et al. (2009) reported an SOEC test under different operating temperatures and reactants compositions. Furthermore, this study investigated co-electrolysis of water and carbon dioxide. Brisse et al. (2008) conducted a test of a button SOEC and reported the cell performance at different humidity levels. They also reported some electrochemical spectroscopy characterization of the cell. stack is then composed of a number of cells connected either in parallel or in series based on the required output stack power. Fig. 1: Schematic representation of the SOE plant for hydrogen production The schematic representation of a single SOEC and the different steams flowing in and out of the cell are shown in Fig. 2. The heat stream direction is to be determined based on the operating cell potential compared with thermos-neutral cell potential. The present study aims at evaluatng the technical performance of the hydrogen production using high temperature electrolysis. This is done though carrying rigors energy, exergy and analyses to assess the amount of produced hydrogen in the context of the different streams compositions and the overall system exergetic performance. II. System Description The layout diagram of the SOE system for hydrogen production is shown in Fig. 1. The system consists of a SOEC stack, two heat exchanges for heat recovery, a water pump, an oxygen circulation fan, and a separator to separate produced hydrogen from remaining water vapour. The SOE is assumed to be operating in an exothermic condition, where cells operating potential is higher than the thermo-neutral cell potential, however, in the case where heat is needed for start-up or for lower potential operation the required heat can be provided from external sources. The electricity is also provided form an external sources to drive the electrochemical reaction within the SOE cells and to power the pump, fan and other auxiliary units. An assumption introduced in some studies that incoming gasses are heated using the outgoing gases using a perfect heat exchanger. In this case, the heat exothermic reaction of the SOEC is consumed for internal heating of the SOEC and not vaporizing liquid water. The performance of the entire stack can generally be evaluated based on a single cell performance. The 460 Fig. 2: Schematic representation of a single SOEC The chemical reactions that take place within the cell are presented in the Table 1. In the overall reaction the heat assumed to be supplied to the cell (below thermos-neutral potential). Tab. 1: The half and overall reactions according to each SOEC electrode Reaction Type Chemical Reaction Anode Side 2e + O 2= 0.5 O 2 Cathode Side H 2 O + 2e H 2 + O 2= Overall Cell H 2 O + Q heat + W elec 0.5 O 2 + H 2 III. Analysis The principles of thermodynamics provide the framework of the current analysis, considering a steady state operating the mass, energy and entropy rate balance equations can be written over a control volume, assumed around the SOEC, as i m i e m e = 0 (1) Q cv W cv + i m i h i Q j j T j + i m i s i e m e h e = 0 (2) i m i s i + S gen = 0 (3)
16 Now, the exergy balance equation for steady state operation can be written as (1 T 0 j T j ) Q j W cv + i m i ex i e m e ex e E D = 0 (4) here, ex represents the specific exergy at each of the system streams which encompasses both physical specific exergy and chemical specific exergy. ex = ex PH + ex CH (5) The physical specific exergy at any steam in the system is given as ex PH = (h h 0 ) T 0 (s s 0 ) (6) The chemical specific exergy is commonly evaluated for different species and tabulated in a number of thermodynamics books. For a stream of a mixture of ex CH = Σx k ex k CH (7) In regard to the cell model, the cell potential is given as E = E r + η act + η ohm + η conc (8) The cell reversible potential is give thermodynamically as E r = g nf (9) By Nernest equation, reversible cell potential is given as E r (T, P i ) = E r (T, P) + RT ln nf (P H2 P 1/2 O2 P H 2O ) (10) The activation polarization is given Butler-Volmer equation as J = J 0 [exp ( αnfη a,act RT ) exp ( (1 α)nfη c,act )] (11) The activation polarization pertained to from electrodes: anode and cathode is given as η act,i = RT nf sinh 1 ( J 2J 0,i ) (12) J o,i = γ i exp ( E act,i RT ) (13) RT The ohmic polarization is calculated as η ohm = ρδj (14) The concentration is determined according to Ni et al. (2006), as η conc c = RT nf ln [( 1+ JRTδc eff 2FD H2O PH2 0 1 JRTδc eff 2FD H2O PH2o 0 )] (15) 461 η conc a = RT nf ln [(1 + JRTδ a eff 4FD O2 PO2 0 ) 0.5] (16) The entropy generated within the electrolyzer stake is also given as S gen = nf(η act+η ohm +η conc ) T (17) Then, the specific heat consumed or generated (based on the cell operation with above or below the thermos-neutral potential respectively) can also be written as q = TS gen T(s in s out ) (18) The energy and exergy efficiencies of the SOE are evaluated, respectively, as η en = η ex = m H 2 LHV Q heat +Q SOE +W SOE (19) Ex 7 Ex qheat +Ex qsoe +W SOE (20) The exergy destruction ratio is defined as y Dx = Ex DSOE Ex in (21) IV. Results and discussions An integrated energy, exergy and electrochemical SOE model is developed in EES software. The different streams are assumed ideal gases in a steady state operating condition. The cell parameters and assumptions are listed in Table 2. Tab. 2: List of parameters and assumption used in the modelling Parameter Value Cell operating temperature (K) 1073 Cell operating pressure (Pa) Operating current density, J (A/m 2 ) 5000 H 2O stream composition (molar H 2O 99%, H 2 1% fraction) Oxidant stream composition (molar O 2 99%, N 2 1% fraction) Anode exchange current density, J 0,a 0.65 (A/m 2 ) Cathode exchange current density, 0.25 J 0,c (A/m 2 ) Calculated effective diffusion eff coefficient at anode, D a (m 2 /s) Calculated effective diffusion eff coefficient at cathode, D c (m 2 /s) Anode thickness, δ a (m) Cathode thickness, δ c (m) Electrolyte thickness, δ e (m) Anode material LSM Cathode material Ni-YSZ Electrolyte material YSZ Pores diameter, D por (m) Porosity 0.3 Tortuosity 5 The results produced by the developed model validated by comparing it with published experimental
17 data obtained from Brisse et al. (2008). The predicted cell potential is shown in Fig. 3, as can be seen the model results fits within a maximum of 5% of the experimental data over the operating current density from A/m2. This serves as a satisfactory validation for the present model. The change in the cell potential and power density over with changing the supplied current density is shown in Fig. 4. It can be noticed that when operating at current densities in the range of A/m 2, the cell potential set to the range between V. The cell thermos-neutral voltage is estimated to be 1.29 V, accordingly, as the cell potential below the thermo-neutral the cell operate in an endothermic mode which means it requires heat for operation. Fig. 5: Changes in the cell overpotentials with changes in the operating current density The cell energy and exergy efficiencies are evaluated over the change in the current density in Fig. 6. The efficiencies increase with increasing the cell operating current density. They reached their maximum between current densities of A/m 2. The SOE achieved a maximum energy efficiency of 77% while the maximum exergy efficiency reached is 82.5%. These figures are in alignment with the published researches Fig. 3: Current model validation with experimental data obtained from Brisse et al. (2008) Fig. 6: Changes in energetic and exergetic efficiencies of the SOE plant over the change in operating current density Fig. 4: Change in cell potential and power density with in the operating current density The different SOEC polarization curves are plotted in Fig. 5 against the current density. In this figure, activation polarization is observed as the dominant voltage loss, followed by ohmic polarization and concentration polarization. Concentration polarization was the minimum with a maximum of about 10% of activation polarization. As expected all these polarization increases with increasing the operating current density. In Fig. 7 the effect operating temperature on the SOE exergy destruction and power density requirement is evaluated. The figure shows a significant impact of the operating temperature on the system performance exergy destruction rate is very high accordingly the power density required for operating is very high. However, with increasing the operating temperature the exergy destruction rate decreases and consequently the power density. 462
18 Fig. 7: Changes in energetic and exergetic efficiencies of the SOE plant with the changes in heat exchangers effectiveness. The main reason behind the increased exergy destruction at lower operating temperature is the fact that the cell electrolyte conductivity drops which leads to significant increase in the ohmic polarization due to the limited oxide ion conductivity. This issue is one of the major drawbacks of the SOEC that uses ytteria stabilized zirconia (YSZ) as an electrolyte. Therefore, extensive efforts have dedicated to develop different electrolyte materials that can achieve better performance at lower operating temperature. Developing this type of cells with reduce the manufacturing cost and lead to commercialization of this technology. In Fig. 8 the effect of the operating temperature on the exergy destruction ratio for the SOE is shown. IT can be observed that at low operating temperatures the electrolyzer operation is almost impossible due to the significant exergy destruction rate compared with the required input exergy. Fig. 8: Changes in the cell overpotentials with changes in the operating current density V. Conclusions Energy and exergy analyses of a SOE are conducted to evaluate the system performance and assess the different energy losses, exergy destruction, and electrolyzer hydrogen production efficiencies. The operating parameters such as current densities and electrolyzer operating temperature are the major 463 factors which were the focus of this study to highlight the impact of these parameters on the efficiencies and the operation in general. Through this study it was observed that operating current density and electrolysis cell potential are vital factors based on which the electrolyzer mode of operating will be determined and accordingly whither heat is required to be supplied or removed from the electrolyzer. This will also determine how much heat is needed. The option of operating in a above the thermos-neutral, at thermos-neutral, or below the thermos-neutral is subjected to a trade-off between increasing the cell internal losses or providing external source of heat. The system achieved energy and exergy efficiencies of 77% and 82.5%, respectively. Reducing the electrolyzer operating temperature significantly increased the exergy destruction rate within the SOE, in spite of the fact that thin electrolyte (δ e = 12.5 μm) substrates are assumed in this study. Therefore, the high operating temperature (>1000K) is still a major limiting factor of this technology as providing steam as such temperature would be challenging and expensive. The opportunity of this technology may rise in the integration options where steam can be acquired at relatively high temperature and require further superheating before been introduced to the SOE for hydrogen production. Nomenclature A :Area (m 2 ) D :Effective diffusion coefficient (m^2/s) E :Cell potential (V) Ex :Exergy rate (W) F :Faraday s constant, F=96,487 (C/mol) h :Enthalpy (J/kg) I :Direct solar radiation (W/m^2) J :Current density (A/m2) LHV :Lower heating value (J/kg) n :Number of transferred electrons P :Power density (W/m^2) Q :Heat rate (W) R :Universal gas constant, R= (J/mol K) SOE :Solid oxide electrolyzer SOEC :Solid oxide electrolysis cell T :Temperature (K) YSZ :Yttria (Y2O3) stabilized zirconia W :Work rate or power (W) g :Gibbs free energy (J/kmol) m :Mass flow rate (kg/s) s :Entropy (J/kg K) Greek Letters δ :Thickness (m) η :Efficiency; Polarizations (V) ρ :Resistivity (Ω.m) γ :Pre-exponential for electrode exchange current density (A/m^2) ε :Effectiveness Subscripts 0 :Exchange current density; initial A :Anode act :Activation
19 c :Cathode conc :Concentration E :Voltage HE :Heat exchanger i :species L :Limiting current ohm :Ohmic r :Reversible elec :Electric en :Energy ex :Exergy Superscripts eff :Effective References Brisse, A., J. Schefold and M. Zahid (2008). "High temperature water electrolysis in solid oxide cells." international journal of hydrogen energy 33(20): Buttler, A., R. Koltun, R. Wolf and H. Spliethoff (2015). "A detailed techno-economic analysis of heat integration in high temperature electrolysis for efficient hydrogen production." International Journal of Hydrogen Energy 40(1): Dincer I. Green methods for hydrogen production. International Journal of Hydrogen Energy. 2012;37: Ebbesen, S. D., C. Graves and M. Mogensen (2009). "Production of synthetic fuels by co-electrolysis of steam and carbon dioxide." International Journal of Green Energy 6(6): Larminie, J. and A. Dicks (2003). Fuel cell systems explained. Chichester, West Sussex, J. Wiley: xxii, 406 p. Li, X. (2006). Principles of fuel cells. New York, Taylor & Francis. Manage, M., D. Hodgson, N. Milligan, S. Simons and D. Brett (2011). "A techno-economic appraisal of hydrogen generation and the case for solid oxide electrolyser cells." international journal of hydrogen energy 36(10): Ni, M., M. K. H. Leung and D. Y. C. Leung (2007). "Energy and exergy analysis of hydrogen production by solid oxide steam electrolyzer plant." International Journal of Hydrogen Energy 32(18): Ni, M., M. K. Leung and D. Y. Leung (2006). "A modeling study on concentration overpotentials of a reversible solid oxide fuel cell." Journal of Power Sources 163(1): Ni, M., M. K. Leung and D. Y. Leung (2008). "Technological development of hydrogen production by solid oxide electrolyzer cell (SOEC)." International Journal of Hydrogen Energy 33(9):
20 Energy and Exergy Analyses of a Solar Based Hydrogen Production and Compression System Hasan Ozcan 1*, Ibrahim Dincer 2 1 Karabuk University, Engineering Faculty, Mechanical Engineering Department, Baliklar Kayasi Mevkii Demir Celik Kampusu, Karabuk, 78050, Turkey 2 University of Ontario Institute of Technology, Faculty of Engineering and Applied Science, Mechanical Engineering Department, 2000 Simcoe St N, Oshawa, L1H7K4, Canada * [email protected] Abstract In this study, a solar heat based integrated system with a supercritical-co2 (sco2) gas turbine cycle, a four-step Mg-Cl cycle and a 5-stage hydrogen compression plant is proposed and analyzed thermodynamically. The solar data for the considered solar plant are taken for Toronto by using both daily and annual data. A molten salt storage is considered for the system in order to work without interruption when the sun is out. The power and heat from the solar and sco2 subsystems are provided to run the Mg-Cl cycle to produce hydrogen at four consecutive steps. After the internal heat recovery is accomplished, the heating process at required temperature level is supplied by the heat exchanger of the solar plant. The produced hydrogen from the Mg-Cl cycle is compressed up to 700 bar by using a five-stage compression with intercooling and required compression power is compensated by the sco2 Brayton cycle. The total energy and exergy input to the integrated system are found to be 1535 MW and 1454 MW, respectively, for a 2 kg/s hydrogen producing plant. Energy and exergy efficiencies of the overall system are calculated as 16.31% and 17.6%, respectively. When the energy and exergy loads of the receiver are taken into account as the main inputs, energy and exergy efficiencies become 25.1%, and 39.8%, respectively. Total exergy destruction within the system is found to be 1265 MW where the solar field contains almost 64% of the total irreversibility with a value of ~811 MW. Keywords: Mg-Cl cycle, solar power tower, supercritical CO2, energy, exergy, hydrogen. I. Introduction Hydrogen is not freely available on the universe, but can be produced by means of fossil fuels, water, biomass, anthropogenic wastes and hydrogen sulphide. Water is one of the most promising resources for hydrogen production, and it can be split into hydrogen and other products by using several technologies. High and low temperature electrolysis, pure and hybrid thermochemical water splitting cycles, photochemical, and radiochemical systems are promising technologies for hydrogen production from water (Veziroglu and Barbir, 1992). Water electrolysis is one of the simplest ways to produce hydrogen from water. It can simply be summarized as conversion of electric power to chemical energy in the form of hydrogen and oxygen as a by-product with two reactions in each electrode; anode and cathode. There is a separator between anode and cathode electrodes which ensures products remain isolated. Electrolysers can be classified in three types, namely: alkaline water electrolysers (AE), proton exchange membrane electrolysers (PEM) and high temperature electrolysers (HTE) (Dincer and Zamfirescu, 2012). Thermochemical splitting of water is an alternative to electrolytic splitting of water by using high temperature heat sources to produce hydrogen thermochemically without using electricity. This method requires very high temperatures for splitting water into hydrogen and oxygen. Therefore, multi-step thermochemical cycles are proposed requiring more than one chemical reaction and sum the high temperature water thermolysis at decreased maximum temperatures. However, most studies show that the minimum achievable temperature is around 800ºC (Naterer et al., 2013). Hybrid thermochemical cycles are promising alternatives to pure thermochemical cycles having low maximum temperature requirements with lower electricity consumption than that of conventional water electrolysis. The selection of any hybrid cycle is based on the limitation of low electrical energy requirement and low maximum temperatures in order to make such cycles feasible options (Yan and Hino, 2011). Two of such hybrid cycles under intensive research are the Cu-Cl cycle and the HyS cycle. The Hybrid Sulfur (HyS) cycle is one of the simplest thermochemical water splitting processes, including only two reactions (Yan and Hino, 2011). This is the well-known ISPRA Mark-11 cycle and under development by Westinghouse. The four-step CuCl hybrid cycle has also been proposed with two options being researched. The first one is the IGT cycle, and the second one is the University of Ontario Institute of Technology (UOIT) s CuCl cycle (Naterer et al., 2013). 465

21 The IGT cycle is denoted as CuCl-A by (Levis et al., 2009). The main difference between these two cycles is the electrolysis step. The CuCl-A option has a continuous step of recovering CuCl from the hydrogen production step to produce Cu at an electrolysis step while the fourth step of the UOIT CuCl cycle is drying of CuCl2 after the electrolysis step to enhance the performance of the hydrolysis step. Both cycles show promising performances and feasible alternatives to conventional water electrolysis. The Mg-Cl cycle has been originally proposed as a three-step option and corresponding performance assessment of this configurations can be found elsewhere (Petri and Yildiz, 2006; Simpson et al., 2006; Ozcan and Dincer, 2014a, 2014b, 2015a), and it can be configured by taking into account the thermochemistry of substances throughout the cycle. Thermodynamic assessment of three configurations of the cycle has been conducted by (Ozcan and Dincer, 2016a) and it is concluded that a four-step cycle can be a more feasible option than the three-step configurations. An experimental study is undertaken to capture HCl in dry form which leads to a modified four-step cycle with lower electrical energy consumption using dry HCl gas for the electrolysis step of the cycle (Ozcan and Dincer, 2015b, 2016b), resulting in ~30% HCl capture in dry form. The modified four-step cycle shows a higher thermodynamic performance than all other configurations and is more competitive with other hybrid cycles and conventional water electrolysis. This study investigates a solar based four-step Mg-Cl cycle with hydrogen compression in detail, by analysing and assessing the performances of all subsystems and the overall system. II. System description A detailed schematic diagram of the studied system is illustrated in Fig. 1 with state points. All subsystems are evaluated by considering following state points: 1-5: Solar plant 6-33: Mg-Cl cycle 34-45: Supercritical CO2 Brayton cycle 46-59: Hydrogen compression plant The solar data for the solar plant are taken for Greater Toronto Area (GTA) by considering daily and annual data. Molten salt storage is considered for the system in order to run the system without source feed interruptions when the sun is out. However, it is possible that the temperature of stored molten salt may not be high enough to run the Mg-Cl cycle. Thus, the analysis of the system is based on a specific month and time of a year, where the grade of the heat is adequate for the cycle. The solar heat from the receiver is transferred to two consecutive heat exchangers to provide enough heat for the Mg-Cl and the sco2 Brayton cycles. CO2 is selected as the working fluid for the Brayton cycle because of its superior properties at the supercritical region. The precooled working fluid is compressed to the high pressure side by a two-stage intercooled compressor system. A regenerator is adapted to the system to recover excess heat of the expanded fluid with a reasonable approach temperature. The high temperature and high pressure working fluid is obtained by the solar heat exchanger and expanded into low pressure side to generate power. Fig 1: Schematic diagram of the proposed system. 466

22 The produced power and heat from the solar subsystem are provided to run the Mg-Cl cycle to produce hydrogen at four consecutive steps. After the internal heat recovery is accomplished, the heating process at required temperature level is supplied by the heat exchanger of the solar plant. The produced hydrogen from the Mg-Cl cycle is compressed up to 700 bar by using a five-stage compression plant with intercooling where the required compression power is compensated by the sco2 Brayton cycle. The compressed hydrogen shows ~38 kg/m 3 density value, which would make the transportation of this product easier and cost effective. III. Analyses and assessment The system consists of four main subsystems. The analyses all subsystems are given in the following subsections. III.1. Solar cycle subsystem There are several factors to determine the optical Efficiency of a heliostat plant. These factors can be listed as follows; the cosine efficiency, shadowing factor, intercept factor, mirror reflectivity and attenuation factor (Al-Suleiman and Atif, 2015). Basic definitions to determine the field characteristics are based on Fig 2. The characteristic diameter is explained as follows (Collado, 2009): DH = 1 + wr 2 LH (1) Here, DH is heliostat diagonal, and the characteristic diameter, DM, is then defined as DM = DH + d sep (2) where wr is width/height ratio, LH is heliostat height, and dsep is security distance. The radial distance in between heliostat rows are: ΔR min = DMcos30ᵒ (3) and the azimuthal increment as Δαz 1 = 2 sin 1 ( DM 2R 1 ) DM R 1 (4) Here, R1 is taken to be the radius of first ring of the field. Increased ring numbers bring a higher distance between heliostats, which requires another definition for azimuthal increment for newer zones on the field: Δαz i = Δαz i 1 2 (5) The number of heliostats can now be calculated with the following definition for odd and even rows, respectively: N hel,o = 2(Ψ max Δαz N hel,e = 2Ψ max Δαz Δαz 2 ) + 1 (6) + 1 (7) where Ψ max stands for distance between last heliostat and north axis. The net optical efficiency of the field can now be explained as follows: η opt = ρ cos w f at f sb f itc (8) where subscripts at, sb, and itc stand for attenuation factor, shading and blocking factor, and intercept factor, respectively. Here, all parameters except for the attenuation factor are dependent on the co-ordinates and time, where the attenuation factor is dependent from time. The law of specular reflection is used to determine the cosine factor as follows: cos w = d sun d n (9) where d sun is unitary sun vector and d n is unit normal to heliostat surface. The attenuation factor is: f at = S rec S rec if S rec 1000m (10) and f at = e ( S rec) if S rec 1000m (11) S rec stands for slant distance from receiver to heliostat. Shading and blocking factor, as well as the intercept factor can be found elsewhere (Collado, 2009). In addition to optical losses, radiation and convective heat transfer losses should also be included to determine thermal efficiency of the receiver. Radiation losses are determined by the following equation Q rad = F view AεσT R 4 (12) where σ is Stefan-Boltzmann constant, A is receiver area, ε is emissivity factor of the receiver and F is shape factor. Here T r stands for the receiver temperature. Convection losses and the corresponding convective heat transfer coefficient are defined as follows: Fig. 2: Radial and azimuthal spacing of heliostat field (Modified from Atif and Al-Suleiman, 2014) 467 Q c = Ah c (T R T 0 ) (13)
23 h c = ( T R T 0 H t ) 0.25 (14) Here H t is the solar tower height. Finally, thermal efficiency of the receiver can be calculated with the flowing definition: η th = αη optia h (Q rad Q c ) η opt IA h (15) where α is absorptivity, I is solar radiation, Ah is heliostat area. Total heat input to the field is also calculated by multiplying heliostat area, solar radiation and optical efficiency. Tab. 1: Assumptions and data for the heliostat field analyses (Modified from Suleiman and Atif, 2015) Variable Symbol Unit Range Turbine inlet TIT K temperature Approach ΔT app K Temperature Pressure ratio Pr Compressor η c efficiency Turbine efficiency η gt Cooling water temperature Tc K 300 The thermal efficiency of the field is the same as the energy efficiency. The exergy efficiency of the central receiver system can be calculated with a simple multiplication of thermal exergy values of received heat to total heat input as follows: η ex = Q rec(1 T 0 /T sun ) Q in (1 T 0 /T sun ) (16) where Tsun is the sun temperature and taken to be ~ 5700 K, and Q rec is the receiver heat, which is the remaining heat after radiative and convective losses. This model is performed using the EES software to validate the results taken from SAM software by using the solar data for Toronto, ON. The assumptions and solar data for the solar field are given in Table 1. III.2. CO2 Gas turbine subsystem The CO2 gas turbine is modeled with recuperation and intercooling for enhanced cycle performance. The main output from the cycle is the turbine power in which the general energy and exergy efficiency definitions can be made simply by an output-input relation. Considering the state point information in Fig 1, one can form efficiency definitions as follows: η en = W net m CO2η hex (h 34 h 41 ) (17) information. Here, subscripts t, is, and hex stand for turbine, isentropic, and heat exchanger, respectively. These efficiency values are assumed to be 90% for turbine and isentropic efficiencies, and 85% for the heat exchanger effectiveness. The net power output is calculated by subtracting the compression work of the supercritical fluid as follows: W net = W t W c1 W c2 (19) One of the main issues with modeling the cycle is to determine the temperature gradient through the recuperator. For this purpose, a balance equation for this component is written as follows: h 41 h 40 = h 35 h 36 (20) which provides a reasonable enthalpy value for the exiting stream from recuperator by assuming an approach temperature (10K). This parameter is an important influence on the cycle performance and considered as a variable during the analysis. Necessary assumptions are provided in Table 2. Tab.2: Input data and assumptions for the CO2 Gas Turbine cycle. Variable Symbol Unit Value Latitude (Toronto) φ ºN Heliostat height LH m 12.2 Heliostat height LW m 12.2 Tower optical THT M height Total Number of heliostats Receiver diameter DR m Receiver size LR m Emissivity ε Absorptivity α Reflectivity ρ Solar irradiation I W/m2 850 Std. Dev. of sun shape error α sun mrad 2.51 Std. Dev. of α tr mrad 1.53 tracking error Std. Dev. of α sl mrad 2 surface error The mass, energy, entropy and exergy balances of the cycle components are presented in Table 3. The corresponding equations are adapted in the EES software to determine quantity and locations of irreversibilities throughout the cycle (Klein, 2008). III.3. Hydrogen compression subsystem Since the produced hydrogen from the Mg-Cl cycle is assumed to be a real gas, compressibility factor of the hydrogen should be taken into account. (Ozsaban et al., 2012). For a given thermodynamic condition, the specific heat ratio is calculated as η ex = W net E x 2 E x 4 (18) The denominator in the energy efficiency definition is equal to the net power rate from the turbine, however, detailed information is given for a suitable definition of the power output in connection with the state point 468 k = C p C v (21) where Cp and Cv are specific heats at constant pressure and constant volume, respectively. The polytropic exponent is then calculated based on an assumed polytropic efficiency (90%) as follows:
24 Tab. 3: Balance equations for the CO2 gas turbine system. Component Balance Equations GT-Hex m 2 = m 4; m 41+m 34 E 41 + E 2 = E 4+E 34 S 41 + S 2 + S gen = S 34 +S 4 Ex 41 + Ex 2 = Ex 34+Ex 4 + E x dest Turbine m 34 = m 35 E 34 = E 35+W t S 34 + S gen = S 35 Ex 34 = Ex 35+W t + Ex dest Compressor I m 37 = m 38 E 37+W c1 = E 38 S 37 + S gen = S 38 Ex 37+W c1 = Ex 38 + E x dest Compressor II m 39 = m 40 E 39+W c2 = E 40 S 39 + S gen = S 40 Ex 39+W c2 = Ex 40 + E x dest Recuperator m 40 = m 41; m 35 = m 36 E 40 + E 35 = E 41+E 36 S 40 + S 35 + S gen = S 41 +S 36 Ex 40 + Ex 35 = Ex 41+Ex 36 + E x dest Intercooler m 38 = m 39; m 44 = m 45 n n 1 = k E 38 + E 44 = E 39+E 45 S 44 + S 38 + S gen = S 45 +S 39 Ex 44 + Ex 38 = Ex 45+Ex 39 + E x dest k 1 η p (22) The pressure ratio for each compression stage is simply the ratio of the high and low pressure side of the individual compressor in connection with the stage number (y) as follows: r p = ( P e 1 y ) P i (23) The compressor outlet temperature is related to polytropic exponent and pressure ratio: T e = r p n 1 n T i (24) Since an intercooling process is adapted after every compression stage, the inlet temperature of any compressor is assumed to be at ambient conditions. The compressibility factor can be defined by thermopysical properties of hydrogen at the corresponding condition with the following definition: compressibility factor at inlet and outlet conditions of any compressor. Actual work requirement of all compressors can be defined by one equation (Brown, 1997): W act = y n 1 m h2znr n h2t0(r p 1) i=1 n 1 ηp (27) It is now possible to define energy and exergy efficiencies by considering main inputs and outputs to/from the subsystem: η en = E H2 W act η ex = E x H2 W act (28) (29) The range of variations for the assumed data of the hydrogen compression subsystem is presented in Table 4. Finally, the overall efficiency assessment of the system is calculated by considering compressed hydrogen from compression subsystem, and oxygen from the Mg-Cl cycle: η en,si = E h2,c+e o2 η opt IA h (30) η ex,si = E x h2,l +E x o2 E x Q solar (31) Tab. 4: Input data for the hydrogen compression subsystem. Variable Symbol Unit Range Compressed H2 kg 2 hydrogen Hydrogen P in bar inlet pressure Hydrogen P out bar compression pressure Compression y stage Pressure ratio r p III.4 Mg-Cl cycle subsystem The heat transfer for a chemical process is basically the difference between enthalpies of products and reactants of a reaction and is determined with the following expression: ρ = 100P ZRT (25) where ρ is density of hydrogen, and R is the universal gas constant. The compressibility factor for a specific state is defined as Z = 1 + ( ) ρ RT RT + ( RT ) α RT ρ ρ2 RT (1 + λρ 2 )e ( λρ2 ) (26) Here, the values α and λ can be found elsewhere (Ozsaban et al., 2012). The average compressibility factor can be calculated by calculating the 469 Q = H P H R = n p (h f + h + h ) p n R (h f + h + h ) R (32) where n refers to molar amount, and corresponding h values are molar enthalpy of formation, molar enthalpy of state, and reference enthalpy, respectively. Enthalpy of formation and reference enthalpy values can be found in thermochemical tables of various databases, where enthalpy of state is calculated based on temperature of the reaction with various empirical correlations. Supposing that the reactants of the reaction under study are A, and B, and products are denoted as C, and D; the specific heat of the reaction is expressed as follows (Kelley, 1945):
25 Cp i = a i + b i T + c i T 2 (33) where a, b and c are empirically calculated constants. The specific heat for the individual reaction depends on the specific heats of the individual components of the reaction, and defined as follows: Cp = Cp c + Cp d Cp a Cp b = a + bt + ct 2 (34) The empirically developed constants are determined by finding the difference of the products and reactants in a general form. The corresponding reaction heat can be calculated in terms of temperature with the standard heat of the reaction as follows: H = CpdT = H 0 + at + b 2 T2 c T (35) A simulation of the four-step cycle is performed using the Aspen plus simulations, and a comparative assessment has been conducted with the definitions made above. IV. Results and discussion The hydrogen compression subsystem utilizes the produced hydrogen with several steps of compression where it needs electrical energy to drive the compressors. Thus, the first assessment is conducted for the hydrogen compression plant followed by the gas turbine and solar subsystems. IV.1. Mg-Cl cycle subsystem Three flow-sheet options with their thermodynamic results are presented in Section 6.1. The final design is similar to that of four-step Mg-Cl cycle where an additional HCl capturing process integration is made. The HCl capture process is one of the most crucial reactions throughout the cycle for decreased electrical work requirement. For the HCl capturing process, experimental results are adapted in connection with recycling of the solid particles with dehydration and decomposition of the products. Tab. 5: Energy balance calculations of the four-step Mg-Cl cycle with HCl capture. Component Process T ΔH W (ºC) (MJ/kmol (MW) H2) Hydrolysis MgCl hydrolysis Decomposition MgOHCl decomposition Chlorination MgO chlorination HCl Separation* Recycling of 280, MgO 350, 450 Electrolysis (aq) Aqueous HCl electrolysis Electrolysis (dry) Anhydrous HCl electrolysis HEX-1 Steam superheating HEX-2 MgOHCl heating HEX-3 HCl(aq) cooling HEX-4 HCl(dry) cooling HEX-5 Hydrogen cooling HEX-6 Hydrogen cooling HEX-7 Chlorine heating HEX-8 Oxygen cooling HEX-9 MgCl2 cooling Auxiliary Water pumping, inert gas compression Total heat** Total work * Details of the energy balance of this process is provided in Table 6. ** The total heat is calculated based on 85% of heat exchanger effectiveness, and exothermic reactions are not included in the calculation. The energy requirement of the HCl capture process is also presented in Table 6. HCl capturing reaction is at the hydrolysis outlet temperature and shows relatively high exothermic behaviour. Dehydration and decomposition reactions are endothermic and it is possible to utilize the exothermic reaction heat for individual endothermic reactions, as well as heat exchangers in the HCl capture unit. Assuming the same heat exchanger effectiveness value (85%), the total heat requirement for the HCl capture process results in MW for 1 kmol/s MgO feed. A thermodynamic analysis of the four-step Mg-Cl cycle with HCl capture is conducted for 1 kmole/s hydrogen producing plant. Table 5 summarizes the endothermic and the exothermic reactions, as well as heat exchanger loads. The practical voltage requirement of the aqueous and anhydrous HCl electrolysis is taken to be 1.8 V, and 1.4 V, respectively. The highest heat requiring component is the Hex-1, where phase change and superheating of large amounts of water (11 kmole/s) are required. However, the Hex-3 recovers most of this heat with its high heat load. The total heat requirement for the overall cycle with a more practical approach is around MW, which is higher than previously evaluated values for stoichiometry. For 30.8% HCl capture as seen in the experiments, electrical energy requirement is MW. This is almost 14.5% lower than direct aqueous HCl electrolysis, and 6.7% lower than water electrolysis (considering 1.65 V). 470 Tab. 6: Energy balance calculations of the HCl capturing process. Component Process T (ºC) ΔH (MJ/kmol H2) Capture MgO hydration and hydrochlorination Dehydration Mg(OH)2 dehydration Decomposition MgOHCl decomposition HEX-1 Heating at dehydration temperature HEX-2 Heating at decomposition temperature HEX-3 Cooling to HCl capture temperature Total* * Total heat is calculated based on 85% of heat exchanger effectiveness. Total conversion of MgO is based on experimental results. A total assessment of the cycle can be made by evaluating total performance of the system. Energy
26 and exergy efficiencies of this cycle correspond to 41.7%, and 50.6%, respectively. The amount of steam required for hydrolysis step is one of the main reasons for the higher heat requirement. At stoichiometric conditions efficiency of the conventional cycle is evaluated as 55.2%. However, it is not appropriate to further assess the three-step cycles due to the aqueous HCl electrolysis. IV.II. Hydrogen compression subsystem x Pressure (kpa) K K 400 K K Stage 5 55 Stage 4 Stage 3 Stage 2 Stage 1 A five-stage hydrogen compression plant is considered to compress hydrogen from ambient conditions to a desired pressure for storage purposes. Density of hydrogen can be increased from 0.08 kg/m3 to kg/m3 by compressing this substance up to 700 bar. A pressure-enthalpy diagram of the compression process is illustrated in Fig 3 with state point information given in the integrated system figure. Intercooling after all compression steps is considered for less power consuming compressors, where the outlet streams of the compressors are cooled down to ambient temperatures. The compression process at a constant pressure ratio (3.7) results in a 150ºC increase in the stream temperature. The state point information of the plant is given in Table 7 for five-stage compression option. Fig 4 illustrates the effect of inlet pressure on the exergy efficiency of the hydrogen compression plant where this parameter carries a dominant influence on the system performance. However, outlet pressure of hydrogen after electrolysis pressure is at ambient conditions and it corresponds to 62%, for a five-stage compression option. This value decreases down to 53% for two-stage compression. The plant shows the potential to be as high as 72% exergy efficient at higher compression stages with higher inlet pressure rates. Considering the energy efficiency of the plant, higher compression stages are not considered favorable with relatively lower performances values. A five-stage plant shows 90.2% energy efficiency where this value is higher at two stage compression. This is due to higher compression power requirement and lower enthalpy change of hydrogen at elevated pressures and ambient temperature. Tab. 7: State point information for the five-stage hydrogen compression plant. State T (K) P (bar) s (kj/kmolk) h (kj/kmol) Ex (MW) Molar enthalpy (kj/kmol) Fig. 3: P-h diagram of the hydrogen compression plant. One should also note that the same pressure ratio is applied to the system regardless of the number of stages. Thus, lower stage options result in a lower pressure for the compressed hydrogen. High amounts of heat release at intercooling stages are efficiency decreasing factors and released heat is not considered to be a useful output from the overall system due to lower temperature energy content. However these values are lower when exergy is defined as a performance indicator and does not affect the exergetic efficiency as much as it does to energetic performance. The effect of hydrogen inlet temperature is also shown in Fig 5, and it has a slight impact on the performance. Here, the pressure is an assumed value and the higher it is, the higher the density of hydrogen. However, this energy intensive process drastically effects the performance of the hydrogen compression plant both in terms of energy and exergy efficiencies. Figs 6 and 7 show the effect of storage pressure on system performances at various compression stages. Higher storage pressure requirements slightly decrease the exergy and energy performances with the same trend. Although increased storage pressure decrease the energy efficiency of the subsystem, higher pressure storage is recommended for the sake of increased energy density of hydrogen to favor transportation costs. Exergy efficiency (-) stages 3 stages 4 stages 0.52 (x 10 2 ) Inlet pressure (kpa) Fig. 4: Effect of hydrogen inlet pressure on the exergy efficiency of the hydrogen compression plant subsystem. 471
27 Fig 5: Effect of hydrogen inlet temperature on the exergy efficiency at various storage pressure values. Exergy efficiency (-) Exergy efficiency (-) Compressor inlet temperature (K) five-stage kpa Storage pressure (kpa) Fig. 6: Effect of storage pressure on system exergy efficiency at various compression stages stages 4 stages 3 stages 2 stages (x 10 2 ) this component consumes around 14% more power than that of compressor at stage 4. The total power consumption of the system is MW to compress 1 kmol/s hydrogen to 700 bar in the five-stage option. Supercritical CO2 GT Cycle Subsystem. The supercritical CO2 gas turbine cycle is a promising alternative to conventional gas turbine cycles with higher performance characteristics at lower maximum temperatures. A recuperative cycle is considered for internal heat recovery within the system. The state point information and the T-s diagram are presented in Table 8 and Fig 9, respectively. Effects of the pressure ratio, the approach temperature, and the turbine inlet temperature are investigated, where these parameters have slight to strong influence on the cycle performance. Tab. 8: State point information for the supercritical CO2 gas turbine system. State T (K) P (bar) s (kj/kgk) h (kj/kg) ex (kj/kg) Ex (MW) Energy efficiency (-) Stages 4 stages 3 Stages Storage pressure (kpa) (x 10 2 ) Fig. 7: Effect of storage pressure on system energy efficiency at various compression stages. Compressor work (kw) Compressor #1 Compressor #2 Compressor #3 Compressor #4 Compressor #5 Pressure Ratio (x 10 2 ) Storage pressure (kpa) Fig. 8: Power consumption of compressors at various storage pressure values. A final representation can be made by comparing power consuming devices (Fig. 8). The first four compressors show similar power consumption values where the pressure is increased up to 190 bar. After this step, compression is applied at the same pressure ratio from 200 bar to around bar with a higher power consuming compressor, where Pressure ratio (-) 472 The low pressure side of the cycle is set to 74 bar which is slightly above the critical pressure of CO2. The high pressure side is not set as constant, but is instead decided by the pressure ratio. The effect of pressure ratio on power producing and consuming devices as well as the mass flow rate of the cycle is illustrated in Fig 10. A slight decrease at both power consuming and producing devices are observed until a pressure ratio of 2, where a linear increase is than observed above 2. The mass flow rate of the cycle shows a significant decrease at higher pressure ratios, resulting in a more compact system. Even if higher pressure ratio seems to be favorable for the system size, the system performance should also be analysed at this range. Temperature (K) kpa Carbondioxide kpa 7400 kpa Specific entropy (kj/kgk) Fig. 9: T-s diagram of the supercritical CO2 gas turbine cycle
28 The effect of pressure ratio on the cycle efficiencies and the back work ratio (BWR) is illustrated in Fig 11. The results show that higher pressure ratio enhances the system performances until 3.05, and a slight decrease is observed above this value. It should also be noted that the work consumption of compressors significantly increases at higher pressure ratios which would contribute to lower system performances. An optimum pressure ratio for both energy and exergy efficiencies is found to be The internal heat recovery is one of the most crucial mechanisms within the GT cycle, where a reasonable assumption is made for the approach temperature. For the base case model, 20K assumption is made, where a parametric study is conducted to observe its influence on the system performance, and illustrated in Fig 12. A 20K difference in the approach temperature decreases the system exergy efficiency by 31.5%, and the energy efficiency by 32.1%. Best performing heat exchangers show low approach temperature values, however, heat exchanger technology for CO2 is not yet a mature technology. Thus, 20K approach temperature is selected for more realistic results. Since the maximum temperature from the solar subsystem can be up to 565ºC, a higher limit for maximum temperature is set as a constraint for the system. This maximum temperature can be higher than the mentioned value, however it should be noted that molten salt is considered for the solar subsystem in order to store energy for night time use. Although it is not as effective as pressure ratio and approach temperature, higher turbine inlet temperature slightly increases both energy and exergy efficiencies within the system as shown in Fig 13. The base case model is based on the maximum temperature of the heat exchanger, for higher performance parameters. Work rate (kw) x W comp1 W comp2 W GT Pressure ratio (-) Fig. 10. Effect of pressure ratio on the power producing and consuming devices and mass flow rate of the cycle. m Mass flow rate (kg/s) Efficiency (-) Pressure ratio (-) Fig. 11: Effect of pressure ratio on the system efficiencies and back work ratio. Efficiency (-) Fig. 12 Effect of minimum temperature difference on the system efficiencies at various pressure ratios. Efficiency (-) Fig 13: Effect of turbine inlet temperature on GT cycle efficiencies. The modeled sco2-gt cycle consumes ~699 MW energy to produce the required power for the electrolysis of HCl in the Mg-Cl cycle and the compression of hydrogen by five-stage compressors. The parametric optimization results show that higher turbine inlet temperature and approach temperature increase system performances at a specific pressure ratio (3.02). The system energy and exergy efficiencies are found to be 46.5% and 60.9%, respectively. Use of supercritical CO2-GT system is superior to conventional air gas turbine systems and shows the potential to perform at high performances at lower maximum temperature ranges. Even if this cycle shows relatively higher performance results, almost 208 MW energy is calculated as a total irreversibility within the cycle. A higher performing cycle with lower irreversibilities can be obtained by higher performing system components and proper selection and optimization of system parameters. hen hex BWR PR=2 PR=3 PR= Minimum temperature difference ( C) hen hex hen hex Turbine inlet temperature (K) Back work ratio (-) 473

29 IV.III. Solar cycle subsystem The solar cycle subsystem is the main energy input for the first integrated system, where it provides high grade thermal energy for the Mg-Cl cycle and the sco2-gt cycle. As mentioned before, total heat requirement for the Mg-Cl cycle is found to be MW and total heat input for the GT cycle is MW. The solar cycle is designed by selecting GTA as the location and average values for Month of July are considered. State point information for the solar subsystem is given in Table 9. Energy load from the receiver is transferred to the Mg-Cl and the sco2-gt cycles heat exchangers by splitting the energy stream. The total mass flow rate of the system is found to be kg/s, where 29.7% of this mass is transferred to supply heat for the Mg-Cl heat exchanger. Tab. 9: State point information for the solar cycle. State T (ºC) P m s h Ex (bar) (kg/s) (kj/kgk) (kj/kg) (MW) Both high and low temperatures for the energy storage option with the molten salt (60% NANO3, 40% KNO3) are 565ºC and 290ºC, and this range is in perfect agreement with both GT and MgCl cycles. The System Advisory Model (SAM) software is utilized to determine daily, monthly, and annual solar energy information for the GTA. Irradiance values and dry bulb temperature for the GTA are shown in Fig 14, and layout of the heliostat field is given in Fig 15. Considering the amount of required heat, one field is not adequate to produce the desired amount of hydrogen (7.2 t/h). Thus, a ratio called Solar Multiple is considered, which means the number of fields to produce required energy for hydrogen production. It is also possible to consider the energy production of one field, and size the hydrogen production cycle. However, existing thermodynamic results already provide a good information on the amount hydrogen production from a given energy source input. Fig. 15: Layout of the heliostat field. A variations of the absorbed thermal energy from the field and receiver efficiency is presented in Figure Average values of the absorbed energy is adequate to run the system with the corresponding Solar Multiple value, and efficiency of the receiver is up to 65% energy efficient. Temperature of the heat transfer fluid (HTF) from the receiver and to HEXs of the subsystems are illustrated in Fig 17 with the storage mode on and off. A possible issue is that the HTF temperature from storage might be too low for the decomposition reaction of the Mg-Cl cycle, jeopardizing the recycling throughout the system. Thus, one of the most crucial factors is to keep the maximum temperature above 450ºC at all times. Another option can be considered as utilizing the heat to produce only power from sco2-gt cycle, when the temperature from the solar field is not favorable for the Mg-Cl cycle. Fig. 16: Variations of average absorbed thermal energy and reciever efficiency for the month of July. Fig 17: Temperature variations of the working fluid at when storage mode is on and off at the month of July. Fig. 14: Annual environmental parameters for GTA. 474 The effect of irradiance, which is also related to time of the day, on the total field efficiency and the thermal


30 energy of the cycle is plotted in Fig 18 using a scatter graph for various measurements in SAM software. Higher irradiance values result in higher system efficiency and higher useful thermal energy at higher temperatures. For the base case mode, irradiance values are taken as the average values from the month of July in GTA and adapted into the integrated system. Considering the required energy for the subsystems, total energy from the field is calculated as 1535 MW where the exergy content corresponds to 1454 MW. The exergy efficiency of the field is calculated as the ratio of receiver exergy to solar exergy of the field, and it is found to be 44.2%. Fig. 18: Energy Efficiency and energy load at various irradiance values. Fig 20: Irreversibility shares of subsystems in system I. V. Conclusions The total energy and exergy content of the energy input to the integrated system are calculated as 1535 MW and 1454 MW, respectively for a 1 kmol/s hydrogen producing system. Energy and exergy efficiencies of the overall system are calculated as 16.31% and 17.6%, respectively. When the energy and exergy loads of the receiver are taken into account as the main inputs, energy and exergy efficiencies become 25.1% and 39.8%, respectively. Total exergy destruction within the system is found to be 1265 MW where the solar field contains almost 64% of the total irreversibility with a value of ~811 MW. The present integrated system is a clean and sustainable solution for clean hydrogen production, with several potentials of improvement at various sub-components for further thermodynamic performance enhancement. Nomenclature Fig. 19: Energy and exergy efficiency comparison of the subsystems. A thermodynamic assessment of the overall system can now be comparatively evaluated using the obtained information from the subsystems. Energy and exergy efficiency comparisons of the system are illustrated in Fig 19, and irreversibility ratios are illustrated in Fig 20. The unique product of the integrated system is hydrogen at 700 bar, where its energy and exergy contents are calculated as MW and MW, respectively. A Area (m 2 ) Cp Specific heat (kj/kmolk) E Energy rate (kw) Ex Exergy rate (kw) F Faraday constant (C/mol) h Specific enthalpy (kj/kg) h Specific enthalpy (kj/kmol) m Mass flow rate (kg/s) Q Heat rate (kw) s Specific entropy (kj/kmolk) S Entropy rate (kw/k) T Temperature ( C, K) W Work rate (kw) Greek Symbols η Efficiency α Absorptivity ε Emissivity Subscripts and Superscripts 0 Ambient 0 Reference state 475
31 cap Capture ch Chemical chl Chlorination comp Compressor d, dest Destruction dec Decomposition e Exit elec Electrolyzer en Energy ex Exergy g Gaseous gen Generation hex Heat exchanger hyd Hydrolysis i in rec s sep sys i th Inlet Receiver Solid Separation System decomposition of magnesium chloride (Vol. 676). US Government. Printing Office. Klein, S.A., Nellis, G. (2011) Thermodynamics. Cambridge University Press, Cambridge, UK. Lewis M. A., Masin J. G., O Hare P. A. Evaluation of alternative thermochemical cycles. Part I: The methodology. International Journal of Hydrogen Energy 2009, 34: Naterer G.F, Dincer I., Zamfirescu C. Hydrogen Production from Nuclear Energy. London: Springer; Ozcan H, Dincer I. Comparative performance assessment of three configurations of magnesium chlorine cycle. International Journal of Hydrogen Energy 2016, 41: Ozcan H, Dincer I. Energy and exergy analyses of a solar driven Mg Cl hybrid thermochemical cycle for co-production of power and hydrogen, International Journal of Hydrogen Energy 2014, 39: Ozcan H, Dincer I. Modeling of a New Four-Step Magnesium-Chlorine Cycle with Dry HCl Capture for More Efficient Hydrogen Production. International Journal of Hydrogen Energy 2016, in press. Acronyms ANL Cu-Cl GTA LHV Mg-Cl References Argonne National Laboratory Copper-Chlorine Greater Toronto Area Lower Heating Value Magnesium-Chlorine Ozcan H, Dincer I. Performance investigation of magnesium chloride hybrid thermochemical cycle for hydrogen production, International Journal of Hydrogen Energy 2014, 39: Ozcan H. Dincer I. Thermodynamic and environmental impact assessment of steam methane reforming and magnesium chlorine cycle based multigeneration systems. International Journal of Energy Research 2015, 39: Al-Sulaiman, F. A., Atif, M. (2015). Performance comparison of different supercritical carbon dioxide Brayton cycles integrated with a solar power tower. Energy, 82, Ozcan H. Experimental and theoretical investigations of magnesium-chlorine cycle and its integrated systems. PhD dissertation, University of Ontario Institute of Technology Brown, R. N. (1997). Compressors: Selection and sizing. Gulf Professional Publishing. Collado, F. J. (2009). Preliminary design of surrounding heliostat fields. Renewable Energy, 34(5), Dincer I., Zamfirescu C. Sustainable hydrogen production options and role of AIHE. International Journal of Hydrogen Energy 2012, 37: Eames, D. J., Newman, J. (1995). Electrochemical Conversion of Anhydrous HCl to Cl2 Using a Solid Polymer Electrolyte Electrolysis Cell. Journal of the Electrochemical Society, 142(11), Kelley, K. K. (1945). Energy requirements and equilibria in the dehydration, hydrolysis, and 476 Ozsaban, M., Midilli, A., Dincer, I. (2011). Exergy analysis of a high pressure multistage hydrogen gas storage system. International Journal of Hydrogen Energy, 36(17), Petri MC, Yildiz B, Klickman AE. US work on technical and economic aspects of electrolytic, thermochemical, and hybrid processes for hydrogen production at temperatures below 550 C. International Journal of Nuclear Hydrogen Production and Applications 2006, 1(1): Simpson MF, Hermann SD, Boyle BD. A hybrid thermochemical electrolytic process for hydrogen production based on the reverse Deacon reaction. International Journal of Hydrogen Energy 2006, 31:
32 Veziroglu T.N., Barbir F. Hydrogen: the wonder fuel. International Journal of Hydrogen Energy 1992, 17: Yan XL., Hino R. Nuclear hydrogen production handbook, CRC Press, Boca Raton FL, 50-54;
33 Energy and Exergy Analysis of a Novel Combined System Producing Power, Water and Hydrogen Kiyan Parham 1,2, Hamed Alimoradiyan 3, Mohsen Assadi 4* 1 Mechanical Engineering Department, Faculty of Engineering, Roma Tre University, Via della Vasca Navale, 79, Rome, Italy 2 Department of Architecture, Alanya HEP University, TR Alanya, Turkey 3 Department of Mechanical Engineering, Eastern Mediterranean University, G. Magosa, TRNC, Mersin 10, Turkey 4* Dept. of Petroleum Enginnering, Faculty of Science and Technology, University of Stavanger, 4036 Stavanger, Norway * [email protected] Abstract Using absorption heat transformer for boosting low grade heat sources has been utilized for some time. In this paper a novel multi-generation system including an open absorption heat transformer (OAHT), an organic Rankine cycle with Internal Heat Exchanger (ORC-IHE) and an electrolyzer for hydrogen produdtion is proposed and analyzed from both energetic and exergetic point of view. To assess the cycle s performance, thermodynamic models were developed and a parametric study was carried out. The results indicate that the net power output and the hydrogen production rate will increase by boosting the inlet temperature of the waste heat using OAHT. Keywords: Open absorption heat transformer, organic Rankine cycle with Internal Heat Exchanger, electrolyzer, energy, exergy. I. Introduction During recent past, great interest has been focued on utilization of mid/low level temperature heat sources from e.g. industries, solar radiation and geothermal heat source (Ma et al.). In fact, these heat osurces represent a considerable amount of energy by the capability of being recycled in secondary heat recovery technologies such as organic Rankine cycles (ORCs) (Vélez et al., 2012) Kalina cycle (Zhang et al., 2012), absorption refrigeration systems (Li et al., 2014; Zhai et al., 2011), and heating implements (Fang et al., 2013). The second type refrigeration cycles, also called absorption heat transformers (AHTs), stand as the superlative relevant applicants of getting benefit of mid/low level heat sources (Parham et al., 2013b). Operating as reversed absorption heat pumps (AHPs), AHTs have the capability of boosting the low grade heat to higher temperature levels and thereby improve their usefulness by a negligible input of electric power (Parham et al., 2014). The first category of AHTs, known as single stage absorption heat transformers (SAHT), capable of recovering about half of the input waste heat can supply the demanded energy of the succeeding industrial processes (Donnellan et al., 2015). The temperature level of the upgraded heat from the AHTs depends on the number of stages (Khamooshi et al., 2014). A single stage absorption heat transformer can reach coefficient of performance (COP) of about 0.5 and a gross temperature lift (GTL) of 50 C (Yari, 2012). The GTL of 80 C and COP adjacent to 0.35 is accessible by applying double stage (Akbari and Mahmoudi, 2014) and for triple stage systems the GTL increases to 140 C while possess COP is about 0.2 (Horuz and Kurt, 2010). Solutions of LiBr H2O and NH3-H2O are the most commonly utilized pairs in absorption cycles (Parham et al., 2013a). Neglecting the crystallization problem of LiBr H2O systems, they have better performance in comparison to NH3-H2O solutions (Rivera et al., 2002). The low-grade heat rejected by various industrial plants can be a proper heat source for the AHT applications (Horuz and Kurt, 2010). These systems have the capability of boosting low temperature waste heat to higher temperatures that can be employed in a secondary process (Parham et al., 2013b). This outstanding characteristic of AHT sorts them a worthy candidate to be used in desalination applications. The arrangement of AHTs coupled to desalination systems have been studied extensively by researchers over the past few years (Horuz and Kurt, 2010; Khamooshi et al., 2016). Recently researches have proposed a new water purification system, which comprises a single- or multi-effect distiller coupled with an open absorption heat transformer (OAHT) (Hamidi et al., 2015; Zhang et al., 2014). It is proven that OAHTs can attain higher coefficient of performance (COP) than those of AHTs, leading to production of higher amount of distilled water (Hamidi et al., 2015). OAHTs can also be connected to Organic Rankine Cycles. Having promising features such as simple configuration, utilizing available components and better economic characteristics, ORCs can be integrated with OAHTs as the secondary cycle. The integrated system can produce power at low temperatures, and the total installed power can be scaled down to kw levels 478
34 (Quoilin et al., 2013). Recently Zare (Zare, 2015) presented results of an investigation, where the performance of three different configurations of ORCs were studied from both thermodynamic and economic point of view. It was demonstrated that organic Rankine cycle with Internal Heat Exchanger (ORC-IHE) had the best performance concerning the first and second laws of thermodynamic. The superiority of ORC-IHE over the other configurations, from the thermodynamic point of view, is also reported by Yari in a comprehensive thermodynamic analysis (Quoilin et al., 2013). The power produced by ORC-IHE can be used to produce hydrogen to fuel vehicles. It is known that hydrogen has great capability to be used as an alternative fuel for transport sector due to its environmental friendly nature. Research studies carried out by several research groups have demonstrated that hydrogen can play a key role in the future sustainable development (Asghari et al., 2010; Hamada et al., 2011; Midilli and Dincer, 2009). The present study focuses on energy and exergy analyses of a integrated cycle (IC) consisting of an OAHT, an ORC-IHE and an electrolyzer to supply power, distilled water and hydrogen. A parametric study was carried out in order to analyze the effects of the main variables such as waste water inlet temperature, turbine inlet temperature and pressure, gross temperature lift and generation temperature on the cycle performance and the quantity of produced Hydrogen. The whole cycle is thermodynamically simulated using Engineering Equation Solver (EES) (Klein and F, 2012) software. evaporator, turbine, condenser and pump. In S-ORC the organic working fluid passing through the evaporator absorbs thermal energy from the heat source. The working fluid is then expanded in the turbine to produce power and after that it is cooled down and condensed in the condenser before being pumped back to the evaporator. In contrast to the conventional steam power plants, for most organic fluids the expansion in the turbine ends up in vapor phase above the condenser temperature instead of the two-phase region. Therefore, for performance improvement of the S-ORC, an Internal Heat Exchanger (IHE) can be employed to recover part of the energy content of the turbine outlet stream. This configuration is referred to as ORC with IHE, as illustrated in Fig. 1. Properties of the working fluid play an important role on the ORC performance (Zare, 2015). In the present work, Isobutane was selected as the working fluid considering the temperature of the heat source and the fluid properties. Half of the power produced by ORC-IHE is transfered to the electrolyzer where water is converted to hydrogen and oxygen. The produced hydrogen can be stored later use as per consumer need, and the oxygen can be used e.g. for performance improvement of digenstion based biogas generator. II. System description The integrated system consisting of an OAHT, an ORC, and electrolyzer for hydrogen production is shown in Fig 1. The simple AHT system consists of a generator, an absorber, a condenser, an evaporator, two pumps, an expansion valve and a heat exchanger. In this system heat is transferred to the working fluid (LiBr/H2O) in the evaporator and generator from any low temperature heat source available. The system rejects heat from the absorber and condenser. The transformed heat from the absorber can be utilized to provide the required energy for distillation systems. In OAHT configuration, the impure water is heated in the absorber where it is partially evaporated. The two phase flow is directed to a separator vessel where it is separated into liquid and vapor. The liquid part can be pumped directly to the absorber or passed through a heat exchanger before it enters the absorber in closed AHT configurations. The main difference between this configuration and other common AHTs is that the condensed water from the condenser (stream 23, Fig. 1) is extracted as distilled pure water instead of being pumped into the evaporator for further vaporization. Next to OAHT, organic Rankine cycle with Internal Heat Exchanger utilizes the heat of absorber as the secondary cycle. The Simple organic Rankine cycle (S-ORC) consists of four major components; 479 Fig. 1: Schematic diagram of the integrated system. III. Thermodynamic model The pre-described systems are simulated by thermodynamic models developed, using the Engineering Equation Solver software. Each system component is treated as a control volume for which the principles of mass conservationand the first and the second laws of thermodynamic are applied. III.1. First law analyses The mass balance can be expressed as: m in m out = 0 (1) Here m is the mass flow rate of the fluid flow. The steady-flow energy equation (SFEE) for each component is stated as: (m h) in (m h) out + Q cv W cv = 0 (2)
35 Here Q cv and W cv are the heat and power interactions of the CV with the surroundings. Based on the thermal energy input to the integrated cycle, the thermal or first law efficiency may be expressed as follows: ɳ I = W net Q gen (3) where W net = W turb W pump (4) III.2. Second law For evaluatoin of the systems performance, use of second law of thermodynamic has been emphesised due to its suitability for assessment of the selected system. Considering the fact that the chemical exergy is canceled out in the exergy balance equations and ignoring the kinetic and potential exergies, the total exergy of a fluid stream can be written as: E = m [(h h o ) T o (s s o ) (5) Considering the transferred exergy from waste heat to the OAHT generator as the input exergy of the cycle, the exergy or second law efficiency of the integrated cycle can be expressed as: ɳ II = W net E in (6) Applying the exergy balance equation on each system component, the exergy destruction rate within the component can be calculated by: E D,k = E in,k E out,k (7) III.3. Performance evaluation In AHTs, COP indicates the ability to upgrade the supplied heat to the generator and the evaporator of the system. Therefore, the COP is defined as follows: COP = Q abs Q gen+q eva (8) f = m s m r (10) where m is the mass flow rate in kg/s and the suffixes s and r denote strong solution and the refrigerant respectively. The other important parameter in desalination systems is the performance ratio (PR), which is the ratio of the produced distilled water to the motive steam consumed by the generator: PR = the amount of distilled water the amount of motive stream = D Q gen rgen (11) where D is the distilled water flow rate and rgen is vaporization latent heat of water at the generator temperature. Gross temperature lift is the ability of AHT to increase the temperature of the available heat source to more useful level. The temperature lift for OAHT is defined as (Hamidi et al., 2015): T = T abs T gen (12) IV. Results and discussion The effect of Tgen on the COP of OAHT and the performance ratio have been plotted in Fig. 2. The COP decreases exponentially as the Tgen increases. This is in contrast to the results obtained in Ref. (Parham et al., 2013b) wherein Tgen had an adverse effect on the ordinary AHTs incorporated to a desalination system. Unlike the common closed AHTs, in which the COP is approximately 0.5, the COP values of OAHT can reach higher values, which is considered as an advantage for OAHTs. This result is also compatible with the results presented by Zhang et al, and can be explained by the fact that the absorbed latent heat in the evaporator is obtained from the out-coming steam from the separator without employing any external heat supply. As mentioned in (Khamooshi et al., 2016), by increasing the Tgen, the concentration of the strong solution and consequently the flow ratio are increased, which results in a decline in the heat capacity of the absorber and correspondingly performance ratio which is evident in Fig. 2. Where Q is the rate of heat transfer in kw. But in the case of OAHTs, a portion of the heat released from the absorber is used in the evaporator, denoted as Q eva here, rather than utilizing an external heat source. Therefore, COP of such systems is defined as: COP COP PR PR COP = Q abs Q gen (9) The flow ratio (ƒ) is a significant parameter used in the design and optimization of the AHT systems. It is defined as the ratio of the mass flow rates of the strong solution and the refrigerant: T gen ( C) Fig. 2: Effects of T gen on COP and PR of the system.
36 The effect of increased inlet temperature of the heat supply on the net power produced and the hydrogen production rate is displayed in Figure 3. The net power and the hydrogen production rate increases from 76.6 kw to 85.4 kw and gr/s to gr/s respectively when boosting the temperature T7 from 100 C to 130 C. This is due to the fact that increasing the inlet temperature of the waste heat increases the temperature of the absorber, which leads to the elevation of the evaporator s temperature (Hamidi et al., 2015). Enhancing Teva as the heat source of ORC-IHE boosts the net power produced by the organic Rankine cycle (Zare, 2015). Some part of the net power generated by ORC-IHE is supplied to the electrolyzer for hydrogen production. This means that by increasing the net power generated, higher amount of power can be supplied to the electrolyzer, leading to higher rate of hydrogen production (Ratlamwala and Dincer, 2013) hen Fig 4: Effect of waste water inlet temperature on CC thermal and exergy efficiencies. hen hen hex T 7 ( C) hen hex hex hex W net (kw) w dotturbine m doth m H2 (kg/s) T gen ( C) Fig 5: Effect of generation temperature on CC thermal and exergy efficiencies T 7 ( C) Fig 3: Effect of waste water inlet temperature on net power generation and rate of hydrogen production. Figure 4 displays the thermal and exergy efficiencies of the integrated system as a function of the inlet temperature of the waste heat. It is observed that as T7 increases, both thermal and exergy efficiency increases. Referring to Figure 3, it is apparent that W_net increases by boosting T7 which has direct impact on thermal and exergy efficiency according to equations 3 and 6. Considering the fact that the only power generation element in the integrated cycle is the turbine of ORC-IHE, it is reasonable to have an operational effect on the efficiencies. A similar trend is reported by El-Emam and Dincer (El-Emam and Dincer, 2013). Figure 5 examines the first and second law efficiency trends against generation temperature, within a temperature range of C. As is seen, both the efficiencies decrease by increasing generation temperature. This is due to the fact that when the generator temperature increases, concentration of the strong solution will increase by enhancement of flow ratio. Higher flow ratio results in lower absorption heat capacity which in turn results in lower thermal and exergy efficiency. 481 The effects of turbine inlet temperature on the net power output and rate of hydrogen production are presented in Figure 6. Figure 6 shows that net power generated increases with turbine inlet temperature. This is because of increased enthalpy at point 17 as consequence of higher turbine inlet temperature and according to the equation W tur = m 17(h 17 h 18 ), the generated power by the turbine and consequently the net power produced enhances. Increased net power output will also boost the rate of hydrogen production and once more the explanations of Figure 3 can be employed herein. W net (kw) W net m H T 17 ( C) Fig 6: Effect of turbine inlet temperature on net power generation and rate of hydrogen production. The effect of gross temperature lift (ΔT = Tabs Tgen) on the net power produced and the rate of hydrogen production are investigated in Fig. 7. It is clear that as ΔT is increases from 0 C to 40 C, net m H2 (kg/s)
37 power generation and rate of hydrogen production decrease by 10.8% and 12.1%. W net (kw) W net m H mdoth2 Engineering 59, Fang, H., Xia, J., Zhu, K., Su, Y., Jiang, Y., Industrial waste heat utilization for low temperature district heating. Energy policy 62, Hamada, Y., Takeda, K., Goto, R., Kubota, H., Hybrid utilization of renewable energy and fuel cells for residential energy systems. Energy and Buildings 43, Fig 7: Effect of gross temperature lift on net power generation and rate of hydrogen production. V. Conclusion An analysis of a novel multi-generation system including an open absorption heat transformer (OAHT), an organic Rankine cycle with Internal Heat Exchanger (ORC-IHE) and an electrolyzer was presented in this study. A thermodynamic model was developed by applying the energy and exergy analyses for each system component. Based on the analyses and results presented in the paper, following conclusions are made: By increasing Tgen, COP of the OAHT decreases, which is in contradiction to the results obtained in ordinary AHTs incorporated with a desalination system. The net power output and the hydrogen production rate increase by boosting the inlet temperature of the waste heat. Both thermal and exergy efficieny of the integrated system will increase when the inlet temperature of the waste heat increases. Generation temperature has an opposite impact on the thermal and exergy efficieny. References DT ( C) Akbari, A.D., Mahmoudi, S.M., Thermoeconomic analysis & optimization of the combined supercritical CO 2 (carbon dioxide) recompression Brayton/organic Rankine cycle. Energy 78, Asghari, S., Mokmeli, A., Samavati, M., Study of PEM fuel cell performance by electrochemical impedance spectroscopy. International Journal of Hydrogen Energy 35, Donnellan, P., Cronin, K., Byrne, E., Recycling waste heat energy using vapour absorption heat transformers: A review. Renewable and Sustainable Energy Reviews 42, El-Emam, R.S., Dincer, I., Exergy and exergoeconomic analyses and optimization of geothermal organic Rankine cycle. Applied Thermal 482 Hamidi, A., Parham, K., Atikol, U., Shahbaz, A.H., A parametric performance analysis of single and multi-effect distillation systems integrated with open-cycle absorption heat transformers. Desalination 371, Horuz, I., Kurt, B., Absorption heat transformers and an industrial application. Renewable Energy 35, Khamooshi, M., Parham, K., Egelioglu, F., Yari, M., Salati, H., Simulation and optimization of novel configurations of triple absorption heat transformers integrated to a water desalination system. Desalination 348, Khamooshi, M., Parham, K., Roozbeh, I., Ensafisoroor, H., Applications of innovative configurations of double absorption heat transformers in water purification technology. Desalination and Water Treatment 57, Klein, S.A., F, A., Engineering Equation Solver, F-Chart Software. Middelton. Li, T., Yu, H., Li, Y.-Y., Liu, Q., Chen, C., Guo, L., Zhu, Y.-M., Study on washwater effluent quality discharged by ship exhaust gas DeSO x system with magnesium and seawater desulphurisation method. International Journal of Environment and Pollution 56, Ma, Z., Bao, H., Roskilly, A.P., Performance analysis of ultralow grade waste heat upgrade using absorption heat transformer. Applied Thermal Engineering. Midilli, A., Dincer, I., Development of some exergetic parameters for PEM fuel cells for measuring environmental impact and sustainability. International Journal of Hydrogen Energy 34, Parham, K., Atikol, U., Yari, M., Agboola, O.P., 2013a. Evaluation and optimization of single stage absorption chiller using (LiCl + H2O) as the working pair. Advances in Mechanical Engineering Parham, K., Khamooshi, M., Tematio, D.B.K., Yari, M., Atikol, U., Absorption heat transformers - A comprehensive review. Renewable and Sustainable Energy Reviews 34,
38 Parham, K., Yari, M., Atikol, U., 2013b. Alternative absorption heat transformer configurations integrated with water desalination system. Desalination 328, Quoilin, S., Van Den Broek, M., Declaye, S., Dewallef, P., Lemort, V., Techno-economic survey of Organic Rankine Cycle (ORC) systems. Renewable and Sustainable Energy Reviews 22, Ratlamwala, T.A.H., Dincer, I., Development of a geothermal based integrated system for building multigenerational needs. Energy and Buildings 62, Rivera, W., Romero, R., Cardoso, M., Aguillón, J., Best, R., Theoretical and experimental comparison of the performance of a single stage heat transformer operating with water/lithium bromide and water/carrol. International journal of energy research 26, Vélez, F., Segovia, J.J., Martín, M.C., Antolín, G., Chejne, F., Quijano, A., A technical, economical and market review of organic Rankine cycles for the conversion of low-grade heat for power generation. Renewable and Sustainable Energy Reviews 16, Yari, M., A novel cogeneration cycle based on a recompression supercritical carbon dioxide cycle for waste heat recovery in nuclear power plants. International Journal of Exergy 10, Zare, V., A comparative exergoeconomic analysis of different ORC configurations for binary geothermal power plants. Energy Conversion and Management 105, Zhai, X.Q., Qu, M., Li, Y., Wang, R.Z., A review for research and new design options of solar absorption cooling systems. Renewable and Sustainable Energy Reviews 15, Zhang, X., He, M., Zhang, Y., A review of research on the Kalina cycle. Renewable and Sustainable Energy Reviews 16, Zhang, X., Hu, D., Li, Z., Performance analysis on a new multi-effect distillation combined with an open absorption heat transformer driven by waste heat. Applied Thermal Engineering 62,
39 Energy and Exergy Analyses of a Solar, Wind and Geothermal Based Integrated System for Hydrogen Production Abbas Alpaslan Kocer 1*, Murat Ozturk 2 1 Uluborlu Selahattin Karasoy Vocational School, Suleyman Demirel University, 32260, Isparta Turkey 2 Department of Mechatronics Engineering, Faculty of Technology, Suleyman Demirel University, 32260, Isparta Turkey * [email protected] Abstract The increasing energy consumption in the world will have a significant effect on the carbon emission and depletion of carbon based fuels. For possible solution, important investments have made to use the substantial resources and alternative energy. In this paper, an integrated system consists of the solar photovoltaic panels, wind turbines, geothermal power production system, double state organic Rankine system and electrolyzer are considered and analyzed thermodynamically for hydrogen production. The energy and exergy efficiencies of this integrated system are found as % and %, respectively. According to the parametric studies, the performance of the renewable energy based integrated system are also highly dependent on the wind velocity, the solar intensity and the geothermal water flow rate. Keywords: Geothermal power, wind turbine, solar energy, gydrogen, exergy, efficiency. I. Introduction The current means of producing and utilizing fuels and energy are not sustainable. Even thought, the current energy economy has given some important advances for societies, it has also led to considerable environmental deterioration, health problems and security issues. Nowadays, total worldwide environmental damage adds up to US $5.5 trillion a year. On the other hand, fossil fuels are not infinite. World will be out of fossil fuels in the near future. It is estimated that the world oil production peaks in This situation will have a negative impact on the economies of counties, especially the economies of those importing petroleum and its products. Therefore, it is obligatory to find new, sustainable and promising energy sources and change the current energy economy to a sustainable economy, which is hydrogen economy. Many developed counties have already started studies to convert to hydrogen economy. On Earth, hydrogen is usually found within other elements, such as fossil fuels and water. Hence, for hydrogen production, it must be separated from these elements. Currently, the most common method of hydrogen production is the steam methane reforming (SMR) of natural gas and is the least expensive method at present. Also, hydrogen can also be produced from coal or biomass by the process of gasification. The disadvantage of producing hydrogen from fossil fuels can be given such as; i-) The amount of fossil fuel (natural gas and coal) available in the world is finite, ii-) Current studies estimate the amount of remaining fossil fuels in the world will last no more than a couple hundred years, iii-) Further burning of fossil fuels releases toxic gases into the atmosphere which produce environmental catastrophes such as acid rain, raising temperatures and serious health problems due to overall air pollution. There are several studies reported in the literature indicating that hydrogen can be produced using by the renewable energy technologies. Barelli et al. (2011) have given the energy and exergy analyses of a residential combined heat and power (CHP) process driven by a proton exchange membrane fuel cell (PEMFC). Also, they have analyzed the parametric studies to investigate the effects of the PEMFC design indicators, such as temperature, pressure and relative humidity on the integrated process efficiency. Ratlamwala et al. (2011) have conducted an efficiency analysis of a photovoltaic/thermal collector integrated system for hydrogen production. In addition, they have given the parametric studies on the impact of solar intensity, operating time of the PEM electrolyzer, inlet air temperature to the collector and photovoltaic system area on the electricity and hydrogen generation rate. Ratlamwala et al. (2012) have investigated the efficiency of a new integrated geothermal power process for hydrogen production, which consists of the geothermal double flash unit, quadruple effect absorption cooling system and PEM electrolyzer process. Ozturk and Dincer (2013) have given the energy and exergy analyses of a solar energy based integrated process for hydrogen generation. The renewable energy based integrated system have investigated for energy and exergy analyses based on four sub-systems: Rankine cycle, ORC, absorption cooling system, and hydrogen generation process. Khan and Iqbal (2005) have studied the hybrid wind-hydrogen energy system for off-grid electricity production in remote areas. Fluctuating output from the wind turbines have reduced by integrating with a PEM electrolyzer to produce hydrogen for later use. Stored hydrogen was 484
40 then fed to a PEMFC to produce electricity. Their analysis revealed that a reliable supply of energy could be delivered without any conventional battery storage. Shakya et al. (2005) have analyzed the applicability of the stand-alone hybrid wind turbines and PV panels integrated with compressed hydrogen gas storage for Cooma, Australia. The levelized cost of power has calculated as 250 cents kwh-1. More than 50% of total project costs were due to the PEM electrolyzer. In the present paper, the impacts of some different indicators on the renewable energy based hydrogen production system as well as investigating its energy and exergy efficiencies in integrated system mode. In this paper, the comprehensive parametric studies are given to analyze some important indicators influencing the integrated system and its components for hydrogen production from renewable energy technologies. II. System description The integrated energy production system driven by solar, wind and geothermal energy is illustrated in Fig Production Well Flash Chamber Flash Chamber-2 Flash Separator Pump-I Flash Separator Vaporizer Expander-1 22 Electricity 14 Expander-2 Pump Separator Turbine Electricity Mixing 16 Resorber-2 Electricity Resorber-1 NH3-H2O working fluid send to the expander-i to generate power at state 13. Then, the NH3-H2O working fluid goes the separator at state 14. The vapor phase of mixture goes to the double stage organic Rankine turbine to generate power at state 15. The working fluid existing from the double stage organic Rankine turbine goes to the resorber-1 at state 16. The liquid phase of NH3-H2O working fluid goes the expander-ii to generate power at state 18. Low pressured working fluid enters the vaporizer by passing through a pump at states 21 and 22, respectively. The part of power generated in double stage organic Rankine turbine is used in the proton exchange membrane electrolyzer to generate hydrogen. III. Thermodynamic analysis In this paper, the mass, energy and exergy balance equations of the integrated system components are given to analyze the heat or work inputs and outputs, the exergy destruction, the energy and exergy efficiency. The mass balance equation of a control volume at steady state or steady-flow process can be written in the rate form as follows: m in = m out (1) where m is the mass flow rate, the subscripts in and out are the inlet and outlet flow rate, respectively. The balance equation of a control volume can be given as Q + m inh in = W + m out h out (2) The exergy balance equation of a control volume is given as E x Q + m in ex in = E x W + m out ex out + E x D (3) Production Well Pump- 2 Wind turbines Charge regulator Hydrogen Electrolyzer where ex is the specific flow exergy, E x Q is the rate of exergy transfer by heat, E x W is the rate of exergy transfer by work and E x D is the exergy destruction rate. Solar photovoltaic panels Oxygen Fig. 1: The general layout of the integrated system with hydrogen production The integrated system investigated in this study consists of main parts, such as i-) the solar photovoltaic panel system, ii-) the wind turbine system, iii-) the geothermal power system, iv-) the double stage organic Rankine system, v-) the PEM electrolyzer system. The wind turbine and solar photovoltaic panel system are used in the integrated system to produce power. The geothermal power system produces power using by geothermal water production well, flash chamber, flash separator, pump and vaporizer. The power can be produced from the geothermal heat using by the double state organic Rankine cycle. The geothermal water transfers its heat energy to the NH3-H2O working fluid of double stage organic Rankine system double stage organic Rankine system at the vaporizer. The vapor of E x Q = (1 T o T ) Q (4) E x W = W (5) where T o is the ambient temperature. The specific flow exergy can be written as follows: ex = (h h o ) T o (s s o ) (6) where h is the enthalpy, s is the entropy and subscript o stands for dead state. The total exergy rate can be written as E x = m (ex) (7) The maximum specific exergy that can be achieve by the geothermal power sub-system using the geothermal water at T g can be calculated as given below: 485
41 ex max = (h g h o ) T o (s g s o ) (8) III. 1. Wind turbine analysis The known classic wind-power equation should be used to calculate the produced electric power as follows: W WT = P trbη g η b (9) where η g is the generator efficiency (around 80%), η b is the efficiency of working parts like gearbox and bearings (around 95%), and P trb is the power generated by the wind turbine, and can be given as follows: P trb = 1 ρ 2 aira sa v 3 avr C p (10) where ρ air air is the air density, C p is the performance coefficient (theoretically 59% and actually 35%), N g is the generator efficiency (around 80%), A sa is the swept area, and can be calculated as follows: A sa = πd2 4 (11) where D is the diameter of the rotor, v avr is the average speed across the turbine blades, and can be expressed as follows: v avr = 1 2 (v 1 + v 2 ) (12) where v 1 and v 2 are inlet to the turbine and outlet wind speed from the turbine, respectively. The existing wind speed can be calculated as follows (Sahin et al., 2006): 3 v 2 = 2(W potential W generated) ρ air A sa t (13) The energy efficiency of the wind turbine can be given as η wt = E wt,o = 2V max,wti max,wt (14) E wt,i m w,av w,i The exergy balance equation of the wind turbine can be written as follows: E x WT = W rated + H + S (15) where H is the change in enthalpy, and can be given as follows: H = m airc p,a (T out T in ) (16) where C p,a is the air specific heat, m air is the mass flow rate of air, and can be written as follows: m air = ρ air A WT v (17) T in and T out are the wind chill temperature at the input and output of wind turbine. The wind chill temperature of air can be calculated as (Nelson, et al., 2002) T i,wind ch T o 11.3v i T o v i 0.16 (18) The total entropy of the system can be calculated as follows (Kotas, 1985): S = S system + S surround (19) and S = m airt o [C p ln ( T out T in ) Rln ( P 2 P 1 ) Q loss T o ] (20) where P 1 and P 2 are the pressure at the inlet and outlet of the wind turbine, respectively. The pressure rates can be calculated as follows: P i = P o ρ air 2 v i 2 (21) Q loss is the heat losses from rotor blade, and can be given as Q loss = m airc p,a (T o T 1+T 2 2 ) (22) The exergy efficiency of the wind turbine can be written as ψ wt = E xwt,o = 2V max,wti max,wt E x wt,i E x wt,e m 2 w,a(v wt,i Vwt,e 2 ) III. 2. Photovoltaic solar panel analysis (23) The energy balance of the photovoltaic solar panel can be given as follows (Joshi and Dincer, 2009); E PV,i E PV,o E PV,l = 0 (24) where E PV,i is the inlet energy of the photovoltaic solar panel, E PV,o is the outlet energy of the photovoltaic solar panel, and E PV,l is the energy loss from the photovoltaic solar panel to the environment. E PV,i can be calculated as E PV,i = S G A PV (25) where SG is the global solar radiation and APV is the area of photovoltaic solar panel. E PV,o can be calculated as E PV,o = V max,pv I max,pv (26) where V max,pv and Imax,PV are the maximum voltage and maximum current of photovoltaic solar panel. The energy efficiency of photovoltaic solar panel can be calculated as η wt = V max,pvi max,pv S t A PV (27) 486
42 The maximum power production of photovoltaic solar panel can be calculated as (Gurau et al., 2000) E max = S G T o (28) The exergy balance equation of photovoltaic solar panel can be calculated as follows: E x PV = E x PV,elec + E x PV,ther + E x D,PV (29) where E x PV,elec is the electrical exergy, and equals the maximum outlet energy of photovoltaic solar panel. E x PV,ther is the thermal exergy rate, and can be calculated as E x PV,ther = (1 T o T sc ) Q loss,pv (30) where T sc is the solar cell temperature, Q losss,pv is the heat loss rate from photovoltaic solar panel to the environment, and can be given as Q loss,pv = h PV A PV (T c T o ) (31) where h PV is the heat transfer coefficient of photovoltaic solar panel, and can be calculated as h PV = v PV (32) where vpv is the wind speed on photovoltaic solar panel. E x D,PV is the exergy destruction rate of photovoltaic solar panel. The maximum exergy extracted from the solar radiation can be calculated as follows; E x solar = S T A PV (1 T o T s ) (33) where Ts is the solar temperature. An exergy efficiency equation of photovoltaic solar panel can be calculated as follows: ψ PV = E x PV,elec E x PV,ther E x solar (34) III. 3. Geothermal power system Flash Chamber-I: The energy and exergy balance equations for the flash chamber-i can be given as follows, respectively: m 1h 1 = m 2h 2 (35) m 1ex 1 = m 2ex 2 + E x d,fc I (36) The similar relationships can be written for the flash chamber II by using the given above procedure. Flash Separator-I: The energy and exergy balance equations for the flash separator-i can be written as follows, respectively: m 2h 2 = m 3h 3 + m 8h 8 + Q fs I (37) 487 m 2ex 2 = m 3ex 3 + m 8ex 8 + Q fs I (1 T o T fs I ) + E x d,fs I (38) The similar relationships can be written for the flash separator II by using the given above procedure. III. 4. Double-stage ORC Expander-I: The energy and exergy balance equations of the expander-i can be written as follows: m 16h 16 = m 17h 17 + W ex I (39) m 16ex 16 = m 17ex 17 + W Exp I + E x d,exp I (40) The similar relationships can be written for the expander II by using the given above procedure. Separator: The energy and exergy balance equations of the separator unit can be written as m 17h 17 = m 18h 18 + m 21h 21 (41) m 17ex 17 = m 18ex 18 + m 21ex 21 + E x d,sep (42) Turbine: The energy and exergy balance equations can be given for the DS-ORC turbine as follows under steady-state and flow conditions, respectively: m 18h 18 = m 19h 19 + W T (43) m 18ex 18 = m 19ex 19 + W T + E x d,t (44) Resorber-I: Under steady-state and steady-flow conditions, the energy and exergy balance equations for resorber-i can be written as follows, respectively: m 19h 19 + m 26h 26 = m 20h 20 + m 27h 27 (45) m 19ex 19 + m 26ex 26 = m 20ex 20 + m 27ex 27 + E x d,res I (46) The similar relationships can be written for the resorber II by using the given above procedure. Mixing chamber: Under steady-state and flow conditions, the energy and exergy balance equations of the mixing chamber can be written as follows, respectively: m 20h 20 + m 22h 22 = m 23h 23 (47) m 20ex 20 + m 22ex 22 = m 23ex 23 + E x d,mc (48) Pump-IV: Under steady-state and steady-flow conditions, the energy and exergy balance equations for the pump-iv can be written as follows, respectively:
43 m 24h 24 + W P IV = m 25h 25 (49) m 24ex 24 + W P IV = m 25ex 25 + E x d,p IV (50) III.5. PEM electrolyzer The overall chemical reaction of water splitting water in the PEM electrolyzer can be written as follows; H 2 O (l) H 2(g) O 2 (g) (51) where subscript l and g refer to liquid and gas phases, respectively. The following reactions take place in the anode and cathode sites of PEM electrolyzer, respectively. H 2 O (l) 1 O (g) + H (aq) + 2e (52) and + H (aq) + 2e 2H 2 (53) The produced hydrogen and oxygen output flow rate are given as follows, respectively; N H 2,out = J 2F = N H 2 O (54) and N O 2,out = J 4F (55) where J and F are the current density and Faraday constant, respectively, and N H 2 O is the water consumed rate in the PEM electrolyzer. To produce hydrogen from the electrolyzer, electrical power must be input to the PEM electrolyzer, and this can be written as follows; E elec = E x elec = JV (56) where E elec and E x elec are the rate of electrical power and electrical exergy input, respectively. V is the cell potential, and V can be given as follows; V = V o + η act,a + η act,c + η ohm (57) where D is the PEM thickness, σ PEM [λ(x)] is the local ionic PEM conductivity of membrane and can be calculated as follows; σ PEM [λ(x)] = [0.5139λ(x) 0.326]exp [1268 ( T )](60) where x is the distance in the PEM evaluated from the cathode membrane interface, λ(x) is the water content at a location x in the PEM, and can be calculated as follows (Thampan et al. 2001); λ(x) = λ a λ c D x + λ c (61) where λ a and λ c are the water contents at the anode and cathode membrane interface, respectively. The activation over-potential (η act ), given in the right-hand side of Eq. (57), caused by a deviation from current from its equilibrium, and also e - transfer reaction, should be diversified from the concentration of the oxidized and reduced species. The activation over-potential of the PEM can be given as follows (Hamann et al.,2001); η act,i = RT F sinh 1 ( J 2J o,i ), i = a, c (62) J = J o,i [exp ( αzfη act,i RT ) exp ( (1 α)zfη act,i )], i = a, c (63) J o,i = J ref i exp ( E act,i ), i = a, c (64) RT where subscripts a and c are the anode and cathode side of PEM electrolyzer, respectively, J o is the exchange current density, α is the charge transfer coefficient for anode and cathode side reactions, and generally equal to ½. z is the number of electrons involved per reaction. For PEM electrolyzer, z must be 2. J i ref is the pre-exponential factor and E act,i is the activation energy for the anode and cathode side of PEM electrolyzer. Energy and exergy efficiency equations for the PEM electrolyzer are given as follows, respectively; RT where V o is the reversible potential, which is related to the difference in free energy between reactants and products, and it can be determined using by the Nernst equation. η act,a is the activation over-potential of the anode, η act,c is the activation over-potential of the cathode and η ohm is the ohmic over-potential of the electrolyte. The ohmic over-potential of the PEM is be attached to the resistance of membrane to hydrogen ions crossing over PEM, and ohmic over-potential can be written as follows; η ohm = JR (58) where R is the overall ohmic resistance, and can be expressed as follows; R = D dx 0 σ PEM [λ(x)] (59) 488 η elec = ψ elec = LHV H2 m H2 W elec+q heat,pem (65) E x H 2 m H2 W elec+e x heat,pem (66) where LHV H2 is the lower heating value of hydrogen. IV. Results and discussions In this paper, the air density, the turbine blade radius, the wind velocity and the capacity factor (Cp) are taken such as kgm-3, 18 m, 6.8 ms-1 and 0.59, respectively. The effects of the wind speed on the integrated system performance, energetic and exergetic efficiencies of the wind turbine system is given in Fig. 2. As given in this figure, increasing wind speed from 5 ms-1 to 10 ms-1 increases the exergy efficiency, but the energy efficiency does not change with increasing wind speed. The result is might be as
44 an outcome of the increase of the wind turbine system electricity with the increase of the inlet wind velocity to the wind turbine, therefore the exergy destruction rates decrease and also exergy efficiency increases with increasing wind velocity. electrical power is send to the electrolyzer for hydrogen generation; the bond dissociation capability of the electrolyzer decreases and as a result lower rate of hydrogen is produced in the integrated system E W;turbine & Ex W;turbine (kw) E W,turbine (kw) Ex W,turbine (kw) hturbine y turbine hturbine & yturbine W net (kw) W net m H m H2 ( kgs -1 ) V 1 (m/s) Figure 2. Energy, exergy destruction, energy efficiency and exergy efficiency of the wind turbine sub-system with respects to the wind turbine inlet velocity The solar radiation coming on the solar photovoltaic panel and photovoltaic cell temperature are taken such as 775 Wm-2 and 28.8, respectively. Most of the coming solar flux on the solar photovoltaic panel is lost due to the PV converting solar energy into direct current. Fig. 3 illustrates the impact of the solar energy increasing from 500 Wm-2 to 1000 Wm-2 on the energy and exergy efficiency, energy and exergy of the solar photovoltaic panel. The net output energy and exergy of the solar photovoltaic panel are evaluated for thermodynamic analysis. As given in this figure, increasing of solar energy increases the exergy efficiency, but it does not affect the energy efficiency. As solar energy increases, the energy output of the solar photovoltaic panel is increased from 50.8 kw to kw, and the exergy output is increased from 16.1 kw to kw, respectively. E PV & Ex PV (kw) E PV (kw) Ex PV (kw) hpv 0.11 y PV S t (Wm -2 ) Fig. 3. Energy, exergy destruction, energy and exergy efficiencies of the solar PV power system with respects to the solar radiation The power and hydrogen production rate decreases with increasing the water temperature in the geothermal power sub-system (see in Fig. 4). With decrease in electricity generation, lower amount of hpv & ypv Geothermal water inlet pressure (kpa) Fig. 4. Impact of the geothermal water inlet pressure on electricity and hydrogen generation As given in Fig. 5, increase in the electricity and hydrogen generation with increasing the water mass flow rate in geothermal power sub-system. This output is expected because for the investigating geothermal power sub-system temperature and pressure, increase in the geothermal water mass flow rate creates in higher supply of steam passing completely the double state organic Rankine turbine. Therefore, increasing the net produced power by the double state organic Rankine sub-system and generated hydrogen using by the electrolyzer. The amount of electric and hydrogen generation varies from 6 MW to about 10 MW and kgs-1 to kgs-1, respectively with increase in geothermal water mass flow rate from 100 kgs-1 to 200 kgs-1 in this integrated system. W net (kw) W net m H Geothermal water mass flow rate (kgs -1 ) Figure 5. Impact of the geothermal water mass flow rate on electricity and hydrogen generation One of the most important generations of this integrated process is hydrogen, and hydrogen is generated using by the PEM electrolyzer sub-system. The effect of the electrolyzer temperature on the energetic and exergetic performance of the PEM electrolyzer is investigated. The energetic efficiency and exergetic efficiency vary from 61.05% to 67.75% and 60.21% to 62.32%, respectively with increase in the electrolyzer temperature from 60 C to 120 C as illustrated in Fig. 6. These output is provided because m H2 ( kgs -1 )
45 increase in the electrolyzer temperature generates the decrease in electric demand. This is applied feasible by the increase in heat energy as the electrolyzer temperature increases. Also, the total energy need reduces in higher PEM electrolyzer temperature cases. Energy efficiency Fig. 6. Impact of the PEM electrolyzer temperature on energy efficiency and exergy efficiency V. Conclusions T Electrolysis ( o C) helectrolyzer y electrolyzer The alternative resources based integrated system for hydrogen production is analyzed thermodynamically. In this paper, the parametric study of system components is given to see the effects of some different process parameters on the integrated system efficiency including the exergy efficiency and exergy destruction rate. Some concluding outputs of the process are given as: The energetic efficiency of the wind turbine, solar photovoltaic panel, double state organic Rankine cycle and integrated process are calculated as 0.47%, 0.29%, 0.39% and %. The exergetic efficiency of the wind turbine, solar photovoltaic panel, solar pond, double state organic Rankine cycle and integrated process are calculated as %, %, % and %. Increasing the solar energy increases the electricity and hydrogen generation rate. Increasing the wind speed increases the electricity and hydrogen generation rate. This integrated process has no greenhouse gas emissions as it uses alternative resources. Exergy analysis results exhibit the benefits of the renewable based integrated system Exergy efficiency Hamann C H, Hamnett A, Vielstich W, Electrochemistry, Wiley-VCH, 2007, Weinheim. Joshi, A.S., Dincer, I. and Reddy, B.V. (2009) Thermodynamic assessment of photovoltaic systems, Solar Energy, Vol. 83, pp Khan, M.J., Iqbal, M.T., Dynamic modeling and simulation of a small wind-fuel cell hybrid energy system. Renewable Energy. 30: Kotas, T.J. The exergy method of thermal plant analysis. Krieger publishing company, Nelson, C. A., M. Tew, G. E. Phetteplace, R. Schwerdt, A. Maarouf, R. Review of the Federal Interagency Process Used to Select the New Wind Chill Temperature (WCT) Index, Preprints, 18th International Conference on Interactive Information and Processing Systems (IIPS) for Meteorology, Oceanography, and Hydrology, Orlando, FL, Amer. Meteor. Soc., , January Ozturk M, Dincer I: Thermodynamic analysis of a solar-based multi-generation system with hydrogen production. Applied Thermal Engineering Ratlamwala T, Dincer I, Gadalla M: Performance analysis of a novel integrated geothermal-based system for multi-generation applications. Applied Thermal Engineering 2012, 40: Ratlamwala T, Gadalla M, Dincer I: Performance assessment of an integrated PV/T and triple effect cooling system for hydrogen and cooling production. International Journal of Hydrogen Energy 2011, 36: Sahin AD, Dincer I, Rosen MA. Thermodynamics analysis of wind energy. International Journal of Energy Research, 30:553 66, Shakya, B.D., Aye, L., Musgrave, P., Technical feasibility and financial analysis of hybrid wind-photovoltaic system with hydrogen storage for Cooma. International Journal of Hydrogen Energy. 30:9-20. Thampan T, Malhotra S, Zhang J, Datta R, PEM fuel cell as a membrane reactor. Catalysis Today, Volume 67, Issues 1-3, May 2001, Pages References Barelli L, Bidini G, Gallorini F, Ottaviano A: An energetic exergetic analysis of a residential CHP system based on PEM fuel cell. Applied Energy 2011, 88: Gurau V, Barbir F, Liu H, An analytical solution of a Half-Cell model for PEM fuel cells. Journal of the Electrochemical Society, Volume 147, Issue 7, 2000, Pages
46 Exergy Based Environmental Effect of PEM Electrolyser Integrated Hydrogen Gas Storage System Mert Ozsaban 1*, Selcuk Inac 2, Adnan Midilli 1 1 Recep Tayyip Erdogan University, Faculty of Engineering, Mechanical Engineering Department, Energy Division, Fener Campus, Rize, 53100, Turkey 2 TUBITAK Marmara Research Center, Energy Institute, P.O. Box 21, Gebze, Kocaeli, 41470, Turkey * [email protected] Abstract The main objective of this study is to investigate the exergy based environmental effect of PEM electrolyser integrated hydrogen gas storage system in terms of exergy analysis. In this regard, having a 3 kg hydrogen gas producing, compressing and storing capacity per hour, an integrated system including high pressure PEM electrolyser system and three-stage-high pressure hydrogen gas compression and storage system is taken into consideration. In terms of the exergy based environmental effect, the following indicators are taken into account, which are exergetic efficiency, waste exergy ratio and environmental effect factor, and their variations as a function of hydrogen storage pressure are parametrically studied considering i) PEM electrolyser operating pressures at 10, 30, 50 and 100 bar, ii) hydrogen gas flow rate at 3 kg/h, iii) hydrogen storage pressure ranging from 200 to 900 bars, and iv) PEM electrolyser operating temperature at 70 o C. Consequently, it is assumed that environmental effect factor is an important parameter to evaluate the effect of waste exergies on the exergetic efficiency. Moreover, the results from the parametric investigation indicate that waste exergy ratio from to and environmental effect factor from to increase with the rise of hydrogen gas storage pressure from 200 to 900 bar while exergetic efficiency decreases from to Additionally, it is said that the higher PEM electrolyser outlet pressure the lower exergy based environmental effect factor, and the lower waste exergy output, and the higher exergetic efficiency. However, the higher storage pressure the lower exergetic efficiency, the higher waste exergy output, and the higher exergy based environmental effect factor. Thus, it is suggested that this type of the system should be operated at higher PEM electrolyser outlet pressure, and at an optimum hydrogen storage pressure. Keywords: Hydrogen production, hydrogen storage, exergetic efficiency, waste exergy ratio, environmental effect factor. I. Introduction The most of commercial hydrogen is largely produced from natural gas (steam reforming) and coal (gasification). However, due to negative impact on the environment of this production method based on fossil energy, renewable energy sources (solar, wind, geothermal, etc.) are assumed to be the best method for environmental and sustainability hydrogen production. Photo-electrolytic, photo-biological, thermolysis and thermo-chemical processes are other hydrogen production methods. On the other hand, among these hydrogen production techniques, hydrogen production from water electrolysis is appeared to be one of the best alternatives to conventional hydrogen production technologies (Clarke et al., 2010). The produced hydrogen gas should be stored by using the appropriate storing techniques and technologies including low pressure hydrogen gas storage and high pressure hydrogen gas storage. Low-pressure hydrogen gas storage is performed by means of mechanical compressors. However, this method used for hydrogen storage requires energy investment as well as hydrogen compressors and it is a very expensive method for large-scale application. In this context, high-pressure hydrogen production technologies are appeared to be one of the most methods to minimize energy consumption of the mechanical compressor used for hydrogen storage (Santarelli et al., 2011). High-pressure PEM electrolysers are one of the high-pressure hydrogen production technologies. Also, high pressure PEM electrolyser is an efficient system because its eliminate or reduce compression work (Onda et al., 2004), Roy et al. (2006). Compressed hydrogen gas storage technique has potential to mobile application because it is low cost for storage and transportation (Zu et al., 2012). Compressed hydrogen gas composite cylinders are withstand pressures up to 80 MPa (800 bar) (Züttel, 2004). Under these considerations, a detailed literature review is performed on exergy based environmental effect of PEM electrolyser integrated high pressure hydrogen gas storage process. In the literature, it is seen that there are a limited number of studies on high-pressure hydrogen production and storage process. Detailed energy, exergy and sustainability analyses of a hydrogen gas compression processes 491

47 (Ozsaban et al., 2011; 2016), and the energy consumption and exergy analysis of high-pressurized hydrogen gas production system (Inac et al., 2014) were studied. However, there is no study on the exergy based environmental effect of PEM electrolyser integrated hydrogen gas storage system. This lack of information in the literature indicates the originality behind this work. II. Systems Description II.1. Operating Principle In this study, PEM electrolyser integrated hydrogen gas storage system is considered. Figure 1 shows the operating principle of the system. As shown in Fig. 1, pure water enters to the heat exchanger-i at 20 o C and 1 atm and it is increased up to 70 o C which is operating temperature of the PEM electrolyser. Heating of pure water is provided with hot water at 90 o C coming from the heat exchanger-iii in the hydrogen compression system. Heated pure water enters the high pressure pump to increase pressure. Increased pressure of heated pure water enters the PEM electrolyser to produce high pressure hydrogen gas with byproduct of oxygen. The separated oxygen gas can be stored for use in various purposes or released into the environment. The hydrogen gas that has the operating pressure and temperature of the PEM electrolyser is cooled to 25 o C of environmental temperature at constant pressure by means of heat exchanger-ii which is probably the most common type of heat exchangers in industrial applications. Hydrogen gas is cooled down with a cooled water which exits from heat exchanger-i. The hydrogen gas enters the compression stage of the compressor, and is pressurized in accordance with the compression ratio of the compressor. During the compression, hydrogen gas in the compression stage takes heat. The hydrogen gas whose pressure and temperature at the end of the compression stage increase is cooled to 25 o C at constant pressure. This process is represented by a heat exchanger-iii. In this process, the high pressure hydrogen gas loses heat to the cooling water in the heat exchanger at constant pressure. The water used for cooling process of hydrogen gas is stored to use at heating pure water in heat exchanger-i. At the end of these processes, the high pressure and low temperature hydrogen gas is directly transferred to the storage tank which is non-load-bearing non-metal liner axial and hoop wrapped with resin-impregnated continuous filament (Tzimas et al., 2003; Niedzwiecki, 2001). As a general difference from the operating principle of the single stage hydrogen gas compression subunit, hydrogen gas is cooled to 25 o C at the end of each compression stage. 492 Fig. 1: Schematic illustration of PEM electrolyser integrated hydrogen gas storage system (Modified from Inac et al., 2012) II.2. Operating Parameters The following operating parameters in Table 1 have been considered. Tab. 1: Operating parameters Parameter Symbol Unit Values Mass flow rate of hydrogen gas Kg/h 3 Reference environment P bar 1 pressure Reference environment T K temperature Inlet temperature of pure T 1 K water entering the PEM electrolyser Operating pressure of PEM P PEM, bar electrolyser and high P hpp pressure pump Operating temperature of T PEM K PEM electrolyser Hydrogen gas storage P st bar pressure Operating pressure of circulation pump III. Analysis m H2 0 P cp bar 3 In this study, in order to investigate the exergy based environmental effect of PEM electrolyser integrated hydrogen gas storage system, the following parameters are taken into consideration. i) exergetic efficiency, ii) waste exergy ratio and iii) environmental effect factor. The required assumptions and detailed energy and exergy analyses of high-pressure hydrogen gas production and storage system were presented in the literature by Ozsaban (2009), Inac (2009), Ozsaban et al., 2012; Inac et al., 2012;
48 Ozsaban and Midilli (2016). Therefore, energy and exergy analysis of PEM electrolyser integrated hydrogen gas storage system will not be performed here. Only exergy based environmental effect of PEM electrolyser integrated hydrogen gas storage system will be studied based on the exergy values from the literature (Ozsaban, 2009; Inac, 2009; Ozsaban et al., 2011; Inac et al., 2014; Ozsaban and Midilli, 2016). a) Exergetic efficiency (ee) Total exergy of useful output from the system includes high-pressure hydrogen gas exergy in the storage tank while total exergy inputs contain pure water exergy, hot water exergy, the required electricity for hydrogen production and compression processes, and high pressure pure water and hot water pumping. Under these consideration, exergetic efficiency of the system can be written as below, ee Ex u, out Ex in m Ex u, out m w Ex in Ex in ph ch Ex H u out T P Ex st H, u, T, P 2 st ph ch ph W comp W PEM W hpp W cp Ex H O T P H O T P Ex, 2 T, P b) Waste exergy ratio (wer) (1) Total waste exergy output includes exergy by oxygen released from the PEM electrolyser, exergy by hot water from heat exchanger-ii and exergy destruction in the system. More details on this parameter was presented in the literature (Midilli and Dincer, 2009; Kucuk and Midilli, 2015; Ozsaban and Midilli, 2016). Under these considerations, waste exergy ratio can be written as below, m Ex waste Ex out Ex wer D Ex m Ex w Ex in in in IV. Results and Discussion In this study, in order to investigate exergy based environmental effect of the PEM electrolyser integrated hydrogen gas storage system, three important indicators are taken into account. In this regard, Fig. (2) indicates the variation of exergetic efficiency of the PEM electrolyser integrated hydrogen gas storage system as a function of storage pressure in case of three stage compression process. As shown in Fig. (2), exergetic efficiency goes down with the increase of storage pressure of hydrogen gas while going up with the rise of PEM elctrolyser outlet pressure of hydrogen gas. For instance, in case of three-stage compression and 10 bar PEM electrolyser outlet pressure of hydrogen gas, exergetic efficiency is estimated to be in 200 bar and in 900 bar of storage pressure of hydrogen gas while it is in 200 bar and in 900 bar of 100 bar PEM electrolyser outlet pressure of hydrogen gas. In addition, when Fig. (2) is analyzed in detail in terms of Eqs. (1), it can be said that, because of increasing works and cooling water requirements in hydrogen gas production and storage processes, exergetic efficiency decreases with the increase of storage pressure of hydrogen gas for the constant PEM electrolyser outlet pressure. However, it is deduced that, under constant storage pressure, exergetic efficiency goes up with the rise of electrolyser outlet pressure of hydrogen gas because of decreasing work and cooling water requirements. In terms of the exergetic efficiency, for practical applications of PEM electrolyser integrated hydrogen gas storage processes, higher operating pressure of electrolyser can be chosen. O T P T, P 2 water@ T, P D wer ph ch ph W comp W PEM ph Ex W hpp ch Ex W Ex cp H T, P ph Ex Ex c) Environmental effect factor (eef) H T, P Ex Ex water@ T, P (2) Environmental effect factor is a parameter to indicate the system or process has some impact potential on the environment due to total waste exergy output. More details on this parameter was presented in the literature (Midilli and Dincer, 2009; Kucuk and Midilli, 2015; Ozsaban and Midilli, 2016). Under these considerations, environmental effect factor can be written as below, Ex wer eef ee ph waste u, out O T P T, P 2 eef ph ch Ex Ex Ex Ex ch H2, u, out@ T, Pst Ex Ex m out m u, out Ex Ex Ex D ph water@ T, P H2, u, out@ T, Pst Ex D, out (3) 493 Fig. 2: Variation of exergetic efficiency of PEM electrolyser integrated hydrogen gas storage process as a function of hydrogen gas storage pressure in case of three stage compression Fig. (3) indicates the variation of waste exergy ratio with storage pressure for PEM electrolyser integrated hydrogen gas storage processes in case of three stage compression. As shown in Fig. (3), waste exergy ratio increases with the rise of storage pressure of hydrogen gas while going down with the rise of electrolyser outlet pressure of hydrogen gas. For instance, in case of three-stage compression and
49 10 bar electrolyser outlet pressure, it is determined that waste exergy ratio is in 200 bar and in 900 bar of storage pressure of hydrogen gas while while it is in 200 bar and in 900 bar of 100 bar PEM electrolyser outlet pressure of hydrogen gas. In addition, when Fig. (3) is analyzed in detail in terms of Eq. (2), it can be said that, because of more work usage, more cooling water resulting from the rise of storage pressure of hydrogen gas, waste exergy ratio increases. However, it is deduced that, under constant storage pressure, waste exergy ratio goes down because of less work usage and less cooling water being based on the rise of electrolyser outlet pressure of hydrogen gas. Fig. 4: Variation of environmental effect factor of PEM electrolyser integrated hydrogen gas storage process as a function of storage pressure of hydrogen gas in case of three stage compression V. Conclusion Fig. 3: Variation of waste exergy ratio of PEM electrolyser integrated hydrogen gas storage process as a function of storage pressure of hydrogen gas in case of three stage compression Fig. (4) presents the variation of environmental effect factor with storage pressure for PEM electrolyser integrated hydrogen gas storage processes in case of three stage compression. As shown in Fig. (4), environmental effect factor increases with the rise of storage pressure of hydrogen gas while going down with the rise of electrolyser outlet pressure of hydrogen gas. For instance, in case of three-stage compression and 10 bar electrolyser outlet pressure, it is determined that environmental effect factor is in 200 bar and in 900 bar of storage pressure of hydrogen gas while it is in 200 bar and in 900 bar of 100 bar PEM electrolyser outlet pressure of hydrogen gas. In addition, when Figs. (4) are analyzed in detail in terms of Eq. (3), it can be said that, because of more work usage, more cooling water resulting from the rise of storage pressure of hydrogen gas, environmental effect factor increases. However, it is deduced that, under constant storage pressure, environmental effect factor goes down because of less work usage and less cooling water being based on the rise of electrolyser outlet pressure of hydrogen gas. In order to explore the exergy based environmental perspective of PEM electrolyser integrated high pressure hydrogen gas storage system, this paper discussed the exergy based environmental effect of the system by taking into account exergetic efficiency, waste exergy ratio and environmental effect factor. Based on the main findings, the following concluding remarks can be drawn: i) It can be assumed that environmental effect factor is an important parameter to evaluate the physical effect of waste exergies on the exergetic efficiency. ii) The results from the evaluation of the indicators indicate that waste exergy ratio from to and environmental effect factor from to increase with the rise of hydrogen gas storage pressure from 200 to 900 bar while exergetic efficiency decreases from to iii) It is said that the higher PEM electrolyser outlet pressure the lower exergy based environmental effect factor, and the lower waste exergy output, and the higher exergetic efficiency. iv) The higher storage pressure the lower exergetic efficiency, the higher waste exergy output, and the higher exergy based environmental effect factor. Accordingly, it is suggested that this type of the system should be operated at higher PEM electrolyser outlet pressure, and at an optimum hydrogen storage pressure. Acknowledgements We would like to thank Nigde University in Turkey for technical support and Recep Tayyip Erdogan University in Turkey for academic support. 494
50 Nomenclature m :mass flow rate (kg/s) P :Pressure (bar) T :Temperature (Kelvin) W :work (kw) E x :exergy rate (kw) ee :exergetic efficiency - wer :waste exergy ratio - eef :environmental effect factor - Superscripts ph :physical ch :chemical Subscripts PEM :PEM electrolyser hpp :high pressure pump cp :circulation pump comp :compression st :storage :reference environment H2 :hydrogen gas u :useful in :input out :output water :water from network H2O :pure water O2 :Oxygen gas D :destruction References Clarke R.E., Giddey S., Badwal SP. Stand-alone PEM water electrolysis system for fail safe operation with a renewable energy source. International Journal of Hydrogen Energy, 35(3), , (2010). Inac S. Thermodynamic modelling and energy sustainability analysis of high pressure hydrogen Production System (in Turkish). Graduate School of Natural and Applied Science, MSc Thesis, Nigde University, Turkey; (2009). Inac S., Midilli A., Dincer I. Development of exergetic sustainability parameters for high pressure hydrogen production. Proceeding of Global Conference on Global Warming, pg , Istanbul, Turkey, (2012). Inac S., Midilli A., Dincer I., Exergetic Evaluation of a High-Pressure Hydrogen Production System. In: Dincer I, Midilli A, Kucuk H, editors. Progress in Exergy, Energy, and the Environment, Springer, p , (2014) Kucuk H., Midilli A., Assessment of exergetic sustainability indicators for a single layer solar drying system, International Journal of Exergy, 16(3), , (2015). (2009). Niedzwiecki, A. Storage. Washington, D.C. Presentation at DoE Hydrogen Vision Meeting, (2001). Onda K., Kyakuno T., Hattori K., Ito K., Prediction of production power for high-pressure hydrogen by high-pressure water electrolysis. Journal of Power Sources 132(1), 64-70, (2004). Ozsaban M., Thermodynamic modelling and energy sustainability analysis of high pressure hydrogen gas storage (in Turkish). Graduate School of Natural and Applied Science, MSc Thesis, Nigde University, Turkey; (2009). Ozsaban M., Midilli A., Dincer I., Exergy analysis of a high pressure multistage hydrogen gas storage system. International Journal of Hydrogen Energy, 36(17), , (2011). Ozsaban M., Inac S., Midilli A., Dincer I., Energetic and exergetic assessment of high pressure hydrogen production and storage processes. Proceeding of Global Conference on Global Warming, pg , Istanbul, Turkey, (2012). Ozsaban M., Midilli A., A parametric study on exergetic sustainability aspects of high-pressure hydrogen gas compression. International Journal of Hydrogen Energy 41(11), , (2016). Roy A., Watson S., Infield D., Comparison of electrical energy efficiency of atmospheric and high-pressure electrolysers. International Journal of Hydrogen Energy, 31(14), , Santarelli M., Medina P., Calì M., Fitting regression model and experimental validation for a high-pressure PEM electrolyzer. International Journal of Hydrogen Energy, 34(6), , ( 2009). Tzimas, E., Filiou, C., Peteves, S. D. and Veyret., J. B. Hydrogen storage: state of the art and future perspective, Petten, The Netherlands, ISBN , European Communities, (2003). Zu L., Zhang D., Xu Y., Xiao D., Integral design and simulation of composite toroidal hydrogen storage tanks. International Journal of Hydrogen Energy, 37(1), , (2012). Züttel A. Hydrogen storage methods. Naturwissenschaften 2004;91(4): Midilli A., Dincer I., Development of some exergetic parameters for PEM fuel cells for measuring environmental impact and sustainability. International Journal of Hydrogen Energy, 34(9), , 495
51 FUEL CELLS 496
52 Studying the Effect of Electrolyte Thickness on Exergetic Performance for an Electrolyte Supported SOFC Stack Ugur Akbulut 1 *, Adnan Midilli 1, Ibrahim Dincer 2 1 Department of Mechanical Engineering, Faculty of Engineering, Recep Tayyip Erdogan University, Rize, Turkey 2 Faculty of Engineering and Applied Science, University of Ontario Institute of Technology, 2000 Simcoe Street North, Oshawa, Ontario L1H 7K4, Canada * [email protected] Abstract This study performs a parametric investigation of the effect of electrolyte thicknesses on the exergetic performance for an electrolyte supported SOFC stack. In this regard, the typical electrolyte material, which is Yttria Stabilized Zirconia (YSZ), is selected, and its thicknesses are taken between 100 and 500 μm with 50 μm intervals while anode and cathode thicknesses are selected to be 50 μm each. Moreover, it is also assumed that i) 97% H2+3% H2O is used as fuel and oxygen is used as oxidant, ii) current density is taken from 0.1 to 0.6 A/cm 2 with 0.1 A/cm 2 intervals, iii) cell pressure is 1 atm, and iv) cell temperature is ranging from K with 50 K intervals. Consequently, under the selected operating conditions, it is exergetically necessary to use the YSZ electrolyte supported SOFC stack whose exergetic efficiency is higher by average ~ 30%. In order to operate this type of fuel cell in an exergetically more efficient manner, it is necessary to select the minimum YSZ electrolyte thickness at least more than 150 μm by average. Furthermore, decreasing operating temperatures and increasing thicknesses of an YSZ electrolyte supported SOFC stack decrease the exergetic efficiency. Keywords: SOFC, hydrogen, yttria stabilized zirconia, exergetic efficiency, current density, overpotential. I. Introduction Solid oxide fuel cells, commonly manufactured in tubular and planar configurations, have recently attracted considerable interest for stationary and industrial applications. The most important features of these cells can be compiled as high efficiency, low pollutant emissions, fuel flexibility, and high operating temperature which allow a variety of cogeneration possibilities (Singhal, 2002; Khaleel et al., 2004; Xue et al., 2005; Ni et al., 2007; Hussain et al., 2009; Ahn et al., 2009; Xu et al., 2014). In terms of cost, it can be said that their energy conversion management, fuel reforming technique, architectural design, fuel consumption and materials for anode, cathode and electrolyte, (Arpino and Massarotti, 2009; Wojciech and Jaroslaw, 2011; Xu et al., 2014), should be taken into consideration in order to reduce the costs of these fuel cells. In terms of their electrolyte materials, a literature review indicates that, of the most important electrolyte materials, 8mol% Yttria Stabilized Zirconia (YSZ) is the most popular electrolyte material in solid oxide fuel cells (Minh and Takahashi, 1995; Han et al., 2010) whose anode material is Ni/YSZ and cathode material is doped lanthanum manganite (LSM)/YSZ. In terms of energy management, there are three types of SOFCs which are anode supported SOFCs, cathode supported SOFCs and electrolyte supported SOFCs. In electrolyte-supported SOFCs, the thickness of YSZ electrolyte is generally 150 ~ 300 μm, operating at 800~1000 C (Singhal and Kendall, 2004; Han et al., 2010). In anode-supported SOFCs, the thicknesses of YSZ electrolyte is generally 15~30μm, operating at 600~800 C (Singhal and Kendall, 2004; Han et al., 2010). In an electrolyte-supported SOFCs, the ohmic effect of the electrolyte layer should also be taken into account for energetic or exergetic efficiency improvements, because electrolyte is the thickest component. In this regard, based on the literature review, electrolyte thickness is considered in this study as one of the most important parameters affecting exergetic performance of the electrolyte supported SOFCs. Under these important considerations, in order to investigate the electrolyte thicknesses effect on the exergetic efficiency of an electrolyte supported SOFC stack, a parametric study is performed. For this purpose, a detailed literature review is carried out, considering the effect of electrolyte thicknesses on the exergetic performance for an electrolyte supported SOFC stack. Note that limited studies are available on the effect of electrode and electrolyte thicknesses on the SOFC cell performance (e.g. Ni et al., 2007; Patcharavorachot et al., 2008; Ahn et al., 2009; 2010; Demircan et al., 2010; Cai et al., 2011; Xu et al., 2014). However, it is observed that no studies are conducted on the effect of the YSZ electrolyte thickness on the exergetic performance of an electrolyte supported SOFC stack. As differing from the above studies, this paper presents all details on the effect of the YSZ electrolyte thickness on the exergetic performance of an electrolyte supported SOFC stack by taking into account the effective parameters, such as (i) operating temperature (ranging from 1073 K to 1273 K), (ii) operating pressure (=1 atm), (iii) anode and cathode 497
53 thicknesses (= 50 μm each) and (iv) current density (ranging from 0 to 0.6 A/cm 2 ). All values for hydrogen, oxygen, nitrogen and water vapor are taken from the NIST (Website) II. Analysis In order to perform the main objective of this study, the following assumptions are considered: An electrolyte supported SOFC stack is considered. Hydrogen is used as a fuel and only hydrogen is electrochemically reacted. Fuel consists of 97% H2 and 3% H2O and air as oxidant consists of 79% N2, 21% O2 (Costamagna et al., 2004; Ni et al., 2007; 2009; Yonekura et al., 2011; Ranjbar et al., 2014). The chemical exergy of nitrogen is not taken into account because it is inert gas and not a function of temperature. The fuel cell is insulated perfectly, so there is no heat interaction with environment. Temperatures at channel inlets and exits are the same (Colpan et al., 2007; Ranjbar et al., 2014). Radiation heat transfer between gas channels and solid structures is neglected (Ranjbar et al., 2014). Contact resistances are ignored. Radiation transfer between solid structure and gas channels is ignored. The electrodes and electrolyte materials of the SOFC are taken to be Ni-YSZ/YSZ/LSM-YSZ (Chan et al., 2002; Costamagna et al., 2004; Singhal and Kendall, 2004; Colpan et al., 2007; Han et al., 2010; Zheng et al., 2014). SOFC stack operates under steady-state conditions (Hussain et al., 2006; Colpan et al., 2007). Kinetic and potential exergies are neglected. SOFC operating pressure is taken to be 1 atm (Costamagna et al., 2004, Colpan et al., 2007; Mirahmadi et al., 2011; Verma et al., 2013). Dead state pressure is 1 atm and dead state temperature is 298 K. SOFC operating temperatures are taken between 1073 and 1273 K, and membrane thickness is selected between 100 and 500 μm considering the values in the literature (Singhal and Kendall, 2004; Han et al., 2010). Each reactant in SOFC is an ideal gas (Chan et al., 2002; Larminie and Dicks, 2003; Hussain et al., 2006; Colpan et al., 2007; Tanim et al., 2014). Flow of reactants is steady, incompressible and laminar. Pressure drops along the fuel cell are neglected (Hussain et al., 2006; Colpan et al., 2007; Tanim et al., 2014). The product water is in vapor phase. Current density is taken from 0 to 0.6 A/cm 2. The utilization ratios of hydrogen and oxygen are taken to be 80% and 50%, respectively (Ishak et al., 2012; Tanim et al., 2014) Active area of a single cell is selected to be 100 cm 2 and a stack is composed of 100 cells. All activation, ohmic, and concentration polarizations are considered. 498 Table 1: The required parameters for the calculations Parameter Value Ref. Operating temperature (T) K (Singhal and Kendall, 2004; Han et al., 2010). Operating (Mirahmadi and Valefi, 1 atm pressure (P) 2013) Current density (J) A/cm 2 (Baniasadi and Alemrajabi, 2010) Faraday constant (F) A.s/mol (Verma et al.,2013) Number of electrons per (Costamagna et al., 2 mol (ne) 2004) Anode (Ni et al., 2007; Verma 50 μm thickness (La) et al, 2013) Electrolyte (Singhal and Kendall, μm thickness (Le) 2004; Han et al., 2010). Cathode thickness (Lc) 50 μm (Ni et al., 2007) Porosity (ε ) 30% (Ishak et al., 2012) Tortuosity (ξ) 6 (Ishak et al., 2012) Pore radius (r p ) 0.5 μm (Ishak et al., 2012) Diffusion volume of 6.12x10⁻⁶ hydrogen (v H2 ) m 3 /mol (Zheng et al., 2014) Diffusion volume of water (v H2O ) 13.1x10⁻⁶ m 3 /mol (Zheng et al., 2014) Diffusion volume of 16.3x10⁻⁶ oxygen (v O2 ) m 3 /mol (Zheng et al., 2014) Diffusion volume of 18.5x10⁻⁶ nitrogen (v N2 ) m 3 /mol (Zheng et al., 2014) Molar fraction of hydrogen %97 (Yonekura et al., 2011) Molar fraction of water %3 (Yonekura et al., 2011) Molar fraction of oxygen %21 (Yonekura et al., 2011) In the literature, total cell overpotential (irreversible cell voltage) and net cell voltage are expressed in Eqs. (1 and 2) (Costamagna et al, 2004; Tanim et al., 2014). V t,ir = V ohm + V act + V con (1) V net = V rev V t,ir (2) Through the parametric study, rational overpotentials of an electrolyte supported SOFC stack have been defined for better understanding i) the share of the ohmic, activation and concentration overpotentials in total overpotential, ii) the effect of operating temperature on the overpotentials, iii) the acceptable operating ranges of temperature, current density, electrolyte thickness, iv) the influence of overpotentials on the exergetic efficiency. In this regard, rational ohmic overpotential, rational activation overpotential and rational concentration overpotential are defined as below: ψ ohm = V ohm V t,ir (3) ψ act = V act V t,ir (4) ψ con = V con V t,ir (5) Detailed calculations of ohmic (Vohm), activation (Vact) and concentration (Vconc) overpotentials are given in the literature (Colpan et al. 2008; Kazempoor et al., 2010; Tanım et al., 2014). Assuming that a single cell has 100 cm 2 active area and a stack is composed of 100 cells, total active area of the SOFC stack area can be calculated as below (Trendewicz and Braun, 2013),
54 W = W cella tot (6) A tot = A cell N cell (7) In order to estimate the molar flow rate of hydrogen, the fuel utilization factor (UF) is defined as below (Campanari, 2001; Ishak et al.,2012), U F = n H2,consumed n H2,in (8) Considering the electrochemical reaction in Eq. (9), c, the molar flow rate of hydrogen consumed in the SOFC, can be calculated (Colpan et al., 2007): H O 2 c H 2 O (9) c = JA tot n e F (10) n H2,in = JA tot n e FU F (11) n H2,out = n H2,in c (12) The molar flow rates of oxygen and nitrogen at the air channel inlet and exit can be calculated as below (Colpan et al., 2007): c n O2,in = (13) 2U ox n O2,out = c 2U ox c 2 n N2,in = n N2,out = (14) 79 c 42 U ox (15) The molar flow rates of water output can be estimated by using Eqs. (16 and 17) (Colpan et al., 2007) n H2O,out = c (16) n H2,in + n O2,in + n N2,in = n H2,out + n O2,in + n N2,out + n H2O,out (17) The heat generated from the SOFC stack can be written by considering the general energy balance equation for a SOFC stack (Chan et al., 2001): Q = (E H2,in + E air,in) (E H2,out + E air,out + E H2O,out + W ) (18) In this study, it is assumed that E air = E O2 + E N2 In the clear form, the heat generated from the SOFC stack can be written as below, Q = [n H2,in (LHV H2 + h H2 (T) h H2 (298)) + n O2,in (h O2 (T) h O2 (298)) + n N2,in (h N2 (T) h N2 (298))] [n H2,out (LHV H2 + h H2 (T) h H2 (298)) + n O2,out (h O2 (T) h O2 (298)) + n N2,out (h N2 (T) h N2 (298)) + n H2O,out (h H2O (T) h H2O (298)) + W ](19) The exergetic efficiency for a SOFC stack can be generally defined as below, 499 E x η ex = W = E x in,h2 +E x in,air W ch ph E x in,h2 +E x in,h2 +E ch ph x in,o2 +E x in,o2 +E x in,n2 ph (20) where E x ph ch i and E x i is the physical and chemical molar flow exergy for each component of the inlet and outlet flow streams, respectively. They can be defined as follows: E x i ph = n i [(h i h 0 ) T 0 (s s 0 )] (21) The chemical exergy arises from the difference between the system and the reference environment. The chemical exergy of a stream in the system can be expressed as (Ye et al., 2015) E x i ch = n iex i ch = n i x j (µ j o µ j oo ) j (22) where xj is the mole fraction of the species j in the system, μ0j is the chemical potential of species j in the system evaluated at the reference temperature of K and the reference pressure of kpa, and μ00j is the chemical potential of species j in the system evaluated at the condition defined for the reference environment. III. Results and discussion In this study, a parametric investigation on the effect of electrolyte thicknesses on the exergetic performance for an electrolyte supported SOFC stack is performed. In this regard, the following variations are discussed, i) variation of rational overpotentials as a function of operating temperature under various current densities (see Fig. 1), ii) variation of exergetic efficiency as a function of electrolyte thickness under various current densities (see Fig. 2), iii) variation of exergetic efficiency as a function of rational ohmic overpotantials under various electrolyte thicknesses and current densities (see Fig. 3) and iv) variation of exergetic efficiency as a function of electrolyte thickness under various operating temperatures (see Fig. 4). Ψ ohm, Ψ act, Ψ con 1,0 0,9 0,8 0,7 0,6 0,5 0,4 0,3 0,2 0,1 La=50 μm, Lc=50 μm, Le=300 μm, P=1 atm Ψohm, Ψact, Ψcon ; J=0.2 A/cm 2 Ψohm, Ψact, Ψcon ; J=0.4 A/cm 2 Ψohm, Ψact, Ψcon ; J=0.6 A/cm 2 ohmic activation concentr. 0, Operating temperature (K) Fig.1: Variation of rational overpotantials as a function of operating temperature under various current densities.
55 Figure 1 presents the variation of rational overpotantials as a function of operating temperature under various current densities. It is assumed that anode and cathode thicknesses are taken to be 50 μm each while YSZ electrolyte thickness is selected to be 300 μm, and operating pressure is equal to 1 atm, and current densities are taken to be 0.2, 0.4 and 0.6 A/cm 2. As shown in this figure, it is found that rational ohmic overpotential increases from to while rational concentration overpotantials (ranging from to 0.081) and rational activation overpotantial (ranging from to 0.295) decrease with the rise of operating temperature from 1073 to 1273 K. Moreover with the increase of current densities from 0.2 to 0.6 A/cm 2 rational ohmic overpotantial goes up while rational activation and rational concentration overpotantials decrease. According to Fig. 1, considering the profile of rational ohmic overpotential, it can be said that, under the selected operating conditions, the performance improvement in the YSZ electrolyte supported SOFC stack should be done at the temperatures before the operating temperature of 1173 K that means the starting point of the performance increase of this stack. increase exergetic efficiency. On the other word, as shown in this figure, exergetic efficiency is obtained between and in case of 0.2 A/cm 2 of current density by the increase of the YSZ electrolyte thickness under the selected operating conditions. When the current density increases, the YSZ electrolyte thickness should be carefully selected. For example, under the selected operating conditions, if the current density is taken to be 0.4 A/cm 2 while the YSZ electrolyte thickness is 500 μm, it is impossible to operate an YSZ electrolyte supported SOFC stack as a conclusion of exergetic efficiency. The same problem can be seen at the values of the YSZ electrolyte thicknesses bigger than 250 μm when the current density is taken to be 0.6 A/cm 2. Consequently, it can be said that, under the selected operating conditions, it is exergetically necessary to use an YSZ electrolyte supported SOFC stack whose exergetic efficiency is higher by average ~ 30%. In terms of durability and manufacturing of an YSZ electrolyte supported SOFC stack under the selected operating conditions, it is suggested that the YSZ electrolyte thicknesses lower than 150 μm shouldn t be preferred in spite of high theoretical exergetic efficiency. Exergetic efficiency 0,6 0,5 0,4 0,3 0,2 Le=100 μm Le=100 μm Le=100 μm Le=150 μm Le=150 μm Le=150 μm Le=200 μm Le=200 μm Le=250 μm Le=250 μm Le=300 μm Le=300 μm La=50 μm, Lc=50 μm, T=1073 K, P=1 atm Le=350 μm J=0.2 A/cm 2 J=0.4 A/cm 2 J=0.6 A/cm 2 Le=400 μm Le=450 μm Le=500 μm Exergetic eficiency 0,8 0,7 0,6 0,5 0,4 0,3 0,2 La=50 μm, Lc=50 μm, T=1073 K, P=1 atm J 1 J 2 J 3 J4 J 5 J 6 J 1 J 2 J 3 J 4 J 5 J 6 J 1 J 2 J 3 J 4 J 5 J 1=0.1 A/cm 2 J 2=0.2 A/cm 2 J 3 =0.3 A/cm 2 J 4 =0.4 A/cm 2 J 5=0.5 A/cm 2 J 6=0.6 A/cm 2 J 1 J 2 J 3 J 4 J 1 J 2 J 3 J 4 J 1 J 2 J 3 J 1 J 2 J 3 J 1 J 2 J 3 J 1 Le=100 Le=150 Le=200 Le=250 Le=300 Le=350 Le=400 Le=450 Le=500 J 2 0,1 Le=200 μm Le=250 μm Le=350 μm Le=450 μm 0, Electrolyte thickness (μm) Le=400 μm Fig. 2: Variation of exergetic efficiency as a function of electrolyte thickness under various current densities. Figure 2 illustrates the variation of exergetic efficiency as a function of YSZ electrolyte thickness under various current densities. It is assumed that anode and cathode thicknesses are taken to be 50 μm each while operating temperature and pressure is equal to 1073 K and 1 atm, respectively. Moreover current densities are taken to be as 0.2, 0.4 and 0.6 A/cm 2 respectively while electrolyte thicknesses range from 100 to 500 μm with 50 μm intervals. As shown in this figure, exergetic efficiency (ranging from 0 to 0.528) decreases with the rise of YSZ electrolyte thickness (from 100 to 500 μm) based on the increase of current densities (from 0.2 to 0.6 A/cm 2 ). Consequently, based on the YSZ electrolyte thickness of the YSZ electrolyte supported SOFC stack under selected operating conditions, a lower current density (should not be lower than 0.2 A/cm 2 ) and a lower YSZ electrolyte thickness (should not be lower than 150 μm) should be preferred in order to 500 0,1 J 6 0,0 0,40 0,45 0,50 0,55 0,60 0,65 0,70 0,75 0,80 0,85 Rational ohmic overpotential (Ψ ohm) Fig.3: Variation of exergetic efficiency as a function of rational ohmic overpotential under various electrolyte thicknesses and current densities. Figure 3 shows the variation of exergetic efficiency as a function of rational ohmic overpotential under various YSZ electrolyte thicknesses and current densities. It is assumed that anode and cathode thicknesses are taken to be 50 μm while operating temperature and pressure is equal to 1073 K and 1 atm, respectively. Moreover, current densities are taken from 0.1 to 0.6 A/cm 2 with 0.1 A/cm 2 intervals while the YSZ electrolyte thicknesses range from 100 to 500 μm with 50 μm intervals. As seen in this figure, exergetic efficiency (ranging from 0 to 0.512) decreases with the increase of rational ohmic overpotential (from to 0.797) based on the rise of the YSZ electrolyte thicknesses (from 100 to 500 μm) and current densities (from 0.1 to 0.6 A/cm 2 ). As a conclusion, it can be said that, at the constant temperature, exergetic efficiency decreases with the rise of rational ohmic overpotential. J 5 J 6 J 5 J 4 J 5 J 4 J 4 J 3
56 Exergetic efficiency 0,52 0,50 0,48 0,46 0,44 0,42 0,40 0,38 0,36 0,34 0,32 0,30 0,28 T=1073 K T=1173 K T=1273 K La=50 μm, Lc=50 μm, J=0,2 A/cm 2, P=1 atm 0, Electrolyte thickness (μm) Fig.4: Variation of exergetic efficiency as a function of electrolyte thickness under various operating temperatures. Figure 4 introduces the variation of exergetic efficiency as a function of the YSZ electrolyte thickness under various operating temperatures. It is assumed that anode and cathode thicknesses are taken to be 50 μm while operating pressure and current density is equal to 1 atm and 0.2 A/cm 2, respectively. Moreover operating temperatures are taken to be 1073, 1173 and 1273 K while YSZ electrolyte thicknesses range from 100 to 500 μm with 50 μm intervals. As shown in this figure, exergetic efficiency (ranging from to 0.497) decreases with the rise of electrolyte thicknesses. At a constant YSZ electrolyte thickness, for example, for 300 μm, exergetic efficiency increases from to with the rise of operating temperature from 1073 to 1273 K. It is concluded that, under the selected operating conditions, low operating temperatures and high YSZ electrolyte thicknesses decrease the exergetic efficiency of an YSZ electrolyte supported SOFC stack. IV. Conclusions In this study, a parametric investigation on the effect of YSZ electrolyte thickness on the exergetic performance of an YSZ electrolyte supported SOFC stack has been achieved. The following concluding remarks can be drawn: It is exergetically necessary to use the YSZ electrolyte supported SOFC stack whose exergetic efficiency is higher by average ~ 30%. In case the YSZ electrolyte thickness is selected to be lower than 150 μm, some durability and manufacture problems can occur in spite of high theoretical exergetic efficiency of an YSZ electrolyte supported SOFC stack. Low operating temperatures and high YSZ electrolyte thicknesses decrease the exergetic performance of an YSZ electrolyte supported SOFC stack. Under the selected operating conditions, the performance improvement in the YSZ electrolyte supported SOFC stack should be done at the temperatures before the operating temperature of 1173 K. Nomenclature A : Area (m 2 ) c : Extent of chemical reaction D : Diffusion coefficient (m 2. s -1 ) Di,k : Knudsen diffusion coefficient of species i (m 2. s -1 ) Di,l : Binary diffusion coefficient of species i and l (m 2. s -1 ) E : Energy rate (kw) E x : Exergy rate (kw) ee : Exergetic efficiency F : Faraday constant (96485 A.s.mol -1 ) h : Molar enthalpy (kj/mol) h i(t) : Specific molar enthalpy of species i at constant temperature T (kj/mol) J : Current density (A. cm -2 ) LHV : Lower heating value (kj/mol) n : Molar flow rate (mol.s -1 ) ne : Number of electrons per mol (2) N : Number P : Pressure (atm) Q : Heat flow (kw) T : Operating temperature (K) UF : Fuel utilization factor Uox : Air utilization factor V : Potential (Volt) VN : Nernst potential (Volt) Vnet : Net cell voltage (Volt) Vrev : Reversible cell voltage (Volt) Vt,ir : Irreversible cell voltage (Volt) W : Power (kw) Greek Letters Ψ : Rational overpotential Superscripts ch : Chemical ph : Physical Subscripts 0 : Reference environment act : Activation cell : Cell con : Concentration eff : Effective i : Species i in : Input H2 : Hydrogen H2O : Water N2 : Nitrogen net : Net ohm : Ohmic out : Output O2 : Oxygen tot : Total References Ahn, J.S., Pergolesi, D., Camaratta, M. A., Yoon, H., Lee, B. W., Lee, K. T., Jung, D. W.,Traversa, E., Wachsman, E. D., Electrochemistry Communications 11, (2009) 501
57 Ahn, J.S., Omar, S., Yoon, H., Nino, J. C., Wachsman, E. D., Performance of anode-supported solid oxide fuel cell using novel ceria electrolyte, Journal of Power Sources, 195, (2010) Arpino F, Massarotti N., Numerical simulation of mass and energy transport phenomena in solid oxide fuel cells, Energy, 34 (12), (2009) Banisadi, E., Alemrajabi, A. A., Fuel cell energy generation and recovery cycle analysis for residential application, International Journal of Hydrogen Energy, 35, (2010) Cai, Q., Adjiman, C.S., Brandon, N. P., Investigation of the active thickness of solid oxide fuel cell electrodes using a 3D microstructure model, Electrochimica Acta 56, (2011) Campanari, S., Thermodynamic model and parametric analysis of a tubular SOFC module, Journal of Power Sources, 92, (2001) Chan, S.H., Khor, K.A., Xia, Z.T. A complete polarization model of a solid oxide fuel cell and its sensitivity to the change of cell component thickness, Journal of Power Sources, 93, (2001) Chan, S.H., Low, C.F., Ding, O. L., Energy and exergy analysis of simple solid-oxide fuel cell, power systems, Journal of Power Sources, 103, (2002) Colpan, C.O., Dincer, I., Hamdullahpur, F., Thermodynamic modeling of direct internal reforming solid oxide fuel cells operating with syngas, International Journal of Hydrogen Energy, 32, (2007) Colpan, C.O., Dincer, I., Hamdullahpur, F., A review on macro-level modeling of planar solid oxide fuel cells. Int. J. Energy Res., 32, (2008) Costamagna, P., Selimovic, A., Borghi, M.D., Agnew, G., Electrochemical model of the integrated planar solid oxide fuel cell (IP-SOFC), Chemical Engineering Journal,102, (2004) Demircan, O., Zhang, W., Xu, C., Zondlo, J., Finklea, H.O., The effect of overpotential on performance degradation of the solid oxide fuel cell Ni/YSZ anode during exposure to syngas with phosphine contaminant, Journal of Power Sources, 195, (2010) performance solid oxide fuel cells based on tri-layer yttria-stabilized zirconia by low temperature sintering process, Journal of Power Sources 195, , (2010) Hussain, M.M, Li, X., Dincer, I. Mathematical modeling of planar solid oxide fuel cells, Journal of Power Sources,161: (2006) Hussain, M.M, Li, X., Dincer, I., A general electrolyte electrode-assembly model for the performance characteristics of planar anode-supported solid oxide fuel cells, Journal of Power Sources,189: (2009) Ishak, F., Dincer, I., Zamfirescu, C., Energy and exergy analyses of direct ammonia solid oxide fuel cell integrated with gas turbine power cycle, Journal of Power Sources, 212, (2012) Kazempoor, P., Dorer, V., Ommi, F., Modelling and Performance Evaluation of Solid Oxide Fuel Cell for Building Integrated Co- and Polygeneration. Fuel Cells 10(6), (2010) Khaleel, M. A., Lin, Z., Singh, P., Surdoval, W., Collin, D., A finite element analysis modeling tool for solid oxide fuel cell development: coupled electrochemistry, thermal and flow analysis in MARC, Journal of Power Sources, 130, (2004) Larminie, J.E. and Dicks, A.Fuel Cell Systems Explained, John Wiley and Sons, West Sussex (2003) Minh, N. and Takahashi, T. Science and Technology of Seramiz Fuel Cells, Elsevier Science, Netherland (1995) Mirahmadi, A., Valefi, K., Study of thermal effects on the performance of micro-tubular solid-oxide fuel cells, Ionics, 17, (2011) Ni, M., Leung, M.K.H., Leung, D.J.C., Parametric study of solid oxide fuel cell performance, Energy Conversion and Management, 48, (2007) Ni, M., Leung, D.J.C., Leung, M.K.H., Electrochemical modeling and parametric study of methane fed solid oxide fuel cells Energy Conversion and Management, 50, (2009) Patcharavorachot, Y., Arpornwichanop, A., Chuachuensuk, A, Electrochemical study of a planar solid oxide fuel cell: Role of support structures, Journal of Power Sources, (2008). Demircan, O., Zhang, W., Xu, C., Zondlo, J., Finklea, H.O., The effect of overpotential on performance degradation of the solid oxide fuel cell Ni/YSZ anode during exposure to syngas with phosphine contaminant, Journal of Power Sources, 195, (2010) Han, M. F., Liu, Z., Zheng, Z., Liu, M., High 502 Ranjbar, F., Chitsaz, A., Mahmoudi, S.M.S., Khalilarya, S., Rosen, M., Energy and exergy assessments of a novel trigeneration system based ona solid oxide fuel cell, Energy Conversion and Management 87, (2014) Singhal, S. C., Solid oxide fuel cells for stationary, mobile, and military applications, Solid State
58 Ionics, , (2002) Singhal, S.C. Kendall, K., High Temperature Solid Oxide Fuel Cells: Fundementals, Design and Applications, Elsevier Ltd, Oxford, (2004) Tanim, T., Bayless, D.J., Trembley, J. P., Modeling a 5 kwe planar solid oxide fuel cell based system operating on JP-8 fuel and a comparison with tubular cell based system for auxiliary and mobile power applications, Journal of Power Sources, 245, , 2014 Trendewicz, A.A. and Braun, R.J., Techno-economic analysis of solid oxide fuel cell-based combined heat and power systems for biogas utilization at wastewater treatment facilities, Journal of Power Sources, 233, , (2013) Verma, J.K., Verma, A., Ghoshal, A.K. Performance analysis of solid oxide fuel cell using reformed fuel International Journal of Hydrogen Energy, 38, , 2013 Wojciech M.B., Jaroslaw M., Solid-oxide fuel cells in power generation applications: a review. Recent Patents on Engineering, 5, (2011) Xu, H., Dang, Z., Bai B.F., N., Du, Y., Electrochemical performance study of solid oxide fuel cell using lattice Boltzmann method, Energy, 67, (2014) Xue, X., Tang, J., Sammes, N., Du, Y., Dynamic modeling of single tubular SOFC combining heat/mass transfer and electrochemical reaction effects, Journal of Power Sources, 142, (2005) Ye L., Jiao K., Du Q., and Yin Y. Exergy analysis of high-temperature proton Exchange membrane fuel cell systems. Int J Green Energy 12; 2015: Yonekura, T., Tachikawa, Y., Yoshizumi, T., Shiratori, Y., Ito, K., Sasaki, K., Exchange current density of solid oxide fuel cell electrodes, ECS Transactions, 35(1), (2011) Zheng, K., Li, L., Ni, M., Investigation of the electrochemical active thickness of solid oxide fuel cell anode International Journal of Hydrogen Energy, 39, (2014) 503

59 Multiphase Non-Isothermal Modeling of a Flowing Electrolyte - Direct Methanol Fuel Cell Faruk Atacan *, David Ouellette, Can Ozgur Colpan Department of Mechanical Engineering, Dokuz Eylul University, Buca, Izmir, Turkey, * [email protected] Abstract Methanol crossover is one of the biggest shortcomings for direct methanol fuel cells (DMFCs) due to fact that it causes degradation to the cathode catalyst layer.the flowing electrolyte direct methanol fuel cell (FE-DMFC) is a potential solution to this shortcoming, whereby the anode and cathode are separated by a flowing liquid electrolyte, such as diluted sulfuric acid. Any methanol that attempts to crossover is removed by the flowing electrolyte channel, thus protecting the cathode. Many researchers have modeled this fuel cell, however the majority of these studies have been single phase and examined the performance of the FE-DMFC under different operating conditions. Recently, a two-phase model of the FE-DMFC has been developed using a single-domain formulation of the multiphase mixture model (MMM). Due to the more realistic modeling predictions from this multiphase model, the single domain formulation will be extended to account for 2D and non-isothermal effects within the FE-DMFC. This proposed two-dimensional two phase, non-isothermal model is formulated and solved in a COMSOL Multiphysics environment and validated against experimental FE-DMFC data. The physics of this fuel cell are examined and discussed for varied inlet temperatures and flow rates of the anode, cathode and flowing electrolyte channel as well as varied set point temperatures (channel wall temperatures). A focus is placed on the energy and thermo-osmotic transport within the fuel cell and their effect on the fuel cell s performance. Keywords: DMFC, Comsol Multiphysics, non-isothermal, simulation, two phase I. Introduction The direct methanol fuel cell (DMFC) is an electrochemical device that produces electricity from methanol (the fuel) and an oxidant such as air. This fuel cell type is a promising candidate for portable applications due to the fact that its fuel is in the liquid state at room temperature, allowing for an energy dense and inexpensive fuel that can easily be stored (Colpan et al., 2008; Wang et al., 2008). Figure 1 displays a schematic of this fuel cell. In this diagram, it can be seen that this fuel cell is composed of several layers. From left to right, these layers include: the anode fuel channel (AFC), anode backing layer (ABL), anode catalyst layer (ACL), membrane (M), cathode catalyst layer (CCL), cathode backing layer (CBL) and cathode air channel (CAC). The operation principle of the DMFC is as follows: diluted methanol is supplied at the AFC inlet and is transported through the ABL (e.g. carbon cloth or carbon paper) to the ACL (e.g. Pt-Ru/C), where it reacts with the catalyst to produce electrons, protons and carbon dioxide, following the reaction shown in Equation 1. The protons conduct through the membrane (e.g. Nafion ) to the CCL, whereas the electrons conduct through the ABL, external load, CBL and reach the CCL (e.g. Pt/C). In the cathode, oxygen is supplied at the CAC inlet and is transported through the air channel and CBL (e.g. carbon cloth or carbon paper). The protons and electrons, which were supplied from the anode reaction, react with the supplied oxygen in the CCL, following the reaction shown in Equation 2. In addition to this reaction, unreacted methanol can cross through the membrane and react within the CCL, following the reaction shown in Equation 3. Figure 1. Schematic representation of the DMFC CH 3 OH + H 2 O CO 2 + 6H + + 6e (1) 1.5O 2 + 6H + + 6e 3H 2 O (2) CH 3 OH + 1.5O 2 CO H 2 O (3) One of the main shortcomings of the DMFC is the performance degradation caused by methanol crossover, which gives rise to a reduction in fuel cell s power density and electrical efficiency. To circumvent 504

60 this issue, Kordesch proposed the flowing electrolyte concept, whereby the anode and cathode are separated by a flowing liquid electrolyte, such as diluted sulfuric acid. A schematic of this fuel cell is shown in Figure 2, and this fuel cell is known as the flowing electrolyte direct methanol fuel cell, or FE- DMFC. This fuel cell design is intended to remove any methanol which attempts to crossover, thus potentially allowing this new fuel cell to perform like a DMFC without the effects of methanol crossover in the cathode (Kordesch et al., 2001). Various single phase studies and models have been developing about the FE-DMFC by researchers. Kjeang et al. (2005, 2006) studied the methanol crossover reduction in the flowing electrolyte channel with different operating parameters, through three dimensional (3D) modeling. Colpan et al. (2011, 2012) developed a 1D and 2D model of the FE-DMFC, to predict the performance of the fuel cell under different operating conditions and fuel, air, and FEC inlet velocities. Ouellette et al. (2015) extended Colpan s a one-dimensional FE- DMFC model to predict how the performance of the changes the inlet concentration of the FE, as well as the flow rate and thickness of the flowing electrolyte channel (FEC). The performance of a single cell FE- DMFC was experimentally studied and compared to a regular DMFC by Sabet-Sharghi et al. (2013). The flowing electrolyte layer was modelled, by Duivesteyn et al. (2013, 2013), as a porous domain in ANSYS CFX. General flow behaviour and the effects of volume flux, temperature, channel thickness, and porous material properties are investigated. Kablou et al. (2015) experimentally and numerically studied the stack level FE-DMFC. issue to consider in fuel cell design, as this affects the durability of the MEA as well as the transport of species and thus kinetics within the fuel cell (Djilali 2007; Siegel 2008; Wang et al. 2011). Although there are several published studies concerning nonisothermal two phase DMFCs, this type of analysis has not been conducted on the FE-DMFC. Therefore, to further understand the FE-DMFC s performance, Ouellette et al. s (2015) MMM model is extended to account for multidimensional and nonisothermal effects. A series of parametric studies were conducted with this new model to understand how the inlet temperatures of the anode and cathode affect the temperature distribution and species transport within the fuel cell. These findings are used to provide recommendations on operating procedures to enhance the fuel cell s performance. II. Numerical scheme In this model, the conservation equations (mass, momentum, chemical species, charge, and energy) and other auxiliary equations (e.g. Butler-Volmer equation) are coupled together and solved using COMSOL Multiphysics, which is a commercial software package based on finite element analysis. The main assumptions within this model are as follows. The fuel cell operates under steady state conditions. Methanol is fully consumed at the CCL-CBL interface. The inlet FEC velocity profile is uniform The BLs and CLs have the same porous properties. All fluids are ideal and exist in equilibrium. As can be seen below, mass (Eq. (4)), momentum (Eq. (5)), species (Eq. (6)), energy (Eq. (7)) and charge (Eqs. (8)) and (9)) are presented in concise form as follows:. k k k " k gen e gen trans CL.( u) ( M S ) ( M (. N ) S S (4) Figure 2. Schematic representation of the FE-DMFC Another key problem in DMFCs, is the two phase flow within the anode and cathode, and has been shown to be an important feature to include in fuel cells. There are two approaches that are extensively used in literature, the multi-fluid model (MFM) (Rice and Faghri 2006; Sun et al., 2005; Xu et al., 2008) and the multiphase mixture model (MMM) (Jung 2013; F. Liu and Wang 2007; W. Liu and Wang 2007; Z. H. Wang and Wang 2003). Ouellette et al. (2015a, 2015b) improved up the MMM approach by developing a new single domain FE-DMFC model. u T 2 u.. PI ( u ( u) (. u) I P P P P 1 Q br K F u (5) u F 2 P k k k k k trans DlgC i ulgc i Sgen S (6) gen T k ( T ) c ut S (7) eff T p, eff gen S, 0 l l c l (8) S, 0 s s c s (9) The thermal management is also another important 505
61 In order to find the mixture velocity (u) and pressure distribution, equations (4) and (5) are directly coupled together. This velocity is subsequently used to calculate the convective mode of transport within Eqs. (6) and (7). The concentration profile of each species (methanol, water, oxygen) is obtained from Eq. (6), where as the temperature profile is obtained from Eq. (7) and the current distributions are obtained from Eqs. (8) and (9). In this study, the temperature distribution is now accounted for. Therefore, the equilibrium phase concentrations now become sole functions of temperature, giving rise to a thermo-osmotic flux. In the case of the water species transport equation, Eq. (6), the mixture water concentration is tracked, and the thermo-osmotic flux is treated as a transport source term. The final form of the water transport equation is shown below. H2O H2O H2O H2O. Dlg C ulg C H2O T H2O i H2O Sgen. Dlg ( T ) end ) Sgen, eff F (10) The corresponding thermo-osmotic diffusion coefficient is shown below for the case where the electrolyte, gas and liquid phases all co-exist. dc D D D D H2O HO 2 H2O T H2O dcl H2O g H2O dce dwc lg l g e dt dt dwc dt HO HO 2 2 (1 ) K C C l g dpc v l g dt (11) For the methanol transport equation, the thermoosmotic flux can be treated as a convective term, as shown in Table 1. No changes are necessary for the oxygen concentration profile. The fuel cell geometry, the two-phase diffusion coefficient, D k lg, and velocity, u k lg, for each species, boundary contiditions used within model, electrochemical and transport properties, as well as source/sink terms of each species, k S gen, S T,, S cs, are shown in Table 1-7, respectively. S cl, The energy released or absorbed through phase change, is typically accounted for in the energy equation (Eq. (7)) through a source term, shown below. m h.( h u) (12) fg fg fg l conductivity. HO 2 d eff H2O H2 O dc sat dt d dt kgdl M Dg ( keff ) dx T T dx x (13) HO 2 H2O H2O dcsat k fg hfgm Dg T (14) II.1. Numerical procedure The conservation equations (Eqs. 4-9) are solved using COMSOL Multiphysics 5, which is based on finite element methods. In order to solve the equations of the, the following built-in modules were used: The Transport of Diluted Species in Porous Media interface to solve the oxygen, water and methanol concentration fields. The Secondary Current Distribution interface to solve the charge transport equations. The Free and Porous Media Flow interface to solve the Navier-Stokes and continuity equations. The Heat Transfer in Porous Media interface to define temperature field in fuel cell. In order to build mesh, the maximum element size was set to 10-6 m and the maximum element grow rate was set to 1.1. Grid independence was achieved with approximately elements. Due to the nonlinearity of the equations, the stationary nonlinear setting was used and each governing equation was solved sequentially each using a direct solver, specifically MUMPS (multifrontal massively parallel sparse direct solver). Table 1. Fuel cell geometry Parameter Value Units Cell Length m Active Area 2.5x10⁻³ m 2 Thickness ABL and CBL m AFC and CAC 1.5x10⁻³ m AM and CM m FEC m ACL and CCL 28x10-6 m Channel Dimensions Width 1.5x10⁻³ m Depth 1.5x10⁻³ m However, this form of the source term was found to cause the presented model to be unstable. Therefore, the phase change process is approximated as the phase change between gaseous and liquid water. This allows for the following form of the phase change process, which can be treated as an effective thermal 506
62 Table 2. Two phase diffusion coefficient and velocity Species D k lg u k lg Methanol D MeOH l D k MeOH g MeOH H D MeOH e Water HO 2 MeOH MeOH 1 s 1 1 nd i MeOH (1/ kh ) u s j MeOH l MeOH e D HO g T 2 kh l kh l Cl F T Oxygen O2 D O j 2 l g u(1 s) H2O H2O H2O H2O Dg D, eff C Cg, sat D D C C C H2O H2O H2O H2O Dl D, eff C Cl H2O H2O H2O H2O H2O cap, eff g, sat l g HO 2 u Table 3 Boundary conditions used within the model. Boundary condition Location Symbol Value Units Molar concentration MeoH O 2 AFC-ABL CBL-AC MeoH C FC, in MeoH C CCL CBL O C 2 FC, in x O P ac, in RT mol m -3 mol m -3 mol m -3 H 2O AFC-ABL CAC-CBL HO 2 C AFC ABL HO 2 C CAC CBL H2O H2O ( sacl ) ( sacg ) H2O H2O ( sccl ) ( sccg ) mol m -3 mol m -3 Temperature AFC Inlet CAC Inlet T T FEC Inlet T 80 C AFC and CAC Wall T 80 C C C Electrode potential phase FC-ABL s, FC ABL 0 V Inlet velocities ABL-AC s, CBL AC V cell V AFC Inlet u FC, in 6FC i A a ref MeOH FC, in Achannel m s -1 CAC Inlet u AC, in 4FC i c ref O2 FC, in A A channel m s -1 FEC Inlet u FEC, in Q w t FEC cell FEC m s -1 Outlet pressures Anode Cathode FEC Anode outlet Cathode outlet FEC outlet P a, out P c, out P FEC, out atm atm atm 507
63 Source/ Sink Terms MEOH S gen O S 2 gen 2 Sgen H O ABL ACL AM FEC CM CCL CBL 0 j 6F Table 4. Summary of source terms. Expression j 2 4F 6F 0 0 j 6F e, ACL n HO 2 d i F HO i nd HO i F nd 2 2 F HO i 2 nd F j xover j xover j 2 2F 6F e, CCL n HO 2 d i F 0 CO S 2 gen T S gen S trans 0 ( i ) 2 s s j 6F ( i ) 2 e e ( i ) 2 e e j xover 6F 2 2 ( ie) ( is) 2 2 ( ie) ( is) e s 2 e ( i s e ) TS jcc TSMOR e 4F jaa 6F TSMOR jxover 6F CLs MeOH H2O H2O H2O MeOH MeOH MeOH MeOH nd i MeOH D, eff M ( C ) De M ( Cl ) M. e MeOH Cl Cl F. H2O H2O H2O nd i H2O H2O H2O dce d wc M. e Cl M De.( T ) HO 2 Cl F dwc dt OOR 0 ( is ) s 2 Table 5. Electrochemical and transport properties used in modeling study Parameter Symbol Expression Units Proton conductivity AM and CM FEC AM CM FEC and wc 0.326exp 1268 T (-1.26x10 )T + ( )T Thermal conductivity Water liquid k phase liquid ( 1.118x10 ) T (8.388x10 ) T W m -1 K -1 Water gas 4 2 k phase gas ( 1.118x10 ) T (2.404x10 ) W m -1 K -1 Effective thermal conductivity k eff skl (1 s) kg (1 e) ks eke k fg W m -1 K -1 Heat capacitance Liquid phase of water C p,liq J kg -1 K -1 Gas phase of C water p,gas (-4.281x10 )T +(1.371x10 )T J kg -1 K -1 Electrolyte phase C p,mem 1090 J kg -1 K -1 Effective heat capacitance C p,eff scp, l (1 s) cp, g J kg -1 K -1 Table 6. Fuel cell dimensions and material properties used in modeling study Parameter Symbol Value Units Contact angle ABL and CBL θ c,abl ve θ c,cbl 110 degrees ACL and CCL θ c,acl ve θ c,ccl 110 degrees AM and CM θ c,am ve θ c,cm degrees FEC θ c,fec 110 degrees Thermal Conductivity AFC and CAC k AFC and k CAC 20 W m -1 K -1 ABL and CBL k ABL and k CBL 3 W m -1 K -1 ACL, CCL and FEC k ACL and k CCL 3 W m -1 K -1 AM and CM k AM and k CM 0.25 W m -1 K -1 S m -1 S m
 exp O2 c Cathodic Tafel expression C ref RT jc jxover t Anodic")
64 Table 7. Constitutive electrochemical equations. Constitutive equations Anodic Non-Tafel expression MeOH af ioa, ref C exp a RT ja MeOH af C Ka exp a * tacl RT O2 C cf ioc, ref (1 s) exp O2 c Cathodic Tafel expression C ref RT jc jxover t Anodic overpotential a s l E Eq a Eq Cathodic overpotential ( E ) c s l c MeOH af Crossover current density ioa, ref C exp c RT jxover MeOH af C K exp * t RT CCL a c ACL III. Results and discussions III.1. Baseline condition The methanol concentration, oxygen concentration, liquid saturation and temperature distributions are shown in Fig. 3, for a cell voltage of 0.4 V (i = A m -2 ) cell voltage. In Fig. 3a, the methanol concentration decreases along the length-wise (ydirection) and thickness-wise (x-direction) directions due to the increased consumption of methanol within ACL. In the ACL the production of protons gives rise to the electro-osmotic drag of methanol through the membrane. In the FEC, the methanol concentration significantly decreases due to the convective crossflow, reducing the crossover current density to negligible levels, with a maximum of ~400 A m -2 at 0.9 V. The oxygen distribution at a cell voltage of 0.4 V is shown in Fig. 3b. The concentration distribution is shown at the top, bottom and middle of the fuel cell is shown in Fig. 4, for a cell voltage of 0.9 V, 0.6 V, and 0.3 V. As can be seen in these figures, the oxygen concentration primarily decreases along the thickness-wise direction. Although the oxygen concentration also decreases in the length-wise direction, its decrease is very small in comparison to the thickness-wise decrease due to the much higher velocity in the length-wise direction, allowing for a low residence time within the CAC. The decrease in oxygen concentration within the CBL and CCL is primarily attributed to the higher mass transport resistance within these porous layers, in comparison to the CAC, as well as the consumption of oxygen within the CCL. However, the decrease in concentration in the thickness-wise direction is still quite small due to oxygen s high molecular diffusivity. figures, the liquid saturation profile within the anode and FEC are very high, ~0.9, and constant for the whole range of cell voltages. As the cell voltage descreases, the liquid saturation within the ACL decreases due to the consumption of methanol and water, and the production of carbon dioxide. At the lowest cell voltage, 0.3 V, the liquid saturation decreases to a value of 0.89 (a 1% decrease). The cathode also showed the same type of trend. However, in this case, the liquid saturation profile increased from a value of 0.1 to 0.11 at a cell voltage of 0.3 V. This increase in liquid saturation is due to the combination of water crossover from the FEC to the cathode and due to the generation of water from the ORR and MOR from any crossed over methanol. The liquid saturation within the FEC also, negligibly changes due to the lack of chemical reactions within this layer. (a) Methanol (b) Oxygen (c) Saturation (d)temperature Figure.3 Distrubution of methanol concentration (a), oxygen concentration (b), saturation (c) and temperature (d) at a cell voltage of 0.4 V (i = A m-2) at 80 C cell temperature. The liquid saturation distribution within the whole single cell is shown Fig. 3c and the distributions along the thickness-wise direction for the top, bottom and middle of the fuel cell at different cell voltages (0.3, 0.6 and 0.9 V) is shown in Fig. 5. As shown in both 509
 for the coldest temperature; see Fig. 7.")
65 III.2. Effect of Anode Inlet Temperature Figure 4. Concentration of oxygen at the bottom, mid, and top of the cell with different cell voltages. When the inlet temperature of the anode was varied from 20 C to 80 C in 20 C steps, it was found that there was a small thermal entrance length (~0.8 cm) for the coldest temperature; see Fig. 7. It was found that this was primarily due to the fact that for a given flow rate or stoichiometry, the velocity of methanol is rather low in comparison to air. This allowed for increased heat transfer from the remainder of the fuel cell to the AFC. Even for a flow velocity that is set 10 times higher than the base line value, the maximum cell temperature only decreased by 1 C. Figure 5. Liquid saturation distrubution of mid of the whole cell. The temperature distributions are shown in Fig. 3d and the distributions along the thickness-wise direction for the top, bottom and middle of the fuel cell at different cell voltages (0.3, 0.6 and 0.9 V) is shown in Fig. 6. As can be seen in these figures, the CCL is the warmest layer due to the heat generated by Ohmic heating as well as the electrochemical reactions. The highest temperature difference achieved within this fuel cell was ~3.5 C at a cell voltage of 0.3 V. The next warmest location was within the ACL, for the same reasoning; where the highest temperature difference was ~2.8 C at a cell voltage of 0.3 V. Although the FEC does cool the fuel cell, especially near the anode and cathode outlets, the fuel cell acts as a crossflow heat exchanger, where the warmest section of the fuel cell was found to be near the midpoint of the channel length. Figure 7. Temperature distribution of at the mid of the AFC along the length (y) direction at 0.3 V with different fuel temperature Near the anode entrance however, anode temperature caused the CCL to cool by ~3 C at a cell voltage of 0.9 V and ~0.5 C at cell voltage of 0.3 V, as shown in Fig. 8. This difference in temperature caused gaseous water to migrate to this colder zone, where it condensed. This process is known as the heat pipe effect. However, once the AFC thermally equilibrated itself with its surroundings, further along the channel, evaporation occurred within the CCL. This behavior suggests that local flooding within the CCL is possible if 20 C methanol is supplied while the fuel cell is set to operate at a temperature of 80 C. Figure 8. Temperature difference of the bottom of the cell at 0.3 V with different inlet AFC temperature. Figure 6. Temperature difference of the mid of the cell 510

66 III.3. Effect of Cathode Inlet Temperature When the cathode s inlet temperature is varied, it was found that unlike the anode, the airs thermal entrance length was much larger than that of the anode s. In the tested cases, the 40 C and 60 C inlet temperature cases did not reach the cell temperature by the cathode exit, due to the high cathode velocity. This can be seen in Fig. 9. Figure 9. Temperature distribution of at the mid of the CAC along the length (y) direction at 0.3 V with different air temperatures. When comparing the fuel cell s temperature distribution, when the cathode s inlet temperature is varied, it was found that this parameter influenced the overall temperature more significantly than that of the anode inlet temperature. This is primarily attributed to the air s low thermal conductivity and high velocity. This in turn resulted in a low residence time which would allow for less heat to be transferred to the fluid within the CAC. Furthermore, since the airs velocity and molecular diffusivity are both high, this allowed for a high degree of convective cooling to the rest of the fuel cell. This can be seen by the midplane temperature profile of the fuel cell in Fig. 10. Furthermore, it can be seen in this figure that at the lowest inlet CAC temperature, this caused the midplane temperature to be ~10 C lower than that of the set point temperature. This caused a flooding condition within the CAC, driven by the heat pipe effect. As such, it is recommended to maintain comparable inlet temperatures to those of the set point temperature of fuel cell, to prevent flooding within the cathode. Figure 10. Temperature difference of the bottom of the cell at 0.3 V with different inlet CAC temperatures. 511 IV. Conclusions A nonisothermal, multi-phase 2D model of a FE- MDFC has been developed to explain the interactions between two-phase transfer and phase change heat transfer. In order to develop this model, the commercial software, Comsol Multiphysics 5.0, was used to solve the governing conservation equations of momentum, mass, species, charge, and energy numerically. After then, the temperature, liquid saturation, concentration of the methanol and oxygen distribution were examined at baseline condition. As a parametric study, the effect of the following parameters were investigated. The temperatures at the anode and cathode inlet were changed to investigate the effect of the temperature distribution on the entire cell and to observe the heat pipe effect. As a result of conducted study, it was found that because of the velocity of the methanol is higher than that of oxygen, the heat transfer at the anode side is relatively higher than that of the cathode side. In addition, because of the temperature within the CAC was ~10 C lower than the set point temperature, the flooding condition took place within the CAC which was originated from heat pipe effect. Acknowledgements This project has received funding from the European Union s Horizon 2020 research and innovation programme under the Marie Sklodowska- Curie grant agreement No The second author thanks TUBITAK (The Scientific and Technological Research Council of Turkey) for their financial support through the research fellowship programme for international researchers (2216). Nomenclature P Pressure [N/m 2 ] T Temperature [K] C Concentration [mol/m 3 ] V Cell Voltage [V] k Thermal Conducvity [W/mK] M Moleculer Weight [kg/mol] C p Heat Capacitance [J/ kg K] u Velocity [m/s] ai o Reference exchange current density [A/m 3 ] i Current Density [A/m 2 ] j Volumetric Current Density [A/m 3 ] j xover Crossover Current Density [A/m 3 ] D Diffusion Coefficient [m 2 /s] h Enthalpy [kj/mol] K c Reaction Constant for Methanol Oxidation [mol/m 3 ] Qbr Source term n d Coefficient of Electro-osmotic Drag N Molar Flux [mol/m 2 s] N Volumetric Molar Flux, [mol/m 3 s] S trans Transport Source Term [mol/m 3 s] S u F Source term in continuity equation [N/m 3 ] Faraday sabiti [C/mol]
67 R Universal Gas Constant [J/molK] a Activity, unitless J Leverett J-Function, unitless k S gen Consumption/Generation Flux of Species k, [mol/m 3 s] s Liquid Saturation, unitless k H Henry's Constant, unitless j l Capillary Diffusion Flux of Liquid State [kg/m 2 s] Flowing Electrolyte Velocity [m/s] v FEC Greeks Letters α Transfer Coefficient ε Porosity ρ Density [kg/m 3 ] σ Conductivity [S/m] κ Permeability [m 2 ] η Overpotential [V] ϕ Potential [V] κ Electrical Conductance [S/m] θ c Contact Angle [ C] γ Advection correction factor Kinematic Viscosity [m 2 /s] Surface Tension [N/m 2 ] Abbreviations AFC Anode Fuel Channel ABL Anode Backing Layer ACL Anode Catalyst Layer AM Anode Membrane FEC Flowing Electrolyte Channel CM Cathode Membrane CCL Cathode Catalyst Layer CBL Cathode Backing Layer CAC Cathode Air Channel MOR Methanol Oxidation Reaction OCV Open Circuit Voltage OOR Oxygen Reduction Reaction MEA Membrane Electrode Assembly FE Flowing Electrolyte EOD Electro-osmotic Drag MMM Multiphase Mixture Model MFM Multi-Fluid Model Subscript/Superscript lg MeOH O2 H2O ref s e l g eff xover a c in out k Two-phase Condition Methanol Oxygen Water Reference Value Solid Phase Electrolyte Phase Liquid phase Gaseous/Vapour State Effective Value Crossover Anode Cathode Inlet Outlet Species 512 fg FC ABL ACL AM FEC CM CCL CBL AC channel References phase change Anode Fuel Channel Anode Backing Layer Anode Catalyst Layer Anode Membrane Flowing Electrolyte Channel Cathode Membrane Cathode Catalyst Layer Cathode Backing Layer Cathode Air Channel Channel Colpan C.O., Dincer I., Hamdullahpur F., Mini-Micro Fuel Cells: Fundamentals and Applications. ed. L. Kakaç, S., Pramuanjaroenkij, A., & Vasiliev. Springer Science & Business Media (2008). Wang, C.Y., Mini-Micro Fuel Cells: Fundamentals and Applications. ed. Kakaç, S., Pramuanjaroenkij, A. Springer Science & Business Media (2008). Kordesch K., Hacker V., and Bachhiesl U., Direct Methanol air Fuel Cells with Membranes plus Circulating Electrolyte, Journal of Power Sources 96(1): (2001). Kjeang, E. et al., Modeling Methanol Crossover by Diffusion and Electro-Osmosis in a Flowing Electrolyte Direct Methanol Fuel Cell, Fuel Cells 5(4): (2005). Kjeang, E. et al., A Parametric Study of Methanol Crossover in a Flowing Electrolyte-Direct Methanol Fuel Cell, Journal of Power Sources 153(1): (2006). Colpan C.O., Cruickshank C.A., Matida E., Hamdullahpur F., 1D Modeling of a Flowing Electrolyte-Direct Methanol Fuel Cell. Journal of Power Sources 196(7): (2011). Colpan C.O., Fung A, Hamdullahpur F., 2D Modeling of a Flowing-Electrolyte Direct Methanol Fuel Cell, Journal of Power Sources 209: (2012). Ouellette D., Colpan C.O., Cruickshank C.A., Matida E., A Comprehensive 1D Model of a Flowing Electrolyte-Direct Methanol Fuel Cell with Experimental Validation, International Journal of Energy Research 39(1): (2015) Sharghi S., Cruickshank C. A., Matida E., Hamdullahpur F., Performance Measurements of a Single Cell Flowing Electrolyte-Direct Methanol Fuel Cell (FE-DMFC), Journal of Power Sources 230: (2013). Duivesteyn E., Cruickshank C. A., Matida E., Modelling of a Porous Flowing Electrolyte Layer in a Flowing Electrolyte Direct-Methanol Fuel Cell, International Journal of Hydrogen Energy 38(30): (2013).
68 Duivesteyn E., Cruickshank C. A., Matida E., Nonisothermal Hydrodynamic Modeling of the Flowing Electrolyte Channel in a Flowing Electrolyte Direct Methanol Fuel Cell, Journal of Fuel Cell Science and Technology 11(2): (2013). Kablou Y., Cruickshank C. A., Matida E., Experimental Analysis of a Small-Scale Flowing Electrolyte Direct Methanol Fuel Cell Stack, Journal of Fuel Cell Science and Technology 12(4): (2015). Rice J., Faghri A., A Transient, Multi-Phase and Multi- Component Model of a New Passive DMFC, International Journal of Heat and Mass Transfer 49(25-26): (2006). Sun H., Liu H., Guo L.J., PEM Fuel Cell Performance and Its Two-Phase Mass Transport, Journal of Power Sources 143: (2005) Xu, C., Zhao T.S., Yang W.W., Modeling of Water Transport through the Membrane Electrode Assembly for Direct Methanol Fuel Cells, Journal of Power Sources 178(1): (2008). Jung S., Non-Isothermal Multi-Dimensional Direct Methanol Fuel Cell Model with Micro-Porous Layers Mitigating Water/methanol Crossover, Journal of Power Sources 231: (2013). Liu F., Wang C. Y., Mixed Potential in a Direct Methanol Fuel Cell, Journal of The Electrochemical Society 154(6): B514 (2007). Liu W., Wang C.Y., Three-Dimensional Simulations of Liquid Feed Direct Methanol Fuel Cells, Journal of The Electrochemical Society 154(3): B352 (2007). Ouellette D., Colpan C.O., Matida E., Cruickshank C.A., A single domain approach to modeling the multiphase flow within a flowing electrolyte direct methanol fuel cell, Int J Hydrogen Energy 40: (2015). Ouellette D., Colpan C.O., Cruickshank C.A., Matida E., Parametric studies on the membrane arrangement and porous properties of the flowing electrolyte channel in a flowing electrolyte direct methanol fuel cell, Int J Hydrogen Energy 2015;40: (2015). Djilali N., Computational Modelling of Polymer Electrolyte Membrane (PEM) Fuel Cells: Challenges and Opportunities, Energy 32(4): (2007). Siegel C., Review of Computational Heat and Mass Transfer Modeling in Polymer-Electrolyte-Membrane (PEM) Fuel Cells, Energy 33(9): (2008). Wang Z. H., Wang C. Y., Mathematical Modeling of Liquid-Feed Direct Methanol Fuel Cells, Journal of the Electrochemical Society 150(4): A508 (2003). 513
69 Multi-Inlet- Multi-Outlet Anode Flow Field Design for Micro Direct Methanol Fuel Cells Radwan M. El-Zoheiry 1*, Mahmoud Ahmed 1, Shinichi Ookawara 1,2 1 Department of Energy Recourses Engineering, Egypt-Japan University of Science and Technology (E-JUST), Egypt. 2 Tokyo Institute of Technology, Tokyo, Japan. * [email protected] Abstract The compact design of the micro-direct methanol fuel cell makes the flow field design and the utilization of the flow field surface area is of an important issue due to its relevance to the performance of the fuel cell. The in-plane methanol mass transfer should be high to decrease the effect of the mass transport of the under-rib diffusion layer from the channels to the electrodes. In addition, the overall Ohmic resistance of the fuel cell is directly proportional to the water content of the membrane which is decreased by operating the fuel cell at high temperature for an extended period. Therefore, the objective of the current work is to investigate the effect of the flow field design on the total pressure drop and the temperature distribution. Six different flow field designs such as parallel, multi parallel, serpentine, multi serpentine, double serpenitine, and multi double serpentine are numerically investigated in order to estimate the pressure drop and the temperature distributions. Results reveal that the dividing of the flow field into compartments with multi-inlet-multi-outlet significantly increases the pressure drop through the flow field and consequently, enhances the in-plane mass transfer through the diffusion. The multi-inlet-multi-outlet serpentine flow field design has the highest pressure drop and the double serpentine flow field design with multi-inlet-multi-outlet achieves the best temperature uniformity. Keywords: micro-direct methanol fuel cell anode, serpentine, parallel, double serpentine flow field, methanol - water solution, thermal resistance, temperature uniformity. I. Introduction The fast depletion of the fossil fuel resources, the continuous increase in the human energy demand, and the destructive environmental drawbacks of using the fossil fuels motivated the energy researchers to look for other sustainable and environment-friendly energy resources. The fuel cell represents one of the most appealing applications of the sustainable energy resources. The fuel cell can be fuelled by biofuels or the by-products of the biofuels. The Proton exchange membrane fuel cells (PEMFCs) fuelled by hydrogen which can be produced from cheaper and renewable resources. At the same time, the direct methanol fuel cells (DMFCs) fuelled by methanol which can be produced from the biomass through the production of synthesis gas. Furthermore, the fuel cell is characterized by low emission, high power density and efficiency, and minimization of the moving parts. Among the different types of the fuel cell, the DMFC can compete with the conventional batteries for the portable as a power supply of the portable devices. This is due to its operation under the normal conditions, fast refueling, and simple design as reported by Li et al. (2012). However, the increase in the fuel cell power density and the enhancement of the cell efficiency decrease the cell size and make it more applicable to the portable devices. In addition, the sluggish methanol oxidation at the anode, the methanol crossover and CO2 bubbles removal are destructive problems that are directly affect the DMFC performance as reported by Oliveira et al. (2009); Xu et al. (2010); Yang and Zhao (2007); Zhao et al. (2009); Wong et al. (2005); Wang et al. (2015); Yuan et al. (2013). Therefore, the anode flow field design should be given a great attention due to its great importance. The anode flow field in the DMFC works as a support for the fuel cell structure components. Also, it is the responsible for the methanol solution supply to the diffusion layer and consequently to the catalyst layer and works as a current collector as reported by Wong et al. (2006); Park et al. (2012); Zhao et al. (2009). The operation of the DMFC at high temperature for an extended period causes a dehydration of the membrane which consequently increases the fuel cell Ohmic resistance Wang et al. (2011). Therefore, the operating temperature is an important parameter which must be taken into account during the fuel cell design stage. Different configurations of the anodic flow field for the DMFC were investigated by many researchers such as Wang et al. (2011); Wong et al. (2006); Yang and Zhao (2005); Oliveira et al. (2010); Zhang et al. (2011); Park et al. (2012); Hyun et al. (2006); Xu et al. (2011); Hsieh et al. (2010); Wong et al. (2005); Liang et al. (2015); Ye et al. (2006); Schröder et al. (2013); Lu and Reddy (2011). Falcão et al. (2015) studied the performance of micro DMFC using a serpentine flow field while Wong et al. (2006) proved experimentally that the single serpentine flow field exhibits higher cell performance than the parallel flow field. Wang 514

70 investigated the cell performance using different configurations of the flow field including the single serpentine, double serpentine, parallel and helical flow field. Their results revealed that the double serpentine flow field provides the best performance for the same inlet velocity of the flow field. Zhang et al. (2011) tried to enhance the under rib methanol transportation by using a tapered serpentine flow field. They found that the tapered flow field improves the methanol transportation under the rib and CO2 removal and consequently exhibits a better cell performance. Oliveira et al. (2010) investigated the cell performance using the single serpentine, multi-serpentine and mixed parallel and serpentine flow field. Oliveira et al. (2010) results indicated that the use of mixed parallel and serpentine flow field argue a positive effect on the cell voltage and power. Park et al. (2012) studied the effect of the geometrical design parameters of the serpentine flow field on the cell performance. They realized that the cell performance was improved as the channel width and the channel/rib aspect ratio were reduced. According to the author knowledge, most of the previous researches investigated the flow field designs with single inlet and single outlet. It is expected that the use of multi-inlet multi-outlet flow field could has a better effect on the cell performance. A three-dimensional numerical model of the anode flow field is proposed to investigate the temperature distribution and the pressure drop of different multi-inlet multi-outlet anode flow field configurations. II. Configurations Description Six different configurations are selected to examine the concept of the multi-inlet multi-outlet anode flow field. The flow and temperature distribution in the parallel, serpentine and double serpentine are determined. After that, the simulated flow is divided into four compartments; each compartment has it's separately inlet and outlet. The new configurations are the multi-inlet multi-outlet parallel, serpentine and double serpentine flow field as shown in Fig. 1. The single inlet single outlet parallel (P), serpentine (S) and double serpentine (DS) are shown in Fig. 1 (a), (c), and (d) respectively. Also the multi-parallel (MP), multi-serpentine (MS), and multi double serpentine (MDS) are represented in Fig. 1(b), (e), (f) respectively. The simulations for all configurations are conducted at the same inlet mass flow rate and temperature. All the parameters that used in the simulation are shown in Tab. 1. III. Evaluation Techniques In addition to the overall fuel cell performance, the cooling performance and pressure drop are widely used in the evaluation of the flow field as reported by Wang et al. (2011); Park et al. (2012); Zhang et al. (2011); Ramos-Alvarado et al. (2011); Leng et al. (2015). The average surface temperature (Ts, av), the surface temperature uniformity (Ts, un), thermal resistance (R) and ΔP are the parameters that are 515 used to evaluate the flow field design and can be defined as follows: a b Inlet c d Inlet e f Inlet Inlet Outlet Outlet Inlet Inlet Outlet Outlet Outlet Outlet Outlet Outlet Outlet Inlet Inlet Inlet Fig. 1 Schematic sketch of the investigated different flow field designs.
71 Tab. 1: Simulation Parameters Wang et al. (2011) Parameter Value Inlet temperature, T in K Outlet pressure, P ex 1 atm Volume flow rate range, V to m 3.s -1 with step Heat flux, q 500 W m -2 Conventional heat transtfer 10 W m -2 K -1 coefficient, h Flow field dimentinons for 12mm 12mm 1mm single inlet single outlet Flow field dimentinons for 12mm 12mm 0.25mm multi inlet multi outlet Channel width 0.7 mm Channel depth 1 mm for single inlet single outlet configurations 0.25 mm for multi inlet multi outlet configurations Methanol concentrations 2 M Density of silicon 2330 kg m -3 Density of methanol solution kg m -3 Specific heat of silicon 703 J kg -1 K -1 Thermal conductivity of silicon 149 W m -1 K -1 Thermal conductivity of W m -1 K -1 methanol solution Viscosity of methanol solution Pa S The average temperature over the interface surface between the flow field and diffusion layer can be calculated according to Eq. (1). T da, (1) A T s av How much the temperature over the flow field surface is uniform can be investigated by utilizing the surface temperature uniformity as in Eq. (2) ANSYS (2015); Tsinoglou et al. (2004). T n T T i s, av i i1 s, un 1 (2) 2Ts, av Ai A Where Ti and Ai are the local cell temperature and area respectively. The value of the temperature uniformity varies from 0, for the worest uniformity, to one, for the best uniformity. Another important parameter that is commonly used for the temperature distribution of the flow fields is the thermal resistance (R). This parameter enables the monitoring of the low value of the average temperature of the flow field surface per unit heat flux; it can be calculated as shown in Eq. (3) as reported by Ramos-Alvarado et al. (2011); Leng et al. (2015). R T T s, av in (3) q" The better, the heat transfer, the lower the average surface temperature and thermal resistance lower are as documented by Ramos-Alvarado et al. (2011); Leng et al. (2015). The last parameter used in the flow field design optimization is the pressure difference between any adjacent channels. This 516 parameter is directly proportional to the total pressure drop across the flow field as mentioned by Zhang et al. (2011); Yang and Liang (2009); Shi and Wang (2008). The increase of the pressure difference between the adjacent channels improves the convection and diffusion transport efficiency of methanol and reduce the mass transport shadow region under the rib. Therefore, the higher is the total pressure drop across the flow field; the better is the methanol transport efficiency. IV. Computational Model The slenderness of the DMFC model resulted in a considerable reduction in the mathematical formulation and computational time. Most of the proposed models for the DMFC are one or two-dimensional models. However, the effect of the flow field design cannot be traced without a three-dimensional model. Consequently, for the preliminary flow field design and configuration optimization process, a three-dimensional single phase model of the flow field could be enough. Accordingly a three-dimensional single-phase steady state model is used in the current work to evaluate of the effect flow field design on pressure and temperature distributions. Therefore, the commercial CFD software ANSYS FLUENT 16.2 is used for the proposed simulation. IV. 1. Assumptions and governing equations: Firstly the used assumptions can be summarized as following: 1. The flow is single phase, incompressible, laminar and steady state. 2. The physical properties of the silicon and methanol solution are considered constant especially for quite heat flux value. 3. The gravitational force effect is neglected. 4. The phase change and thermodynamic effects are not considered. Accordingly, the conservation of mass, momentum and energy equations considered are represented hereinafter. The governing Equation in tensor notation can be written as follows: u a. The mass conservation equation x j j 0 (4) Whwere uj represents the velocity in the j th coordinate. b. The momentum conservation equation u i P ui mu j m (5) x j xi x j x j m, and m represent the pressure,
72 methanol density and dynamic viscosity respectively c. The energy conservation equation of the methanol solution 2 u jt T mcp, m k (6) m 2 x x j j Cp,m and km are the methanol solution constant specific heat and thermal conductivity respectively. k d. The energy conservation equation for the solid ribs si 2 T x 2 j 0 Where ksi is the silicon ribs thermal conductivity. IV. 2. Boundary Conditions (7) The above-mentioned governing equations are solved numerically in the different flow fields for the same inlet mass flow rate. Accordingly, the inlet flow velocity is adopted according to the inlet flow area to maintain the same mass flow rate. Furthermore, the inlet velocity is assumed to be uniform over the inlet section. The inlet temperature is assumed to be 25 C while a constant heat flux is applied at the flow field-diffusion layer interface. This heat is continuously generated in the DMFC due to the electrochemical reactions at the anode and cathode catalyst layers. A typical value of the heat flux is 500 W m -2 as reported by Wang et al. (2011). For the free convection heat transfer at the outer surface of the flow field, a 10 W m -2 K -1 convection heat transfer coefficient is considered. Inside the flow field channels, no-slip conditions are applied at the methanol solution-wall interface. The applied boundary conditions are as follows: 1. The inlet boundary conditions u=uin,, v=w=0, Tin = 25 C (8) 2. The oulet boundary conditions ui x i T 0, 0 x 3. At the outer surfaces T k x i h( T T ) w (9) (10) 4. At the flow field and diffusion layer interface 2 u i 0 and q" const 500W m (11) 5. At the fluid and channel walls interface u 0 (12) i V. Mesh independence test For the different configurations, the convergence numerical solution is evaluated according to the error associated in the ΔP and Tsav with changing the mesh size. The values of these parameters at different mesh size for the multi parallel configurations are presented in Table 2. Table 2. Details of multi parallel mesh independence test, (q"=500 W m -2, V = ) Sn. No. of cells ΔP, Pa T sav, C , , , ,959, As shown in Table 2, the surface temperature almost independent of the number of grids and the pressure drop is more sensitive. Therefore, the selection of the appropriate mesh is mainly based on the pressure difference value. The results represented in Table 2 revealed that the error resulted from using mesh number of 974,048 instead of mesh number 1,959,668 resulted in 2% error in the pressure drop. The similar tests were performed for the other configurations that lead to the average number of the grids for different configurations of 970,000. The solution is considered converged as the maximum normalized mass conservation residual of all the grids reaches At the same time, the maximum normalized errors in the three components of the velocity and temperature are set to be10-6. These values of convergence criteria are recommended by different researchers such as Ramos-Alvarado et al. (2011); Wang et al. (2011). VI. Model Validation The numerical model and solution procedures are validated by comparing the pressure drop, the top surface average and maximum temperature for the parallel, serpentine and double serpentine flow field with the results obtained by Wang et al. (2011). The comparison of the pressure drop across the parallel, serpentine and double serpentine flow field shows a good agreement between the present simulation and that obtained by Wang et al. (2011) as shown in Tab. 3. Tab. 3 Pressure drop validation data, at inlet velocity of 0.01 m/s Configuration ΔP, (Pa) ΔP, (Pa) % Error Wang et Present al. (2011) work Parallel Serpentine Double serpentine
73 Average surface temperature, T s,av, ( o C) Inlet Velocity (m/s) Parallel_ Wang et al Serpentine_ Wang et al Double Serpentine_Wang et al Parallel_Predicted Serpentine_Predicted Douple Serpentine_Predicted Fig. 2 Comparison between the predicted value of the top surface average temperature and that obtained by Wang et al. (2011) at various inlet velocities mass flow rate (24.72 g/hr). It can be observed from these contours that the multi-inlet multi-outlet configurations have higher pressure drop than that of single inlet, and single outlet. a b c d Maximum surface temperature, T s,max, ( o C) Inlet Velocity (m/s) Parallel_ Wang et al Serpentine_ Wang et al Double Serpentine_Wang et al Parallel_Predicted Serpentine_Predicted Douple Serpentine_Predicted Fig. 3 Comparison between the predicted value of the top surface maximum temperature and that obtained by Wang et al. (2011) at various inlet velocities e Fig. 4. Methanol solution pressure contours, (a) parallel, (b) multi parallel, (c) serpentine, (d) multi serpentine, (e) douple serpentine and (f) multi-double serpentine. f A comparison between the predicted top surface average and maximum temperature for the parallel, serpentine and double serpentine flow field and that obtained by Wang et al. (2011) are presented in Fig. 2 and 3 respectively. As shown in these figures the predicted results have a good agreement with the results obtained by Wang et al. (2011). VII. Results and discussions A three-dimensional simulation of the flow and heat transfer characteristics is conducted for six different DMFC anode flow field configurations as shown in Fig. 1. The simulations are conducted at different values of the inlet mass flow rate as shown in Tab. 1. In this section, the results of the simulation are presented and discussed to demonstrate the effect of different configuration design on the flow field temperature and pressure drop. VII.1. The Pressure Drop Fig. 4 shows colour contours of the pressure distribution in the flow field channels for different configurations at the maximum value of the used 518 Fig. 5. Pressure drop at different solution mass flow rate. Fig. 5 presented detailed discussion of the flow field design effect on the pressure drop. According to the Darcy-Weisbach relation, as mentioned by Park et al. (2012), the pressure drop is a function of the fluid viscosity, density, hydraulic diameter and flow
74 velocity as shown in Eq.13. The flow velocity increases linearly with the mass flow rate, accordingly the pressure drop increases linearly as shown in Fig L P f (13) D h 2 The parallel (P) and multi-parallel (MP) have the smallest flow path length. Consequently, they have the lowest pressure drop. In the case of double serpentine (DS) and multi-double serpentine (MDS), the flow velocity is smaller than that for the serpentine (S) and multi-serpentine (MS) as the same flow is divided into two paths. In addition, the flow path is smaller in case of DS compared with that in the MDS as compared with the MS. Accordingly, the pressure drop in the DS and MDS are lower than that of the S and MS. The MS and S have the same flow velocity, but the MS has a flow path length of about 65% of the S flow field. However, the MS has a high pressure drop due to a smaller hydraulic diameter since the pressure drop is reciprocally proportional to the square of the hydraulic diameter. Due to the mass transport in shadow region of the under rib diffusion layer from the channel to the electrode, the methanol transport efficiency is low in these areas. At the same time, the pressure difference between the adjacent channels around the rib controls the convection and diffusion of the methanol in these regions. Such pressure difference between the adjacent flow channels is proportional to the total pressure drop through the flow field as reported by Zhang et al. (2011). Accordingly, it is realized that the MS design which has the highest pressure drop among the different configurations, has the best methanol mass transport efficiency through the DL which enhances the fuel cell efficiency. This result has a good agreement with that obtained by Zhang et al. (2011). As they designed a tapered serpentine flow field and compared it with that of the conventional serpentine flow field. The tapered flow field which gave the higher pressure drop results in a high cell efficiency and power density. Furthermore, the MS design has shorter path length than that of S design while the flow velocity is the same in both of them. Accordingly, the resident time for the CO2 bubbles and the probability of having the CO2 slug flow through the flow field channels are reduced by using the MS flow field. This could reduce the methanol concentration polarization problem at the anode catalyst layer and enhance the cell performance, especially at high current density operation conditions. VII.2. The surface temperature To gain a deeper insight of the transportation mechanism of the hydrogen ions through the polymer electrolyte membrane of the fuel cell, it is found that 519 the hydrogen ions H + are transported through the hydrated regions of the membrane. In these regions, the H + ions move via the Grotthuss mechanisms, as mentioned by Sandhu et al. (2005), where it is weakly attracted with the SO - 3 groups in the side chains of the Nafion membranes as reported by Sandhu et al. (2005). A water-methanol region exists inside the Nafion membranes structure between the perfluorinated hydrocarbon backbone and the side chains which ended with fixed sulfonic groups as mentioned by Haubold et al. (2001); Sandhu et al. (2005). According to the Grotthuss mechanism, the ions is transported through the water-methanol region by the water molecules bonds rearrangement as documented by Atkins and De Paula (2006). H + Therefore, the H + ions transportation and conductivity is directly proportional to the water content of the membrane as reported by Schultz (2004). The operation of the DMFC at high temperature for an extended period results in a dehydration of the membrane which reduces the proton conductivity and increases the fuel cell Ohmic resistance as mentioned by Wang et al. (2011). Moreover, the membrane methanol permeability increases with the increase of the operating temperature as reported by Ahmed and Dincer (2011). Consequently, the methanol crossover could be increased as the operating temperature is increased. The continuously electrochemical reaction at the catalyst layers resulted in ceaselessly heat generation inside the fuel cell which leads to raise the cell temperature. Therefore, cooling of the flow field is an important parameter and should be taken into account during the design process of the cell flow field. Fig. 6 shows the surface temperature distribution of the flow field at a mass flow rate of g/hr. As shown in this figure, the concept of multi-inlet multi-outlet enhances the temperature distribution and reduce the regions of high temperature especially in the case of P and MP configurations. To further clarify the cooling performance of different flow field configurations, the average and maximum temperature, temperature uniformity over the flow field surface and the thermal resistance are presented in the following figures. It is found that the increase of the flow velocity due to an increase of inlet mass flow rate significantly enhances the convection heat transfer inside the flow field channels. Accordingly, a reduction of the average surface temperature is attained as shown in Fig. 7. Also, the maximum surface temperature is attenuated while the surface temperature uniformity is increased and the thermal resistance is reduced as shown in Fig respectively. In addition, the differences in cooling performance for the investigated configurations decay at the higher values of the mass flow rate as shown in those figures. In serpentine flow field, the residence time of fluid under the source of heat increases which enables it to absorb more amount from the generated heat.
75 Accordingly, the average and maximum surface temperature in the case of serpentine flow field are the lowest value as shown Fig. 7 and 8 respectively. Although the surface temperature uniformity is not the best in the case of the S flow field design; it is comparable with that of the MDS design, where it provides the best temperature uniformity as shown in Fig. 9. However, the average surface temperature of the MDS design is higher than that of the S flow field design where it provides the lowest average surface temperature. a b rate, it exceeds that obtained from all configurations except the MDS which provides the highest surface temperature uniformity. In the applications of using the flow field for cooling, the thermal resistance is the main parameter used in the temperature distribution evaluation. The better temperature distribution to achive the lower value of the thermal resistance. Accordingly, as shown in Fig. 10, the S flow field design is considered the best from this view. However, the MS, DS, MDS, and MP provide a comparable lower value of the thermal resistance especially at the high values of the mass flow rate where the convection heat transfer is enhanced. As shown in Fig. 10, the P flow field resulted in the highest value of the thermal resistance at different values of the inlet mass flow rates. c d e f Fig. 6 Surface temperature (K) distribution at inlet mass flow rate of g/hr respectively, (a) P, (b)mp, (c)s, (d)ms, (e)ds, and (f) MDS flow field designs. Fig. 7 Average surface temperature at different values of methanol solution mass flow rate The average and maximum surface temperature of the MS flow field design are close to that obtained from the S as shown in Fig. 7 and 8. Moreover, the surface temperature uniformity produced from the MS flow field is less than that of the MDS as shown in Fig. 9. Therefore, the MS flow field produces an acceptable compromising between the temperature uniformity and the temperature of the hottest regions on the surface. It can be observed from Fig. 7-9 that the concept of multi-inlet multi-outlet enhance the cooling performance compared with the single-inlet single-outlet flow fields especially using the parallel configuration. As shown in Fig. 7 and 8, the average and maximum surface temperature obtained from the MP flow field are lower than that obtained from the P and become closer and comparable with the other configurations. On the other hand, the results showed Fig. 9 emphasize on the surface temperature uniformity obtained from the MP better than that P and S flow field design. At a high rate of mass flow 520 Fig. 8 Maximum surface temperature at different values of methanol solution mass flow rate.
76 A preliminary design of the anode flow field for the DMFC is performed using a three-dimensional single phase model. The flow characteristics, pressure drop and temperature distribution of six different flow field configurations; P, MP, S, MS, DS, and MDS are investigated. The results of the simulation revealed that the concept of multi-inlet multi-outlet increases the pressure difference between the adjacent channels as the pressure drop through the flow field is increased. The temperature distribution is also enhanced due to the reduction of the average and maximum temperatures and the increased of the temperature uniformity. For the applications of the DMFC, the MS flow field could produce the best performance as it has the higher pressure drop and comparable temperature distribution among the different configurations. Fig. 9 Surface temperature uniformity index at different values of methanol solution mass flow rate. Fig. 10 Thermal resistance through the flow field at different values of methanol solution mass flow rate. VIII. Conclusion The anode flow field should exhibit a good distribution of the species over the diffusion layer surface in addition to the support of the diffusion layer in-plane mass transfer. The mass transfer issue can be enhanced by utilizing of the pressure difference between the flow channels. Therefore, the effect of the flow field configuration on the pressure drop is examined as it directly affects the adjacent channels pressure difference. Moreover, the anode flow field should take this responsibility of the fuel cell temperature control. Accordingly the temperature distribution of the anode flow field is an important issue that cannot be neglected during the design stage of the flow field due to direct effect on membrane water content and consequently overall cell Ohmic resistance. Acknowledgements The author would like to thank the Egyptian government especially Ministry of Higher Education (MoHE). We also would like to express our gratitude to Egypt-Japan University of Science and Technology (E-JUST) for offering the facilities and tools. Nomenclature A : Area (m 2 ) Cp : Specific heat (J.kg -1.K -1 ) D : Diameter (m) k : Thermal conductivity (W.m -1.K -1 ) m : mass flow rate (kg.s -1 ) q : Heat flux (W.m -2 ) R : Thermal resistance (K m 2.W -1 ) T : Temperature (K) Ts, un : Surface temperature uniformity index (*) u : Flow velocity (m.s -1 ) U : Upstream uniform velocity (m.s -1 ) V : Volume flow rate (m3.s -1 ) ΔP : pressure drop (N.m -2 ) Abbreviations DS : Double serpentine flow field MDS : Multi double serpentine flow field MP : Multi-parallel flow field MS : Multi-serpentine flow field P : Parallel flow field S : Serpentine flow field Greek letters : density (kg.m -3 ) : Dynamic viscosity (Pa.s) : Kinematic viscosity (m 2.s -1 ) Subscripts : free stream av : Average h : hydraulic i : Index for coordinate : Index for the local computational cell max : Maximum S : surface un : Uniformity W : Wall 521
77 References Ahmed, M. & Dincer, I., A review on methanol crossover in direct methanol fuel cells: challenges and achievements. International Journal of Energy Research, 35(14), pp ANSYS, ANSYS Fluent Theory Guide., 15317(July), p.80. Atkins, P. & De Paula, J., PHYSICAL CHEMISTRY, Falcão, D.S. et al., Experimental and modeling studies of a micro direct methanol fuel cell. Renewable Energy, 74, pp Haubold, H.G. et al., Nano structure of NAFION: A SAXS study. Electrochimica Acta, 46(10-11), pp Hsieh, S.-S., Wu, H.-C. & Her, B.-S., A novel design for a flow field configuration, of a direct methanol fuel cell. Journal of Power Sources, 195(10), pp Hyun, M. et al., Prediction of anode performances of direct methanol fuel cells with different flow-field design using computational simulation. Journal of Power Sources, 157(2), pp designs with different channel and rib widths on the performance of a direct methanol fuel cell. Journal of Power Sources, 205, pp Ramos-Alvarado, B. et al., CFD study of liquid-cooled heat sinks with microchannel flow field configurations for electronics, fuel cells, and concentrated solar cells. Applied Thermal Engineering, 31(14-15), pp Sandhu, S.S., Crowther, R.O. & Fellner, J.P., Prediction of methanol and water fluxes through a direct methanol fuel cell polymer electrolyte membrane. Electrochimica Acta, 50, pp Schröder, A. et al., In-plane neutron radiography for studying the influence of surface treatment and design of cathode flow fields in direct methanol fuel cells. International Journal of Hydrogen Energy, 38(5), pp Schultz, T., Experimental and Model-based Analysis of the Steady-state and Dynamic Operating Behaviour of the Direct Methanol Fuel Cell ( DMFC ). Shi, Z. & Wang, X., A numerical study of flow crossover between adjacent flow channels in a proton exchange membrane fuel cell with serpentine flow field. Journal of Power Sources, 185(2), pp Leng, C. et al., Multi-parameter optimization of flow and heat transfer for a novel double-layered microchannel heat sink. International Journal of Heat and Mass Transfer, 84, pp Li, X. et al., Effect of anode micro-porous layer on species crossover through the membrane of the liquid-feed direct methanol fuel cells. Applied Thermal Engineering, 48, pp Liang, J. et al., Novel Flow Field with Superhydrophobic Gas Channels Prepared by One-step Solvent-induced Crystallization for Micro Direct Methanol Fuel Cell. Nano-Micro Letters, 7, pp Lu, Y. & Reddy, R.G., Effect of flow fields on the performance of micro-direct methanol fuel cells. International Journal of Hydrogen Energy, 36(1), pp Oliveira, V.B., Rangel, C.M. & Pinto, A.M.F.R., Effect of anode and cathode flow field design on the performance of a direct methanol fuel cell. Chemical Engineering Journal, 157(1), pp Oliveira, V.B., Rangel, C.M. & Pinto, A.M.F.R., Modelling and experimental studies on a direct methanol fuel cell working under low methanol crossover and high methanol concentrations. International Journal of Hydrogen Energy, 34(15), pp Park, Y.C. et al., Effects of serpentine flow-field 522 Tsinoglou, D.N. et al., Transient modelling of flow distribution in automotive catalytic converters. Applied Mathematical Modelling, 28(9), pp Wang, Q. et al., Investigation of Methanol Crossover and Water Flux in an Air- Breathing Direct Methanol Fuel Cell., 10, pp Wang, S.-J. et al., Computational simulation and experimental evaluation on anodic flow field structures of micro direct methanol fuel cells. Applied Thermal Engineering, 31(14-15), pp Wong, C.W. et al., Experimental investigations of the anode flow field of a micro direct methanol fuel cell. Journal of Power Sources, 155(2), pp Wong, C.W. et al., Transient Capillary Blocking in the Flow Field of a Micro-DMFC and Its Effect on Cell Performance. Journal of The Electrochemical Society, 152(8), p.a1600. Xu, C. et al., Methanol and water crossover in a passive liquid-feed direct methanol fuel cell. International Journal of Hydrogen Energy, 35(4), pp Xu, Q. et al., A flow field enabling operating direct methanol fuel cells with highly concentrated methanol. International Journal of Hydrogen Energy, 36(1), pp Yang, H. & Zhao, T.S., Effect of anode flow field design on the performance of liquid feed direct
78 methanol fuel cells. Electrochimica Acta, 50(16-17), pp Yang, W.W. & Zhao, T.S., Two-phase, mass-transport model for direct methanol fuel cells with effect of non-equilibrium evaporation and condensation. Journal of Power Sources, 174(1), pp Yang, Y. & Liang, Y.C., Modelling and analysis of a direct methanol fuel cell with under-rib mass transport and two-phase flow at the anode. Journal of Power Sources, 194(2), pp Ye, Q., Zhao, T.S. & Xu, C., The role of under-rib convection in mass transport of methanol through the serpentine flow field and its neighboring porous layer in a DMFC. Electrochimica Acta, 51(25), pp Yuan, Z. et al., Investigation of corner effect on micro-scale flow of l DMFC. Microelectronic Engineering, 111, pp Zhang, Y. et al., A tapered serpentine flow field for the anode of micro direct methanol fuel cells. Journal of Power Sources, 196(6), pp Zhao, T.S. et al., Mass transport phenomena in direct methanol fuel cells. Progress in Energy and Combustion Science, 35(3), pp
79 Synthesizing and Testing of Nafion/SiO2 and Nafion/TiO2 Composite Membranes for the DMFC Applications Mustafa Ercelik 1*, Adnan Ozden 2, Yilser Devrim 3, Can Ozgur Colpan 2 1 Dokuz Eylul University, The Graduate School of Natural and Applied Sciences, Mechanical Engineering Department, Tinaztepe Campus, 35397, Buca, Izmir, Turkey 2 Dokuz Eylul University, Faculty of Engineering, Mechanical Engineering Department, Tinaztepe, Buca, Izmir, 35397, Turkey 3 Atilim University, Department of Energy System Engineering, Incek, Ankara, 06830, Turkey * [email protected] Abstract In the Direct Methanol Fuel Cells (DMFCs), the types and properties of the membranes directly affect the performance of the cells. Nafion is commonly used as the membrane in DMFCs due to its chemical and thermal stability, and very high proton conductivity in the soaked state. In spite of all these advantages of Nafion, it dehydrates when the operating temperature gets higher than 80 C; therefore the fuel cell performance decreases significantly. In high temperature PEMFCs, Nafion/SiO2 and Nafion/TiO2 composite membranes have been proven to be effective to overcome this problem. These membranes also have better proton conductivity as compared to pure Nafion at high temperatures. In this study, Nafion/SiO2 and Nafion/TiO2 composite membranes were synthesized and in-house performance tests were conducted to compare DMFCs having these membranes with a DMFC having a commercial Nafion membrane. For this purpose, firstly, Nafion/SiO2 and Nafion/TiO2 composite membranes were prepared by solvent casting method with the inorganic particule loading of 2.5 wt%. The structure of the Nafion composite membranes were then investigated by Scanning Electron Microscopy (SEM), X-Ray Diffraction (XRD) and thermogravimetric analysis (TGA). Secondly, membrane electrode assemblies (MEA) were fabricated using ultrasonic coating technique. Finally, the performance of the synthesized Nafion composite membranes as well as a commercial Nafion 115 membrane were tested using a a single cell DMFC test station at three different temperatures 60 C, 80 C and 95 C. The results demonstrate that maximum power of MEA which was fabricated by using Nafion/TiO2 is almost 1.36 times higher than that of the MEA with commercial Nafion 115 at 95 C. In addition, the maximum power value which was received from the MEA with Nafion/SiO2 is 1.26 times higher than that of the MEA with commercial Nafion 115 at 95 C. Therefore, the results of this study show that Nafion/TiO2 and Nafion/SiO2 composite membranes are very promising for DMFC applications. Keywords: Direct methanol fuel cell, membrane synthesis, membrane electrode assembly, Nafion/SiO2 membrane, Nafion/TiO2 membrane I. Introduction Fuel cell technology in one of the emerging technologies that could be used in a wide range of applications from portable power (e.g. laptop) to stationary power and heat generation (Mueller and Peter, 1998; Schonert et al., 2004; and Zhang et al., 2006). Among the different types of fuel cells, Proton Exchange Membrane Fuel Cell (PEMFC), which mainly uses hydrogen as the fuel, is the most popular fuel cell type. However, there are many challenges associated with fuel storage, delivery and safety. DMFC, which uses liquid methanol solution as the fuel, is often considered a sub-category of the PEMFCs. The advantages of DMFC can be listed as follows: (i) high energy density of fuel, (ii) easy storage as methanol is in liquid phase, (iii) no reformer is required as methanol can be directly fed, (iv) low emissions, and (v) safer fuel storage. In the light of these advantages, many researchers have conducted studies to contribute the development of DMFCs, especially to increase their performance (Chang et al., 2002; Chen et al., 2005; Hobson et al., 2002; Kamarudin and Hashin, 2012; Wei et al., 2002; Glüsen et al., 2010; Hacquard et al., 2005; and Lindermeir et al., 2004). In most of the DMFC applications, it is common to use Perfluorosulfononic acid type membrane, also known as Nafion (by DuPont). Nafion has been traditionally used as the membrane because of its high proton conductivity, flexibility, and excellent chemical and mechanical stability in the soaked state (Salarizadeh et al., 2013 and Yuan et al., 2014). Although Nafion has the above mentioned advantages, it has some disadvantages that cause a reduction in the performance of the cell. The most conspicuous disadvantages of these membranes for DMFC applications are high methanol permeability and low proton conductivity at high temperatures (>80 C) (Devrim et al., 2012; Xu et al., 2015; and Ye et al., 2007). At high temperatures Nafion membrane also dehydrates and thus deteriorates the cell performance. Therefore, in the recent years, researchers have focused on the development of composite fuel cell membranes that can be used effectively at temperatures higher than 80 C (e.g. Baglio et al., 2004; Devrim, 2014; Kim et al., 2004; and Vaivars et al., 2004). It has been shown that bare 524

80 Nafion membranes give lower proton diffusion coefficient than the composite membranes under dry conditions (Eroglu, 2009 and Ye et al., 2007). The literature study conducted shows that Nafion/SiO2 and Nafion/TiO2 composite membranes, which can be used at relatively high temperatures, has been mainly used for PEMFCs. However, their usage on DMFCs has not been tested according to the author's knowledge. On the other hand, the studies on DMFCs at elevated temperatures are very limited. It has been shown in the literature that DMFC performance can be improved due to increases in the methanol oxidation reaction and oxygen reduction reaction kinetics (Baglio et al., 2006). For this reason, in this study, DMFCs based on these membranes have been manufactured and tested at three different temperature levels: low (60 C), medium (80 C), and high (95 C). II. Experimental II.1. Synthesis of Composite Membranes In order to synthesize the nanocomposite membranes, the re-casting method was used. In this method, inorganic substances (TiO2 and SiO2) were added to the prepared polymer solution and mixed by ultrasonic stirrer (ISOLAB, 3 lt). In the mixing process, it is very important to mix inorganic substances (TiO2 and SiO2) with polymer solution properly. Therefore, the mixing process should be long enough to get a homogenous mixture. After the mixing process, the final solution was turned into membrane by using recasting method. In the preparation process of Nafion-based composite membranes, the liquid part of the 15% polymer solution should be evaporated so that only solid polymer remains. Then, the solid polymer was dissolved by using dimethylacetamide (DMAc). At the last step, the polymer-inorganic substance solution was casted to petri dishes and dried at 80 C for 24 hours. prepared. To prepare this solution, 25 ml H2SO4 (EMSURE ISO Sulfiric acid 95-97%) was mixed with 475 ml deionized water and boiled for 1 hour. Then, the membranes were dipped into the deionized water to refine it from the remnants of H2SO4. As a final step, we took the membranes from deionized water, put them in petri dishes, and added proper amount of deionized water to prevent them from drying (Liu et al., 2006; Mao et al., 2007; and Sabet-Sharghi et al., 2013). II.3. MEA Manufacturing After the activation process, two different catalyst inks (Pt based catalyst for cathode, PtRu based catalyst for anode) were prepared in order to coat the anode and cathode gas diffusion layers. In the catalyst ink preparation process, the following steps were applied. Firstly, the appropriate amount of catalyst, Nafion solution (Ion power Inc., LIQUION TM Solution, 1100EW %15 wt.), deionized water and isopropyl alcohol (TEKKIM, 2-Proponal %99.5 wt.) were mixed in the beaker. In this process, the amount of ink was determined by considering catalyst loadings as 4 mgptru/cm 2 and 4 mgpt/cm 2 for the anode and cathode sides, respectively. Because of the small amount of catalyst loss in the ultrasonic coating method, which is described below, the catalyst ink was prepared with an excess of 3% of the required catalyst ink. In the preparation of the cathode catalyst ink, the following method was used mg of 60 wt% platinum supported on carbon (Pt/C) (4 mg.cm -2 / 0.6 x 25 cm 2 +3% excess) was mixed with mg of deionized water in the beaker. Then, mg of 15% Nafion solution, and mg of isopropyl alcohol were added and mixed by magnetic stirrer (ISOTEK) for 30 minutes. After the first mixing process, the ink was mixed by ultrasonic stirrer (ISOLAB, 3 lt) for 2 hours. The magnetic stirrer and ultrasonic stirrer are shown in Fig.1. II.2. Activation of the Membranes After synthesizing the composite membranes as discussed in Section 2.1, all the membranes (Nafion 115, Nafion/SiO2, and Nafion/TiO2) were made ready for the manufacturing of the MEAs. To make them ready, the membranes were first cut down to appropriate sizes (10 cm x 10 cm for Nafion 115 and 7.6 cm x 7.6 cm for Nafion/SiO2 and Nafion/TiO2). Then, the activation process for the membranes was done. In this process, firstly, the membranes were put into 3 wt% hydrogen peroxide (H2O2) solution to remove the impurities and undesired organic materials from the membranes. In order to prepare 3 wt% H2O2 solution, 45 ml H2O2 (EMSURE ACS, ISO Hydrogen peroxide 30%) was mixed with 405 ml deionized water (DW) and boiled for 1 hour. After this boiling process, the membranes were taken from the 3 wt% H2O2 solution and put into deionized water at 90 C. To increase the proton conductivity of the membranes, 5 wt% H2SO4 solution was then 525 Fig.1: (a) Magnetic stirrer (ISOTEK), (b) Ultrasonic stirrer (ISOLAB, 3 lt) In the preparation of the anode catalyst ink, the following method is used mg of 60 wt% platinum-ruthenium supported on carbon (Pt-Ru/C) (4 mg.cm -2 / 0.6 x 25 cm 2 +3% excess) was mixed with mg of deionized water in the beaker. Then, mg of 15% Nafion solution, and mg of isopropyl alcohol were added and mixed by magnetic stirrer for 30 minutes. After the first mixing
 was used in order to coat the inks on the backing layers.")

81 process, the ink was mixed by ultrasonic stirrer for 2 hours. After the the anode and cathode catalyst inks were prepared as discussed above, ultrasonic spraying machine (Sono-Tek ultrasonic-spray system) was used in order to coat the inks on the backing layers. In the coating process, the vacum table was used to keep the backing layers at constant position and the temperature was kept at 50 C during this process. The ultrasonic spraying machine and vacum table are shown in Fig.2. the sealing of the fuel cell must be done properly in order to get better performance values from the tests. In this study, a compression torque of 3.6 N.m was used in order to provide proper sealing. Choosing the optimum compression torque is very critical. Applying too much torque leads to damaging the graphite plates; whereas lower torques may result in some leakage problems. In addition, the order of the tightening of the bolts were done following the numbering scheme shown in Fig.4b (US Fuel Cell Council, 2006). Fig.2: (a) Ultrasonic spraying machine (SONO-TEK), (b) vacuum table After the ink was coated on the anode and cathode gas diffusion layers, the general structure of the MEA was prepared for the hot press process. The three manufactured MEAs have different membranes which are listed as follows; Nafion 115, Nafion/SiO2 and Nafion/TiO2. After making some preparation for hotpress process, these three different MEAs were hotpressed at 120 C and 6.89 MPa for 4 minutes (Chen and Yang, 2003; Chen et al., 2006; and Zhang et al., 2006). The hot-press is shown in Fig.3. Fig.3: Hot-press II.4. MEA placement and testing An important process before starting to test the manufactured MEA is to clean the flow channels to get more accurate current, voltage, and power values. For this reason, the flow channels were cleaned by using a soft brush to prevent the channels from negative effects of undesired particles during the experiments. These particles would not only lead to decreasing the performance of DMFC, but they might also create the risk of channel abrasion. Fig.4a shows unwanted particles inside the flow channels. Fig.4: (a) Unwanted particles inside the channels, (b) tighting order of the bolts Before getting the voltage and current values from the tests, an activation process must be to condition the MEA. The main aim of the activation process is increasing the proton conductivity of the membrane to the desired level. In this process, firstly, the flow rates of deionized water and oxygen were arranged with the appropriate flow rates. In our study, it took 3 hours to complete the activation process. After the activation process is completed, a test protocol has been followed in order to get data to form the polarization curve (US Fuel Cell Council, 2006). Diluted methanol solution (1 M) and humidified oxygen were fed to the anode and cathode flow channels, respectively with the proper flow rates (1.94 ml/min for anode and 200 ml/min for cathode). The temperature was set to the required value (60 C, 80 C or 95 C) considered in this study. In order to get the data to assess the performance of the DMFC, we used the computer aided DMFC test station. The components of this station are shown in Fig.5. and the explanations of the labels shown in this figure are given Table 1. The voltage value was first set to open circuit voltage (OCV) and then altered between the OCV and 0.2 V by a step size of 0.05 V several times. After getting the current value at each voltage value, the voltage was set to OCV before getting the next current value until the break-in procedure is completed. The main aim of repeating this procedure several times was getting more accurate values for current and power with the deviation ratio of 5 %. Another crucial point that must be considered is that 526
 as compared to the Nafion/TiO2 composite membrane based MEA; but gives higher power values in comparison to the MEA which was produced by using commercial Nafion 115 (power value of 612.")
82 provides slightly worse perfomance (power value of W/m 2 at 0.3 V) as compared to the Nafion/TiO2 composite membrane based MEA; but gives higher power values in comparison to the MEA which was produced by using commercial Nafion 115 (power value of W/m 2 at 0.3 V). Fig.5: DMFC Test Station Table.1: The main components of the DMFC test station No Component Name 1 Methanol tank 2 Nitrogen tube 3 Oxygen tube 4 Magnetic drive gear pump 5 Mass flow controller 6 Thermocouples 7 Humidifier 8 Manometer 9 Fuel cell 10 Seperator 11 Back pressure regulator 12 PID controller 13 Computer Fig.6: The performance of the MEAs at 60 C III. Results and discussion Three different MEAs based on different membranes (Nafion/SiO2, Nafion/TiO2 and Nafion 115) were manufactured using the method discussed in Sections The performance were tests were done for three different temperature levels (60 C, 80 C, and 95 C) as discussed in Section 2.4. As a result of the conducted experiments for each MEA at 60 C, the polarization curves were formed as shown in Fig.6. This figure shows that the MEA based on Nafion/TiO2 composite membrane demonstrates the best perfomance with the power value of W/m 2 at 0.3 V. However, the MEA having Nafion/SiO2 composite membrane shows slightly lower performance with the power value of W/m 2 at 0.3 V as compared to the Nafion/TiO2 composite membrane based MEA. In addition, the MEA based on commercial Nafion 115 membrane shows the poorest performance with the performance value of W/m 2 at 0.3 V among the three MEAs studied. The polarization curves of each MEA at 80 C are shown in Fig.7. As can be seen from this figure, when the cell temperature was increased to 80 C, the MEA which was produced by using Nafion/TiO2 composite membrane showed the best perfomance (power value of W/m 2 at 0.3 V). On the other hand, the MEA which was manufactured by using Nafion/SiO2 527 Fig.7: The performance of the MEAs at 80 C The comparison of the polarization curves of the MEAs at 95 C is given in Figure 8. After the cell temperature was set to 95 C, the superior features of these Nafion based composite membranes became more prominent. As can be seen from the Fig.8, both of the MEAs, which were produced by using Nafion/TiO2 and Nafion/SiO2 innovative composite membranes, provide much better performance with the power values of W/m 2 and W/m 2 at 0.3 V, respectively. However, the MEA which was produced by using commercial Nafion 115 membrane
83 gives the power value W/m 2 at 0.3 V. As a result of all these experiments, the innovative Nafion/SiO2 and Nafion/TiO2 composite membranes are very promising for the DMFC applications. Besides this, it can be concluded that Nafion/TiO2 composite membranes provided much better performance at high temperatures as compared to commercial Nafion 115. Acknowledgements The authors would like to thank Dr. David Ouellette for his help in the modification of DMFC test station, Huseyin Devrim, Kubra Pehlivan, Omer Erdemir, and Mustafa Karakoyun from TEK-SIS for their help in the ultrasonic coating process. References Fig.8: The performance of the MEAs at 95 C IV. Conclusions In this study, the performance values for three different MEAs were measured in order to determine the effects of membrane type (Nafion/SiO2, Nafion/TiO2 and Nafion 115) and operating temperature (60 C, 80 C and 95 C) on the performance of DMFCs. A comparison between the performances of the MEAs was done to find the type of the membrane that yields better performance at each temperature levels. The main conclusions derived from the study conducted are as follows. The MEA with Nafion/TiO2 composite membrane provided better performance with the power value of W/m 2 at 0.3 V as compared to the MEA with commercial Nafion 115 membrane at 95 C cell temperature. The MEA which was manufactured by using Nafion/SiO2 membrane demonstrated better performance with the power value of W/m 2 at 0.3 V in comparison to Nafion 115 membrane at 95 C cell temperature. The maximum power value at 0.3 V that can be received from the MEA which was manufactured by using Nafion/TiO2 is 1.36 times higher than that of the MEA which was manufactured by using commercial Nafion 115 at 95 C cell temperature. The maximum power value at 0.3 V that can be received from the MEA which was fabricated using Nafion/SiO2 is 1.26 times higher than that of the MEA which was produced using commercial Nafion 115 at 95 C cell temperature. Baglio V., Di Blasi A., Arico A.S., Antonucci V., Antonucci P.L., Seraino Fiory F., Licoccia S., Traversa E., Influence of TiO2 Nanometric Filler on the Behaviour of a Composite Membrane for Applications in Direct Methanol Fuel Cells, Journal of New Materials for Electrochemical Systems, 7.4, (2004). Baglio V., Arico A.S., Antonucci V., Nicotera I., An NMR Spectroscopic Study of Water and Methanol Transport Properties in DMFC Composite Membranes : Influence on the Electrochemical Behaviour, Journal of power sources 163.1, (2006). Chang H., Kim J.R., Cho J.H., Kim H.K., Choi K.H., Materials and Processes for Small Fuel Cells, Solid State Ionics, 148, (2002). Chen C. Y., Yang P., Performance of an Air-Breathing Direct Methanol Fuel Cell, Journal of Power Sources, 123(1), (2003). Chen C. Y.,Yang P., Lee Y.S., Lin K.F., Fabrication of Electrocatalyst Layers for Direct Methanol Fuel Cells, Journal of Power Sources, 141(1), (2005). Chen R., Zhao T. S., Liu J.G., Effect of Cell Orientation on the Performance of Passive Direct Methanol Fuel Cells, Journal of Power Sources, 57(1), (2006). Devrim Y., Electrochimica Acta Fabrication and Performance Evaluation of Hybrid Membrane Based on a Sulfonated Polyphenyl Sulfone / Phosphotungstic Acid / Silica for Proton Exchange Membrane Fuel Cell at Low Humidity Conditions, Electrochimica Acta, 146, (2014). Devrim Y., Erkan S., Bac N., Eroglu I., Improvement of PEMFC Performance with Nafion / Inorganic Nanocomposite Membrane Electrode Assembly Prepared by Ultrasonic Coating Technique, 7, (2012). 528 Eroglu, I., Preparation and Characterization of
84 Sulfonated Polysulfone / Titanium Dioxide Composite Membranes for Proton Exchange Membrane Fuel Cells, 34, (2009). Hobson L. J., Nakano Y., Ozu H., Hayase S., Targeting Improved DMFC Performance, Journal of Power Sources, 104(1), 79 84, (2002). Kamarudin S. K.,Hashim N., Materials, Morphologies and Structures of MEAs in DMFCs, Renewable and Sustainable Energy Reviews, 16(5), (2012). Kim J.H., Ha H.Y., Oh I.H., Hong S.A., Kim H.N., Lee H.I., Electrochemical Studies of DMFC Anodes with Different Ionomer Content, Electrochimica acta, 50, (2004). Liu J.G., Zhao T.S., Liang Z.X., Chen R., Effect of Membrane Thickness on the Performance and Efficiency of Passive Direct Methanol Fuel Cells, Journal of Power Sources, 153(1), (2006). Ether Ketone Sulfone )/ Sulfonated Poly ( Vinylalcohol ) Crosslinked Membrane for Direct Methanol Fuel Cell Applications, Journal of Membrane Science, 492, (2015). Ye G., Hayden. C. A., Goward G. R., Proton Dynamics of Nafion and Nafion / SiO2 Composites by Solid State NMR and Pulse Field Gradient NMR, (2007). Yuan T., Pu L., Huang Q., Zhang H., Li X., Yang H., Electrochimica Acta An Effective Methanol-Blocking Membrane Modified with Graphene Oxide Nanosheets for Passive Direct Methanol Fuel Cells, Electrochimica Acta, 117, (2014). Zhang J., Geping Y., Wang Z., Shao Y., Effects of MEA Preparation on the Performance of a Direct Methanol Fuel Cell, Journal of Power Sources, 160(2), (2006). Mao Q., Sun G., Wang S., Sun H., Wang G., Gao Y., Ye A., Tian Y., Xin Q, Comparative Studies of Configurations and Preparation Methods for Direct Methanol Fuel Cell Electrodes, Electrochimica Acta, 52(24), (2007). Mueller J. T., Peter M. U., Characterization of Direct Methanol Fuel Cells by Ac Impedance Spectroscopy, Journal of Power Sources, 75(1), , (1998). Sabet-Sharghi N., Cruickshank C.A., Matida E., Hamdullahpur F., Performance Measurements of a Single Cell Flowing Electrolyte-Direct Methanol Fuel Cell (FE-DMFC), Journal of Power Sources, 230, (2013). Salarizadeh P., Javanbakht M., Abdollahi M., Naji L., Preparation, Characterization and Properties of Proton Exchange Nanocomposite Membranes Based on Poly(vinyl Alcohol) and Poly(sulfonic Acid)-Grafted Silica Nanoparticles, International Journal of Hydrogen Energy, 38(13), (2013). Schonert M., Jakoby K., Schlumbahn C., Glusen A., Mergel J., Stolten D., Manufacture of Robust Catalyst Layers for the DMFC, Fuel Cells, 4(3), (2004). US Fuel Cell Council, Single Cell Test Protocol, (2006). Vaivars G., Maxakato N. W., Mokrani T., Petrik L., Klavins J., Gericke G., Linkov V., Zirconium Phosphate Based Inorganic Direct Methanol Fuel Cell, Mater. Sci., 10(2), (2004). Wei Z., Wang S., Yi B., Liu J. Chen L., Zhou W., Li W., Xin Q., In Fluence of Electrode Structure on the Performance of a Direct Methanol Fuel Cell, Journal of Power Sources, 106, (2002). Xu J., Ni H., Wang S., Wang Z., Zhang H., Direct Polymerization of a Novel Sulfonated Poly ( Arylene 529
85 Evaluation of Design and Performance of Two Different Power Systems for a Small UAV Mohamed Gadalla* and Sayem Zafar Department of Mechanical Engineering, American University of Sharjah, Sharjah, UAE * [email protected] Abstract A study is conducted to evaluate the design and performance of a small unmanned aerial vehicle (UAV) with hybrid power system. The hybrid system is designed for the UAV with maximum take-off weight of 180 N. The hybrid power system includes a proton exchange membrane (PEM) fuel cell and batteries to power the propulsion system. A hybrid power system is proposed as a substitute to the batteries-only system as fuel cells help to improve the endurance of the UAV. A comparative analysis is conducted to evaluate the use of two different arrangements of the power system. First system comprises of 200 W proton exchange membrane fuel cell and a set of batteries. The second system comprises of 1 kw proton exchange membrane fuel cell. Both the power systems are used to operate AXi motor and an appropriate propeller. Design analysis is conducted for size, weight and capacity optimization. The flight performance is simulated using available and calculated data. The corresponding required power is determined through flight tests of the UAV. The aircraft drag is simulated using commercially available computational fluid dynamics software for the cruise conditions and maneuvering. Both the systems show set of advantages compared to each other. The 1 kw fuel cell system has extra power available for aggressive maneuvering but on the other hand it has limited battery backup power and lower endurance. The 200 W fuel cell system has a lot of back-up power but cannot perform aggressive maneuvering and costs more. The results highlighted the effectiveness of using fuel cell and hybrid system as a small UAV power plant and the effectiveness of fuel cell over its life cycle. Keywords: Unmanned Aerial Vehicle, PEM fuel cell, long endurance, testing, hybrid power system I. Introduction Small unmanned aerial vehicles (UAVs) have seen growing use in recent years (Wong, 2015). The existing small scale electric power sources, used in UAVs, do not provide enough energy to enable long endurance flight (Rottmayer et al., 2011). Present electric power storage technologies do not provide the desired energy for long endurance without adding substantial weight which hinders the UAV functionality (Fathabadi, 2014). Improving the flight endurance of a UAV is important as it expands the operational capability and usage of a UAV. Long endurance small UAVs are in demand as they can be operated at low cost for increased service span. Fuel cells are seen as alternate to electric batteries as a potential power source for UAVs. Fuel cells have higher energy density compared to small combustion engines and electric batteries (Furrutter et al., 2009). Fuel cells also appear to be a more efficient power sources for long endurance UAV flights compared to conventional batteries (Kim et al., 2011). Compared to existing UAV technology, fuel cell powered UAV results in endurance increase of 4 to 5 times (Rottmayer et al., 2011). There are different types of fuel cells depending on the type of fuel they use. Proton exchange membrane fuel cell seems to be the best solution for low power, weight and exhaust temperatures. The proton exchange membrane (PEM) fuel cell uses hydrogen to produce DC electric current and water as emission while operating at low temperature (El-Sharkh et al., 2004). As a UAV power system, fuel cell has shown that it can sustain flight for an hour and can meet the electric load demand from the UAV motor (Kim, 2014). Ion Tiger fuel cell powered UAV even flew for 24 hours successfully meeting the load demand of a 24 kg UAV (Swider-Lyons, 2011). Fuel cells of 500 W power have also been used for a UAV which not only allowed steady cruise flight but also provided enough power to perform high power acceleration and climb (Bradley et al., 2007). Research using alkaline hydrogen generator with PEM fuel cell showed it can give UAV endurance up to 2 hours (Kim et al., 2011). Hybrid power systems have been tested for land based applications. The results have shown efficiency improvement compared to non-hybrid systems (Hosseini et al., 2013). Hybrid system using PV panels and gas turbine improves the operating efficiency however the gravimetric power density is lower for such hybrid systems compared to the power systems in widespread use today (Palethrope et al., 2008). Hybrid power systems have been extensively studied for mobile applications for their usability, performance and integration. With recent advancements in electronics and increase in demand, hybrid electric vehicles are becoming cost effective while being environmentally benign (Saxe et al., 2008). Tests of a UAV using fuel cell and PV have been conducted. Test shows such integration improves the performance of the UAV and such systems can be successfully integrated (Bohwa et al., 530
. Studies have been conducted on the design and implementation on fuel cell powered aircraft.")

86 2014). Utilizing a hybrid PV-fuel cell system can help maintain higher overall efficiency and the highest efficiency is not when the highest power is available (Romeli et al., 2014). For a small UAV hybrid PV-fuel cell system can improve the endurance up to 22% (Zafar et al., 2012). Studies have been conducted on the design and implementation on fuel cell powered aircraft. This study analyses the performance of the UAV while using either the hybrid power system or a fuel cell only power system. Hybrid system comprises of a small PEM fuel cell and a set of batteries. The fuel cell power system is a large fuel cell to provide the desired power. This paper also evaluates the capital cost of the two systems and their effect on the functionality of the UAV. II. Experimental Setup An integrated hybrid energy system is designed, tested and analyzed to provide power for UAV operations. Figure 1 shows the picture of the designed UAV used for the study. UAV is flight tested for the cruise conditions. The cruise condition testing is conducted to determine the cruise RPM of the motor-propeller system. The cruise RPM of the motor-propeller system is the RPM at which minimum required thrust is scheived to keep the UAV flying. Figure 2 shows the UAV during the flight test during take-off run. Tab. 1: Description of the UAV used for the power system Structural Mass MTOW Wing Span Wing Chord Horizontal Stabilizer Span Horizontal Stabilizer Chord Total Lift (cruise condition) Thrust Drag 4.5 kg 180 N 3.83 m m 1.4 m 0.35 m 180 N 37.7 N 14 N Fig. 1: Picture of the designed UAV power system. A UAV is specifically designed to be powered by the two systems. The primary reason for the UAV design is to demonstrate the feasibility of using hybrid or fuel cell-only system as a small UAV power plant. Since UAV is small, a primary requirement is its weight. A maximum take-off weight, MTOW, of 180 N is chosen for the UAV. This MTOW limit made the UAV light enough to be carried over long distances yet enabled fuel cell and systems to be incorporated in the aircraft. The sub-systems are housed in the fuselage. It is important to know the UAV dimensions and constraints so that a true power system can be chosen. A specific UAV design is selected for this study however this hybrid system can be used for any application. UAV design is out of scope of this study. However the UAV design can be further studied in the hybrid renewable energy paper (Gadalla et al., 2016). Table 1 describes the features of the UAV for which the power systems are studied. 531 Fig. 2: UAV take-off run during the flight test III. Power Systems This study is conducted to evaluate the use of two different power systems. First system is a hybrid system comprising of 200 W proton exchange membrane fuel cell and a set of five batteries. The second system, which is fuel cell only, comprises of 1 kw proton exchange membrane fuel cell. Both the power systems are used to operate AXi motor. With the motor, APC Electric E two-blade propeller is used. The propeller blades have a diameter of 20 inch while the pitch is 13 inch. The total take off weight is 180 N for both the configurations. Horizon Energy Systems Aeropak is used as the fuel cell for the hybrid power system; the first power system. Aeropak is a proton exchange membrane fuel cell which consists of 200 W fuel cell and a 900Wh hydrogen cylinder (Horizon, 2010). Aeropak is chosen because of its light weight, proven performance, size and hydrogen capacity. Some of the prominent features of Aeropak are tabulated in table 3. Batteries are used along with the AEROPAK fuel cell for the hybrid power system. Six LiPo 5000mAh 20/30 batteries are used to store the charge. This
87 battery type is chosen based on the required voltage and battery weight. The battery s dimension also played a vital role in its selection since fuselage has limited capacity. Tab. 2: Characteristics of Aeropak fuel cell with hydrogen cylinder Aeropak Fuel Cell Continuous Output Power 200 W Continuous Current 10 A Output Voltage Range V Mass kg Lifetime at Rated Power 500 hours Operating Temperature 0-40 C Hydrogen Cylinder Energy 900 Wh Hydrate Weight 1.55 kg Dry Weight 0.55 kg Cost (cylinder + fuel cell) U$ 15,850 Tab. 3: Specification of the battery used for the UAV power system LiPo 5000mAh 20/30 Number of cells 5 Capacity 5 Ah Voltage per cell 3.7 V Mass 0.9 kg Length m Width 0.07 m Height 0.04 m Resistance per cell 4.5 x 10⁻³ Ohms Cost (each) U$ 247 For the second arrangement of the power system, Horizon FSC-C1000 fuel cell is used. It is used because of its higher power output of 1000 W and low price. Some of the prominent features of Horizon FSC-C1000 fuel cell are tabulated in table 4. Tab. 4: Characteristics of Horizon FSC-C1000 fuel cell with hydrogen cylinder Horizon FSC-C1000 Fuel Cell Continuous Output Power 1000 W Continuous Current 35 A Output Voltage Range V Mass 5.5 kg Lifetime at Rated Power 500 hours Operating Temperature 0-60 o C Hydrogen Cylinder Energy 900 Wh Hydrate Weight 1.55 kg Dry Weight 0.55 kg Cost (cylinder + fuel cell) U$ 7,180 IV. Modeling The modeling is conducted to evaluate the two different power systems, namely hybrid and fuel cell only systems. For the hybrid power system, the power is provided by the fuel cell and the battry simultaneously. The Aeropak fuel cell alone does not provide the adequate power to the motor since the Aeropak fuel cell is small and only produces 200 W of power. The motor requires more power than the Aeropak fuel cell can provide. The remaining power is provided by the battery. Six batteries are used 532 since the fuel cell runs a lot longer than each battery. The other system is the fuel-cell-only system with 1 kw fuel cell providing the required power. This power system does not require any batteries since the fuel cell provides the power required by the motor for the entire flight. The power to propel the UAV comes from the power system comprising of several components. Electric power system is used for the model study of a small UAV. The non-electric power systems are bulky, heavy and have low power to weight ratio which makes them undesirable for small power outputs (Rottmayer et al., 2011 and Furrutter et al., 2009). The modeled UAV requires high power for take-off, climb and initial maneuvering which can be provided by the initial charge stored in the battery at the time of take-off. During cruise, the power required by the UAV is low and constant which can be provided by either of the two proposed power systems.the power systems for the UAV includes the following components: Motor Propeller Battery Fuel Cell The UAV power system is modeled only for the cruise phase and it is assumed that the charge stored in the battery gets completely consumed during take-off. The motor gets the power from either the fuel cell or from the battery, depending on the fuel cell capacity and motor power requirement. Power system components are commercially available and are suitably used to achieve the desired goals. V. Analysis For any flying object, lift is of utmost concern. For a fixed wing aircraft like the one considered in this study, wings create the desired lift. The governing equation that describes the total lift is as follows, L = ρ 2 S v2 (CL) (1) The total drag experienced by the UAV wing can be described as follows, 1 CD = Cd +CL 2 ( ) (2) πear where e is the Oswald efficiency factor and AR is the aspect ratio. The equation that relates aspect ratio to other geometric parameters is as follows; AR = b2 S (3) Analysis is conducted for size, weight, endurance and cost optimization. Electric motor, PEM fuel cell and battery equations are described in this section. Since the battery or the fuel cell produces DC current,
88 a DC motor is required to avoid the use of a power inverter. For an ideal DC motor, current, Im, voltage, Vm and rotational speed, ω, can be related as follows (Lindahl et al., 2009). Vm = KV ω + 2RmIm (4) where ω is the rotational speed of the shaft and KV is the motor speed constant. The constant KV is the voltage required for each revolution hence it varies for the type of propeller used. Value for Vm is determined by the battery type used while the no-load KV and Rm are provided by the motor manufacturer. The governing equation that defines the thrust produced at the propeller is given as follows, T = C t ρ n 2 D 4 (5) where T is thrust, C t is coefficient of thrust, ρ is density of air, n is the rotational speed in revolutions per second and D is the diameter of the propeller. The power produced by the fuel cell stack is given by following equation (Mert et al., 2012). W stack= V operating i A cell n cell (6) where V operating is the operating cell voltage, n cell is the number of fuel cells inside the stack, A cell is the area of the each cell and i is the current density. The equation that relates the capacity of the battery to its discharge time is as follows (Hausmann et al., 2013), Tab. 5: Aeropak fuel cel run time with respect to cylinder pressure Time (sec) Pressure (bars) Tab. 6: Batteries voltage, current and run time data when operated simultaniously with Aeropak Initial voltage Cut-off Cut-off time Battery (V) Voltage (V) (sec) Figure 3 shows the graphical representation of the Aeropak run time simultaneously with the batteries. The battery voltages and currents are also shown in the graph. It shows that the Aeropak fuel cell with the set of batteries can provide the adequate power to the UAV motor for cruise flight. It also shows that the hybrid system can provide endurance of 73 minutes to the UAV under cruise power conditions. t = H ( Q IH )k (7) where H is the rated discharge time, Q is the rated capacity at that discharge rate, I is the actual discharge current, k is the Peukert constant and t is the actual time to discharge the battery. VI. Results and discussions The results are gathered and avaluated for the two different systems. The first set of testing is done through actual flight test with the UAV at 180 N weight. The flight test established the cruise RPM required by the UAV to produce the required thrust. The data is recorded through telemetry system for steady level flight. Using the cruise RPM data, the two power systems are tested using the bench test system. Table 5 below shows the 200 W fuel cell run time and the hydrogen cylinder pressure. Table 6 shows the battery related data collected when the fuel cell and the batteries operated simultaneously to power the motor. Fig. 3: Graphical representation of the Aeropak run time simultaneously with the batteries Figure 4 shows the change in hydrogen cylinder pressure with respect to the Aeropak run time. With 85 bar hydrogen pressure in the cylinder, the total endurance Aeropak fuel cell provides is 73 minutes. It is to be noted that just by increasing the hydrogen pressure in the cylinder, the UAV endurance does not improve. A set of batteries are also required to be included to achieve the endurance increase. However, adding more batteries increases the weight which adversely affects the performance and functionality of the UAV. 533

89 Capital cost analysis is also conducted to dermine which power system appears to be more economical. Figure 6 shows the capital cost comparison of the two analysed power systems. Hybrid system costs U$ 17,332 while the fuel cell-only system costs U$ 7,180. Hybrid system is a lot more expensive primarily due to its use of Aeropak fuel cell. Aeropak is a specially designed light weight fuel cell for UAV use which makes it more expensive. On the other hand, HSC C-1000 is a land-based fuel cell which uses existing technologies. Fig. 4: Change in hydrogen cylinder pressure with respect to the Aeropak run time Table 7 shows the 1000 W fuel cell run time, voltage, current and the hydrogen cylinder pressure. Figure 5 shows the graphical representation of the HSC C-1000 fuel cell run time along with the voltage and current readings. The graph shows that HSC C-1000 fuel cell alone provides the adequate power to the UAV motor. The provided power is not only suitable for cruise flight; it can also be used for high power climb and maneuvering. Using MSC C-1000 fuel cell expands the operational capabilities and also alllows for additional payload to be carried. The graph shows that the fuel cell-only power system provides endurance of 54 minutes to the UAV under cruise power conditions. Tab. 7: MSC C-1000 fuel cell run time, voltage, current and the hydrogen cylinder pressure Pack Time (sec) Current (Amps) Power (W) Voltage (V) Pressure (Bars) Fig. 5: HSC C-1000 fuel cell run time along with the voltage and current readings Fig. 6: Capital cost comparison of the two analysed power systems VII. Conclusions A study is conducted to analyse the use of two different power systems for a small UAV. Experimental flight and ground tests are conducted to determine the cruise RPM endurance, voltage and current. Capital cost analysis is also conducted to determine the economic feasibility of each system. The results of the experimental tests and models confirm the following conclusions: Hybrid system gives the endurance of 73 minutes. Fuel cell system gives the endurance of 54 minutes. Hybrid system gives the options of back-up power, incase of Aeropak fuel cell system malfunction since it has several on board batteries. Fuel cell system does not have an inherent backup power system unless specially instaleed. Hybrid system does not have excess power available incase of aggressive maneuvering, head winds or greater payload on-board. Fuel cell system has a lot of excess power available which not only allows aggressive menuvering, in case it is required, it also allows the UAV to carry greater payload. Hybrid system s total capital cost comes out to be U$17,332 while the fuel cell system costs U$ 7,180. It makes the hybrid system 250 % more expensive than the fuel cell system. 534
90 Nomenclature A cell Area of the each cell (m 2 ) b Span (m) Cd 2-D Coefficient of drag CD 3-D Coefficient of drag CL 3-D Coefficient of lift Ct Coefficient of thrust D Propeller diameter (m) e Oswald efficiency factor H Rated discharge time (s) i Current density (Amps/m 2 ) I Current (Amps) k Peukert constant KV Motor speed constant (V/RPM) L Lift (N) n Rotational speed (rev/s) n cell Number of fuel cells in the stack Q Battery capacity (Ah) Rm Motor Resistance (Ohms) S Planform area (m 2 ) T Thrust (N) v Velocity (m/s) 1-6 (2009) Gadalla M, Zafar S. Analysis of a Hydrogen Fuel Cell-PV Power System for Small UAV. International Journal of Hydrogen Energy, 41, (2016) Hausmann A, Depcik C. Expanding the Peukert equation for battery capacity modeling through inclusion of a temperature dependency. J of Power Sources, 235, (2013) Horizon Energy Systems, "Aeropak Technical Data Sheet", Horizon Energy Systems, Data Sheet, Singapore, 2-5 (2010) Hosseini M, Dincer I, Rosen MA. Hybrid solar fuel cell combined heat and power systems for residential applications: Energy and exergy analyses. J of Power Sources, 221, (2013) Khaligh A, Onar OC. Energy Harvesting: Solar, Wind, and Ocean Energy Conversion Systems. CRC Press, Boca Raton, Chapter 1, (2001) Acronyms AR Aspect Ratio MTOW Maximum Takeoff Weight (N) RPM Revolutions per minute UAV Unmanned Ariel Vehicle Greek Letters ρ Air density (kg/m 3 ) ω Rotational Speed (rads/s) References Bohwa Lee, Poomin Park, Keunbae Kim, Sejin Kwon, The flight test and power simulations of an UAV powered by solar cells, a fuel cell and batteries, Journal of Mechanical Science and Technology, Volume 28, Issue 1, , (2014) Bradley TH, Moffitt BA, Mavris DN, Parekh DE. Development and experimental characterization of a fuel cell powered aircraft. J of Power Sources, 171, (2007) Chen H, Khaligh A. Hybrid Energy Storage System for Unmanned Aerial Vehicle (UAV). IECON, Phoenix, (2010) El-Sharkh MY, Rahman A, Alam MS, Byrne PC, Sakla AA, Thomas T. A dynamic model for a stand-alone PEM fuel cell power plant for residential applications. J of Power Sources,138, (2004). Fathabadi H. High thermal performance lithium-ion battery pack including hybrid active passive thermal management system for using in hybrid/electric vehicles. Energy, 70, (2014) Furrutter MK, Meyer J. Small Fuel Cell Powering an Unmanned Aerial Vehicle. IEEE AFRICON, Nairobi, 535 Kim K, Kim T, Lee K, Kwon S. Fuel cell system with sodium borohydride as hydrogen source for unmanned aerial vehicles. J of Power Sources, 196, , (2011) Kim T, Kwon S. Design and development of a fuel cell-powered small unmanned aircraft. International J of Hydrogen Energy, 37, (2011) Kim T. NaBH4 (sodium borohydride) hydrogen generator with a volume-exchange fuel tank for small unmanned aerial vehicles powered by a PEM (proton exchange membrane) fuel cell. Energy, 69, (2014) Lindahl P, Moog E, Shaw S. Simulation, Design, and Validation of an UAV SOFC Propulsion System. IEEE Transactions on Aerospace and Electronic Systems, 48, (2009) Mert SO, Dincer I, Ozcelik Z. Performance investigation of a transportation PEM fuel cell system. International J of Hydrogen Energy, 37, (2012) Palethorpe B, Catucci M, Ede J, Jewell GW. Very Long Endurance Propulsion Systems. 3 rd SEAS DTC Technical Conference, Edinburgh, 1-5 (2008) Romeli Barbosa, B. Escobar, Victor M. Sanchez, J. Hernandez, R. Acosta, Y. Verde, Sizing of a solar/hydrogen system for high altitude long endurance aircrafts, International Journal of Hydrogen Energy, Volume 39, Issue 29, (2014) Rottmayer M, Miller RM. Fuel Cell Hybrid Power System Development for Extended Endurance SUAS Applications. AIAA Centennial of Naval Aviation Forum 100 Years of Achievement and Progress,
91 Virginia Beach, 6976, (2011) Saxe M, Folkesson A, Alvfors P. Energy system analysis of the fuel cell buses operated in the project: Clean Urban Transport for Europe. Energy, 33(5), (2008) Swider-Lyons KE, MacKrell JA, Rodgers JA, Page GS, Schuette M, Stroman RO. Hydrogen Fuel Cell Propulsion for Long Endurance Small UAVs. AIAA Centennial of Naval Aviation Forum 100 Years of Achievement and Progress, AIAA, Virginia Beach, 6975, (2011) Thomas JP, Qidwai MA, Kellogg JC. Energy scavenging for small-scale unmanned systems. J of Power Sources, 159, (2006) Wong KV. Research and Development of Drones for Peace High Power High Energy Supply Required. ASME J Energy Resource Technology, 137(3), , (2015) Zafar S, Gadalla M, Evaluation of an Integrated Fuel cell- PV Panel System as Hybrid UAV Powerplant, ASME 2012 International Mechanical Engineering Congress & Exposition November 9-15, Huston, Texas, USA, 87708, (2012) 536
92 Effect of Cathode Flow Field Configuration on the Performance of Flowing Electrolyte- Direct Methanol Fuel Cell Ugur Gencalp *, David Ouellette, Can Ozgur Colpan Department of Mechanical Engineering, Dokuz Eylul University, Buca, Izmir, Turkey, * [email protected] Abstract A major challenge in direct methanol fuel cells is the crossover of methanol, from the anode to the cathode. The flowing electrolyte (FE) concept is one method used to reduce or eliminate the effects of this problem. In this method, the flowing electrolyte washes away any methanol that attempts to crossover; thus there is no undesirable chemical reaction occurring at the cathode side. In this study, we investigated the effect of cathode flow field configuration on the performance of flowing electrolyte-direct methanol fuel cell (FE-DMFC). The fuel cell was modelled and simulated in COMSOL Multiphysics environment. Methanol concentration, oxygen concentration, pressure distribution and velocity distributions were simulated for serpentine, parallel-serpentine, three-serpentine and grid type flow field configurations. As a result of these studies, the highest performance was achieved at the serpentine flow field; whereas grid type displayed the poorest performance. Keywords: Flowing electrolyte, direct methanol fuel cell, modelling, flow field, Comsol I. Introduction Direct methanol fuel cells (DMFCs) are considered to be a promising technology for portable applications, and functions by converting the chemical energy stored within the fuel and oxidant (methanol and oxygen, respectively) to produce electrical energy. Referring to Fig. 1, this process is achieved by supplying diluted methanol to the anode fuel channel (AFC), where the methanol is then transported to the anode catalyst layer (ACL), where the methanol is then oxidized to produce carbon dioxide, protons and electrons. The generated protons conduct through the electrolyte phase (typically Nafion) to the cathode catalyst layer (CCL). Since the electrolyte phase has a very high electronic resistance, the produced electrons must conduct to the cathode via an external circuit. The supplied oxidant (oxygen or air) enters the cathode air channel (CAC) inlet and is transported to the CCL, where the oxidant is reduced. The supplied protons and electrons, from the anode, react with the supplied oxidant within the CCL to produce water. The DMFC s performance is limited by several issues, such as slow MOR kinetics and unwanted methanol crossover to the cathode. Several studies have been focused on the methanol oxidation reaction within the anode, where different catalysts have been developed to increase DMFC performance [1]. A crossover current density occurs with unwanted methanol reaction with oxygen in cathode side and it reduces overall current density, electrical and fuel efficiency of the fuel cell. Figure 1. Schematic flowing electrolyte direct methanol fuel cell A potential solution to the methanol crossover problem is the flowing electrolyte concept, which was developed by Kordesh et al. [2]. In this configuration, the flowing electrolyte channel (FEC) and an extra membrane separate the anode and cathode and a dilute electrolyte, such as sulfuric acid, is pumped through FEC to carry away any methanol that attempts to crossover. This process causes the cathodic activation polarization to decrease, as little or no methanol oxidation occurs within the CCL. However, the Ohmic polarization increases due to the two additional layers (the FEC and second membrane). To improve the fuel cell s performance, this design must be optimized. The FE-DMFC is shown schematically in Fig

93 In literature, there are some experimental and modelling studies about FE-DMFC. Kjeang et al. (2006) developed another 3D CFD model to comprehend methanol crossover by convectiondiffusion. A parametric study is operated for fuel concentration, FE thickness and electrolyte flow rate. The results demonstrate that methanol crossover reduce with flowing electrolyte significantly. Kjeang et al. (2005) developed a three dimensional (3D) computational fluid dynamics (CFD) model to analyse the methanol transport within the FE-DMFC. Methanol crossover was defined as a flux at the cathode surface. Their results showed that methanol crossover was reduced by the flowing electrolyte. Colpan et al. (2011, 2012) developed 1D and 2D models of the FE-DMFC study the effect of operational parameters (flowing electrolyte thickness, methanol concentration, and fluid velocity of fuel air and flowing electrolyte) on the fuel cell s performance. The results did not show significant difference between maximum power densities; however electrical efficiency increased when -FEC outlet is recirculated to the FEC inlet. It was also shown that the FEC thickness affects ohmic losses so it must be thin as possible as it be; and higher velocities of fluids yielded better performance. Three dimensional modelling is an important method in the improvement of the design and performance of fuel cell systems. Using this method, the best design and operation parameters can be estimated for the fuel cell in a more economical fashion compared to experimental methods.. To ensure high fuel cell performance, it is important to have a well-designed flow field configuration, as this directly affects the concentration distribution of the fuel and oxidizer within the fuel cell. Some researchers have experimentally studied the flow field configuration in a DMFC, such as, Yang and Zhao (2005), who investigated the effect of anode flow field design on a DMFC. Their results indicate that the single serpentine flow field delivered better performance than the parallel flow field. High cell performance was shown to be achieved at high methanol flow rate and longer flow channels. However, the longer channels caused larger pressure drops across the inlet and outlet. Jung et al. (2009) studied the flow distribution within the cathode flow field. Grid, parallel and three different types of serpentine designs were fabricated and tested. The grid flow field configuration showed better gas distribution and minimal pressure drop. The objective of this paper is to model a 3D, single phase FE-DMFC for different flow field configurations for the cathode. As discussed above, there are some FE-DMFC model in the literature, however, none of these studies included the effects of the flow field configuration on 3D scale. In this study, four different cathode flow field configurations (serpentine, parallel serpentine, three serpentine and grid) are investigated using a mathematical model that couples conservation of mass, momentum and species equations with electrochemical relations. It is aimed to find the cathode flow field configuration that yields the highest performance. II. Modeling In the FE-DMFC, the flowing electrolyte channel is in the middle of fuel cell and separates the anode and cathode membranes (AM and CM). The cross section of the FE-DMFC geometry is shown schematically in Figure 2. The dimensions of all components of the fuel cell are shown in Table 1. Four different flow field configurations model (serpentine, parallel serpentine, three serpentine and grid) are designed for the cathode side, which are shown in Figure 3. For the anode side, a single serpentine flow field is used in all configurations. The main assumptions used in the models are as follows; The fuel cell operates under steady state, single phase and isothermal conditions. Each media is homogeneous and isotropic. All crossed over methanol is fully consumed at the CCL-CM interface. The membranes are fully hydrated. Ideal gas assumption for gaseous species and all flows are assumed to be laminar. All physical properties are considered constant. Gravitational effects are neglected. Figure 2. Geometry of the FE-DMFC (AHM: Anode Half MEA, CHM: Cathode Half MEA) Table 1. Dimensions of the components of the FE-DMFC Components Dimensions Channel Width 1.5 [mm] Channel Height 1.5 [mm] Anode Backing Layer 0.21 [mm] Anode Catalyst Layer 0.03 [mm] Anode and Cathode Membranes 0.18 [mm] Flowing Electrolyte Channel 0.61 [mm] Cathode Backing Layer 0.21 [mm] Cathode Catalyst Layer 0.03 [mm] II.1. Governing equations Momentum balance equation is used in this model. Equations (1) and (2), which are Navier-Stokes and continuity equations, respectively, were employed to calculate the pressure and velocity in the flow field. ρ(u )u = [ pl + μ( u + ( u) T ) 2 3 μ( u)i] + F (1) 538

![ρ u = Q br (3) ρ ε p ((u ) u ε p ) = [ pl + μ ε p ( u + ( u) T ) 2μ 3ε p ( u)i] (μk 1 + β F u + Q br ε p 2 ) u + F (4) where ε_p is porosity of layer, K is permeability of layer, Qbr is the mass](/docs-images/61/46391492/images/94-1.jpg "source for each species. d.) Equation (5) and (6) are the conservation of chemical species and molar flux of the chemical species of interest, respectively.")
 single serpentine, b) three-serpentine, c) parallel serpentine, and d) grid. II.3. Mesh generation and solution procedure b.")

94 ρ u = 0 (2) c.) where ρ is density, p is the pressure, μ is dynamic viscosity, u is velocity and I is identity matrix. Thermophysical properties are related to temperature, assumed to be constant in this work. ρ u = Q br (3) ρ ε p ((u ) u ε p ) = [ pl + μ ε p ( u + ( u) T ) 2μ 3ε p ( u)i] (μk 1 + β F u + Q br ε p 2 ) u + F (4) where ε_p is porosity of layer, K is permeability of layer, Qbr is the mass source for each species. d.) Equation (5) and (6) are the conservation of chemical species and molar flux of the chemical species of interest, respectively. The source term in Equation (5) account for the creation or consumption of the chemical species.. ( D i c i ) + u c i = R i (5) N i = D i c i + uc i (6) a.) Figure 3. Cathode flow field configurations for the FE-DMFC. a) single serpentine, b) three-serpentine, c) parallel serpentine, and d) grid. II.3. Mesh generation and solution procedure b.) In this study, Comsol Multiphysics 5.0, which is a software based on finite element method, is used for the solution of equations given in Section 2.2. For this purpose, firstly, meshes are generated for the geometries given in Figure 3. Tetrahedral elements are used the mesh the flow fields and the FEC, whereas tetrahedral elements are used to mesh the remaining layers. Then, the equations are entered to the software using the built-in modules (Free and porous media flow and transport of diluted species) and the variables. In this study, the current density of the cell is taken as input parameter and cell voltage is found as calculating the polarization losses which are the functions of current density. In this software, three different segregated groups (concentrations, velocities and pressures) were set up; and direct solver (MUMPS) method was used for each solver. 539

95 Table 2: Initial conditions, chemical properties and operation parameters Parameter Value Molar concentration of gaseous C in O2 = oxygen at the inlet feed stream [mol/m 3 ] Molar concentration of the in C methanol at the inlet feed MEOH = 1000 [mol/m stream 3 ] Cell temperature T = 353 [K] Porosity of the FEC ε BL = 0.47 Porosity of the BLs ε BL = 0.6 Porosity of the CLs ε CL = 0.4 Porosity of membranes ε M = 0.28 Permeability of ABL Κ ABL = 1x10 11 [m 2 ] Permeability of ACL Κ ACL = 1x10 11 [m 2 ] Permeability of CBL Κ CBL = 1x10 11 [m 2 ] Permeability of CCL Κ CCL = 1x10 11 [m 2 ] Permeability of ACL Κ M = 1x10 18 [m 2 ] Permeability of FEC Κ FEC = 2x10 12 [m 2 ] Dynamic viscosity of liquid water μ H2 O = 3.6x10 4 [kg/(m. s)] Faraday s constant F = [C/mol] Electro-osmotic drag coefficient of water nd = 2.5 Anodic charge transfer coefficient α a = 0.5 Anodic charge transfer coefficient α a = 1 Universal gas constant R u = 8.314[J/molK] Reference concentration of methanol Anode reference exchange current density Cathode reference exchange current density FEC inlet flow rate Anode inlet flow rate Cathode inlet flow rate C ref O2 = 0.472[mol/m 3 ] i oa,ref = 30[A/m^2] i oc,ref =0.006 [A/m^2] Q fec=10 [ml/min] Q A= 10 [ml/min] Q C=500 [ml/min] strong convective flux within the FEC, the majority of methanol is removed from this channel, protecting the cathode. It can be seen in Fig. 6 that the local methanol concentration at the middle of the channel is very low, ~10 mol/m3, indicating a very low crossover current density. Little variation was observed between each cathode channel configuration. III.2. Oxygen concentration distribution As was discussed in Section 3.1, the velocity within the single serpentine configuration had the highest velocity within the channels. This in turn caused the concentration of oxygen to be the most uniform. As the number of channels within the flow field increases, the mean velocity within the channels decrease. As such, this caused the grid flow field to have the least uniform concentration distribution of the tested configurations. In each of the serpentine-based flow fields, the lowest concentration was achieved at the cathode exit. The grid flow field however achieved its lowest concentration on the opposing corners of the cathode inlet and outlet. III. Results and discussion In this section, the concentration of methanol in entire model and middle of the flowing electrolyte channel are observed. Methanol crossover through the cathode side which is caused by diffusion and electroosmotic drag. Effect of these methanol crossover on the performance of FE-DMFC are interpreted at high and low current densities. FEC flow rate is selected sufficient to wash away crossed methanol. The influence of the cathode flow field design for four different configuration are investigated. Pressure and velocity distribution at the middle of flow field and concentration distribution of oxygen at the middle of catalyst layer are presented for different flow field configurations. The solution of these model equations are done by COMSOL Multiphysics 5.0 which based on finite element method. III.1. Methanol concentration distribution Figure 4. Methanol Concentration of fuel cell (a. 500 A/m 2 current density, b A/m 2 current density) III.3 Pressure and Velocity Distributions As can be seen in Fig. 4, the methanol concentration field follows a decreasing trend from anode to cathode, which is attributed to the consumption of methanol within the ACL. Unreacted methanol is transported through the AM towards the cathode through diffusive and electro-osmotic driving forces. However, due the 540 To maintain the supplied cathode flow rate, a backpressure is required. In each of the four cases, shown in Fig. 8 at the middle of the cathode flow field, it can be seen that the single serpentine design had the highest pressure drop (2500 Pa), whereas the grid

, through one channel.")
96 flow field had the lowest pressure drop (14 Pa). The pressure difference for the other two configurations is 318 Pa for the parallel serpentine and 194 Pa for the three serpentine. The large difference in pressure drop for each of the cases is due to the difference in the number of bends and number of channels. In the case of the single serpentine, the supplied air only travels through one channel and makes 16 turns. Forcing the air to move at a high velocity (refer to Fig. 9 for the velocity distributions within each cathode channel configuration), through one channel. This in turn causes the air to have a high degree of momentum, requiring a high pressure difference to transport the air around the bends. Within the grid configuration, the air has a very large open area, allowing the air to move at a much smaller velocity and thus momentum. This in turn requires less pressure to move the air from the inlet to outlet. Little difference in pressure and velocity was observed at each tested current density. with constant flow rate. In three serpentine configuration, flow is seperated in three ways and transferred from inlet to outlet with lower velocity gradient. Velocitiy gradient increases rapidly when channel number desreases from three to one in paralel serpentine. In this configuration, velocity value is bigger than the other channel in the adjacent channel. At the grid configuration, fluid not forced in a certain way like other configurations; hence the distribution is seen more uniform compared to other configurations. Figure 5. Concentration of methanol in the middle of FEC (a. 500 A/m2 current density, b A/m2 current density) III.4. Velocity Distribution Figure 6. Oxygen concentration in the middle of CCL (a. serpentine, b. paralel serpentine, c. three serpentine, and d. Grid) at 500 A/m 2 current density Velocity distribution of the flow field configurations is shown in Figure 9. As the change in the velocity distributions between the low and high current densities are negligible, the results are shown in only one figure. Highest velocities are seen in the serpentine flow field configuration. This is mainly due to the fact that fluid is forced to flow in one channel 541


97 Figure 7. Oxygen concentration in the middle of CCL (a. serpentine, b. paralel serpentine, c. three serpentine, and d. Grid) at 2500 A/m 2 current density Figure 8. Pressure distribution in the middle of flow field (a.serpentine b.paralel serpentine, c.three serpentine, d.grid) 542

98 Figure 9. Velocity distribution in the middle of flow field (a. serpentine, b. paralel serpentine, c. three serpentine, and d. grid) IV. Conclusions Three dimensional, single phase FE-DMFC is modelled for serpentine, parallel serpentine, three serpentine and grid type flow field configurations. Effect of current density on the methanol concentration at the middle of FEC observed and causes are investigated. Electro osmotic drag coefficient is more effective at high current densities and it caused methanol crossover through anode to cathode side. 543 Serpentine type gives best performance which has a highest oxygen concentration, velocity and pressure differences. There is no by-passed reactant in this configuration. Mass transport rate is influenced by pressure difference between inlet and outlet. Grid type is showed lowest oxygen concentration and worse distribution of reactant due to fact that dead zones which in concentration decreases rapidly and by passing factor effects concentration directly. Acknowledgement The authors would like to thank The Scientific and Technological Research Council of Turkey (TUBITAK 213M257 project and 2216 program) for their financial support in this work. References Wang Z.H., Wang C.Y., Mathematical modeling of liquid-feed direct methanol fuel cells, J Electrochem Soc, 150, A508, (2003). Kordesch K., Hacker V., Bachhiesl U., Direct methanol air fuel cells with membranes plus circulating electrolyte, J Power Sources, 96, 200 3, (2001). Kjeang E., Goldak J., Golriz M.R., Gu J., James D., Kordesch K., A parametric study of methanol crossover in a flowing electrolyte-direct methanol fuel cell, J Power Sources, 153, 89 99, (2006). Kjeang E., Goldak J., Golriz M.R., Gu J., James D., Kordesch K., Modeling methanol crossover by diffusion and electro-osmosis in a flowing electrolyte direct methanol fuel cell, Fuel Cells, 5, , (2005). Colpan C.O., Cruickshank C.A., Matida E, Hamdullahpur F., 1D modeling of a flowing electrolytedirect methanol fuel cell, J Power Sources, 196, , (2011). Colpan C.O., Fung A., Hamdullahpur F., 2D modeling of a flowing-electrolyte direct methanol fuel cell, J Power Sources, 209, , (2012). Yang H., Zhao T.S., Effect of anode flow field design on the performance of liquid feed direct methanol fuel cells, Electrochim Acta, 50, , (2005). Jung G.B., Tu C.H., Chi P.H., Su A., Weng F.B., Lin Y.T., Investigations of flow field designs in direct methanol fuel cell, J Solid State Electrochem, 13, , (2009).
99 The Effects of Three Different Coating Techniques on the Performance of DMFCs Adnan Ozden 1*, Mustafa Ercelik 2, Yagmur Nalbant 1, Hasan Kiyik 1, Can Ozgur Colpan 1 1 Dokuz Eylul University, Faculty of Engineering, Mechanical Engineering Department, Tinaztepe, Buca, Izmir, 35397, Turkey 2 Dokuz Eylul University, The Graduate School of Natural and Applied Sciences, Mechanical Engineering Department, Tinaztepe Campus, 35397, Buca, Izmir, Turkey * [email protected] Abstract DMFCs are very appropriate for portable applications due to their ability to run efficiently at relatively low temperatures. However, there are still many improvements that need to be carried out in order to make the DMFCs more preferable especially for the portable electronics. In this study, the general structure and manufacturing techniques of Membrane Electrode Assembly (MEA) were first reviewed to identify some feasible coating techniques for DMFCs. As a result of this review, three different coating techniques, namely, brush painting, air spraying and ultrasonic coating, were chosen to be used in this study. The performance values of the MEAs manufactured by these techniques were compared with each other in a single DMFC test setup at 60 C and 80 C. The results of these experiments show that the MEA which was manufactured by using ultrasonic coating technique demonstrated the best performance with the power value of W/m 2 (at 0.3 V) and W/m 2 (at 0.3 V) at 60 C and 80 C, respectively. However, the MEA which was produced by using air spraying method provided lower performance compared to the ultrasonic coating technique with the power value of W/m 2 (at 0.3 V) and W/m 2 (at 0.3 V) at 60 C and 80 C, respectively. But, it also demonstrated better performance in comparison to MEA which was fabricated using brush painting method with the power value of W/m 2 (at 0.3 V) and W/m 2 (at 0.3 V) at 60 C and 80 C, respectively. Keywords: Direct methanol fuel cell, membrane electrode assembly, brush painting, air spraying, ultrasonic coating I. Introduction Direct methanol fuel cells (DMFCs) are very promising technologies for the application of some portable electronic devices such as laptops, mobile phones, and mp3 players due to their ability to run efficiently at the environment temperature, high energy density, and simple structure (Birry et al., 2009; Narayanan and Valdez, 2010). Another important feature of DMFCs which aparts this type of fuel cell from others is that it runs with liquid methanol. With the help of this feature, the methanol can be stored easily (Lee et al., 2009). On the other hand, there are still some obstacles towards the commercialization of DMFCs especially for portable devices such as their low performance and high cost. The only way to make the DMFCs more efficient and less costly is conducting some experimental studies on the crucial design and operating parameters and optimizing them (Kreuer, 1997; and Yang and Manthiram, 2003). In the fabrication process of MEA, different MEA coating techniques have been proposed and used by different research groups. Until today, a standard technique for coating has not need accepted due to the advantages and disadvantages of each method against each other. Some of these techniques can be given as: brush painting, air spraying, ultrasonic spraying, doctor blade and screen painting. There are mainly two different methods for coating 544 catalysts. The first method is the Catalyst Coated Substrate (CCS) (Reshetenko et al., 2006). In this method, the catalyst ink is coated directly on the backing layer. The second method is the Catalyst Coated Membrane (CCM). According to this method, the prepared catalyst ink is coated directly or via another component on the membrane (a.k.a. decal transfer method). In the literature, there are some studies on the performance of the MEAs which were produced using CCS and CCM methods (Prasanna et al., 2008). There are also some studies in the literature that compare the effect of the coating technique on the performance of the fuel cells. Most of these studies are done for proton exchange membrane fuel cell (PEMFC). For example, the MEAs which were produced by using ultrasonic coating method provided better performance than the MEAs which were manufactured using air spraying technique (Devrim et al., 2012). In another study, the air spraying method was compared with the brush painting. The results showed that the performance values of MEA which was produced by using air spraying is significantly higher than that of MEA which was fabricated by using brush painting method (Wang et al., 2006). Although, there are some research studies on the investigation of different coating techniques for the fuel cell performance, the results of these experiments vary due to the type of the fuel cells. In

100 this study, we aimed to examine the effects of the coating techniques on the performance of DMFCs. In the experiments, ultrasonic coating, brush painting, and air spraying techniques were applied to prepare the catalyst coated anode and cathode backing layers. As a result of this research, the most appropriate coating technique among the three different techniques was determined for DMFCs. II. Experimental II.1. Membrane activation process Before starting the experiments, the Nafion 115 membranes were cut down to size of 10 cm x 10 cm so as to make the membranes ready for activation process. In the activation process, the three membranes with the size of 10 cm x 10 cm were put into the 3 wt% hydrogen peroxide (H 2 O 2 ) solution and boiled for 1 hour. After the boiling process, undesired organic particles were removed from the membranes. Then, the cleaned membranes were taken from the 3 wt% H 2 O 2 solution and put into the boiling deionized water (DW). By doing this, we aimed to create another stage before putting them directly to the 5 wt% H 2 SO 4 (Sulfuric Acid wt%) solution. Then, the membranes were kept inside the boiling deionized water for 1 hour and taken from the deionized water (DW). After then, the membranes were put into the 5 wt% H 2 SO 4 solution and the temperature of the solution was increased from the room temperature to 90 C. After the one hour boiling process, the membranes were taken from the 5 wt% H 2 SO 4 solution and put into the boiling deionized water (DW). By doing this, we aimed to remove the some undesired metallic particles from the membranes. After the membrane was kept inside the boiling deionized water (DW) for 1 hour, the activation was completed (Bébin et al., 2006; Chen and Yang, 2003; Liu et al., 2006; Mao et al, 2007; Sabet-Sharghi et al., 2013 and Zhang et al., 2006). As a last step, the membranes were taken from the boiling deionized water (DW) and kept in the petri dishes for the experiments. Petri dishes were filled with water so as to keep the membrane fully soaked. During this process, we took some security precautions (wearing protective glasses, gloves and aprons) in order to protect ourselves from the hazardous effects of H 2 SO 4. Fig.1 shows the membranes which are boiling in the H 2 SO 4 solution and the activated membranes. Fig.1: (a) Membranes which are boiling in the H 2 SO solution, and (b) activated membranes II.2. Catalyst coating process One of the most important part of the experiments is the manufacting process of the MEAs. In this process, the catalyst inks were coated directly on the backing layers by using different coating techniques. These methods are: (i) ultrasonic coating, (ii) air spraying, and (iii) brushing. It was aimed to have a catalyst loading of 4 mg metal /cm 2 on both anode and cathode sides. The materials which were used in the experiments are shown in Table 1. Table 1: The MEA materials Component Material Anode backing layer Teflon treated carbon cloth (ELAT LT1400W) Anode catalyst layer HP 60 wt% Pt-Ru on Vulcan XC-72 Membrane Nafion 115 Cathode catalyst layer HP 60 wt% Pt on Vulcan XC-72 Cathode backing layer Carbon paper II.2.1. Ultrasonic coating technique In the anode catalyst ink preparation process, mg of 60 wt% PtRu/C anode catalyst was first put into the beaker. To find this number, Eq. (1) was used. In this study, we took the loading amount, weight percentage of the metal, and active area as 60 wt% and 25 cm 2 respectively. The excess ratio (C ultrasonic ) in Eq. (1) is included due to the losses during the coating process. This ratio was chosen as a small value due to the high coating efficiency of the ultrasonic spraying machine (Sono-Tek ultrasonic-spray system). As a result of lower excess ratio, the amount of wasted catalyst during the experiments was distinguishably low as compared to other experiments which were conducted by using other coating techniques. After adding the anode catalyst powder to the beaker, mg of deionized water (DW) was added to the beaker. After then, mg of Nafion solution (Ion power, Inc. LIQUIONTM Solution LQ EW 15 wt%) and mg of isoproply alcohol (TEKKIM 2-Proponal 99.5 wt%) were added to beaker, respectively. The isoporply alcohol must be added to the beaker after the deionized water (DW) so as to protect the catalyst from getting burned. Cultrasonic) (1) The prepared mixture was mixed by magnetic stirrer (ISOTEK) for 30 minutes. Then, the mixture was mixed by ultrasonic stirrer (ISOLAB, 3 lt) for 2 more hours in order to make the anode catalyst ink more homogenous. After the mixing process was completed, the mixture was put into the injector of the ultrasonic coating machine to spray the anode catalyst ink on the carbon cloth. Before the coating process, the carbon cloth was cut down to size of 5 cm x 5 cm and put on


101 the heated vacuum table (at a temperature of 50 C) to fix the location of the carbon cloth. The ultrasonic coating machine and its components are shown in Fig.2. Fig.2: Ultrasonic coating machine and its components After the coating process, the coated carbon cloth was dried at the room temperature. As the last step, the dried and coated carbon cloth was weighed in order to check whether the carbon cloth is loaded with the appropriate amount of catalyst or not. In the cathode catalyst ink preparation process, mg of 60 wt% Pt/C cathode catalyst powder was first put into the beaker. This number was found in a similar way as the calculations done for anode side. Putting the values of the loading amount weight percentage of the metal 60 wt% and active area 25 cm 2 into Eq. (2), the necessary amount of Pt/C catalyst powder was found. After adding the cathode catalyst powder to the beaker, mg of deionized water (DW) was added to the beaker. After then, mg of Nafion solution (Ion power, Inc LIQUIONTM Solution LQ EW 15 wt%) and mg of isoproply alcohol (TEKKIM 2-Proponal 99.5 wt%) were added to beaker, respectively. amount of cathode catalyst or not. II.2.2. Air spraying technique In order to prepare the anode catalyst ink, firstly, 200 mg of 60 wt% PtRu/C catalyst powder was put into a beaker. Before this, the amount of anode catalyst was determined using Eq. (3). Secondly, mg of deionized water was mixed with the anode catalyst powder in the beaker. Thirdly, mg of Nafion solution (Ion power, Inc LIQUIONTM Solution LQ EW 15 wt%) and mg of isoproply alcohol (TEKKIM 2-Proponal 99.5 wt%) were also added to the beaker. The excess ratio (C spray =20%) in the Eq. (3) was determined as a high value because in the air spray coating method, the coating accuracy is not very good. As a consequence of this, the excess ratio was chosen by taking the amount of wasting anode catalyst ink into account. (3) The mixing process of the anode catalyst ink was carried out like the process mentioned in section After the mixing process, the mixture was put into the container of the air spray to coat the anode catalyst ink on the carbon cloth by air spray. Before the coating process, the carbon cloth was cut down to size of 5 cm x 5 cm and put on the vacuum table to keep the carbon cloth at the same location and the temperature of 50 C.The air spray, backing layer, and vacuum table are shown in Fig.3. Cultrasonic) (2) The prepared cathode catalyst ink was mixed by magnetic stirrer (ISOTEK) for 30 minutes. Then, the mixture was also mixed by ultrasonic stirrer (ISOLAB, 3 lt) for 2 more hours to make the cathode catalyst ink more homogenous. After the mixing process, the cathode catalyst ink was put into the injector of the ultrasonic coating machine to spray the cathode catalyst ink on the carbon paper. Before the coating process, the carbon paper was cut down to size of 5 cm x 5 cm and put on the heated vacuum table. After the coating process, the catalyst coated carbon paper was dried at the room temperature. As a last step, the dried and coated carbon paper was weighed to control whether it is loaded with a proper 546 Fig.3: Air spray, backing layer, and vacuum table To prepare the cathode catalyst ink, firstly, 200 mg of 60 wt% Pt/C catalyst powder was mixed with mg of deionized water (DW) in the beaker. The amount of cathode catalyst powder was determined using Eq. (4). Secondly, mg of Nafion solution (Ion power, Inc LIQUIONTM Solution LQ EW 15 wt%) and mg of isoproply alcohol (TEKKIM 2-Proponal 99.5 wt%)

102 were also added to the beaker. (4) The prepared cathode catalyst ink was mixed by applying the same steps as discussed in section After the mixing process, the mixture was put into the container of the air spray to coat the cathode catalyst ink on the carbon paper by air spray. In the coating process, the vacuum table was used to keep the MEA at the same position. II.2.3. Brushing technique To prepare the anode catalyst ink, the amount of anode catalyst powder was first calculated using Eq. (5). In this equation, the excess ratio (C brush ) is taken as 20%. After the calculation, the same steps discussed in Section were applied to prepare the anode catalyst ink. After the mixing process, the mixture was put into the beaker to coat the cathode catalyst ink on the carbon paper by brush painting. Before the coating process, the carbon paper was cut down to size of 5 cm x 5 cm and put on the vacuum. II.3. Hot press process The hot press process can be considered as the last step before creating the MEA. In this process, the coated anode and cathode backing layers and the membrane are pressed to create a sandwich like structure using a hydraulic laboratory press. As mentioned earlier, in our study, three different MEAs which were produced by using three different coating methods were fabricated. In the hot press process, the same parameters (hot press temperature, pressure, and duration) were applied to the MEAs. These MEAs were hot-pressed at 120 C and 6.89 MPa for 4 minutes (Liu, 2006 and Zhao et al., 2005). Hot pressed MEAs are shown in Fig.5. Cbrush) (5) The mixing process was done by considering the same procedure as stated in section After the mixing process, the mixture was put into the beaker to coat the anode catalyst ink on the carbon cloth by brush painting. Before the coating process, the carbon cloth was cut down to size of 5 cm x 5 cm and put on the vacuum table to keep the carbon cloth at the same position and the temperature was set to 50 C.The brush, backing layer and vacuum table are shown in Fig.4. Fig.4: The brush, backing layer and vacuum table In the cathode catalyst ink preparation process, the amount of cathode catalyst powder was determined using Eq. (6). Then, the same steps were applied to prepare the cathode catalyst ink as discussed in Section (6) The mixing process was carried out using the steps which are very similar to the process mentioned in section Fig.5: Hot pressed MEAs; (a) coating with ultrasonic coating method, (b) air spraying method, and (c) brush painting method II.4. DMFC testing After the hot press process, the next step is placing the MEA into the single cell setup. If the anode and cathode sides of the MEA are not placed to the anode and cathode sides of the bipolar plates, the reaction will not occur properly. Therefore, the placement of the MEAs were carried out carefully. In addition, before placing the MEA, gaskets were placed to both the anode and cathode sides in order to prevent the cell from leaking. A crucial process before activating the DMFC is the cleaning of the anode and cathode flow channels. This process is very important for measuring the correct voltage and current values. For this purpose, the flow channels were cleaned with the help of a soft brush and deionized water (DW). By doing this, the flow channels were protected from the negative effects of undesired particles inside the channels. These particles may not only prevent us from measuring the true performance of the DMFC, but also they can be very dangerous for the flow channels because of their abrasive behavior. What is also worth mentioning is that the proper compression torques should be applied to the DMFCs. In our experiments, the compression torque of 4 N.m was used to provide proper sealing. Choosing the compression torque value is very important because applying too much compression torque may result in damaging the graphite plates. In the tightening process, the order of tightening of the 547
. Fig.6: Tightening order of the bolts Before starting to get voltage and current values from the DMFC, the activation of the MEA should be completed.")
 and oxygen with appropriate flow rates were sent through to the anode and cathode flow channels, respectively.")

103 bolts was carried out by applying the numbering scheme shown in Fig.6 (US Fuel Cell Council, 2006). Fig.6: Tightening order of the bolts Before starting to get voltage and current values from the DMFC, the activation of the MEA should be completed. Otherwise, the voltage and current values do not demonstrate the correct performance of the DMFC. In the activation process, firstly, the deionized water (DW) and oxygen with appropriate flow rates were sent through to the anode and cathode flow channels, respectively. The activation process was completed when the MEA was fully conditioned. In our experiment, the activation process took 3 hours. backing layers homogeneously. The coating techniques have a great impact on the homogeneity of the catalyst on the coated backing layers. In order to investigate the effects of different coating techniques on the performances of DMFCs, we aimed to evaluate the performance values of three different MEAs which were produced by using air spray, ultrasonic coating, and brush painting methods at two different temperatures (60 C -80 C). The polarization curves for the DMFCs manufactured by different techniques and operating at 60 C are shown in Fig.8. It can be seen from this figure that, the highest performance was achieved for the MEA which was manufactured by using ultrasonic coating technique (with the maximum power density value of W/m 2 ). However, the MEA which was fabricated using air spraying method provided slightly lower performance (with the maximum power density value of W/m 2 ). On the other hand, the lowest performance was seen for the MEA which was manufactured by using brush painting technique (with the maximum power density value of W/m 2 ). After the activation process was completed, the fuel cell temperature was set to two different temperatures (60 C and 80 C). Then, the anode and cathode flow channels were fed with 1 M methanol solution and humidified oxygen, respectively. In order to get the performance values, the computer aided test station was used. The computer aided test station is shown in Fig.7. Fig.8: The polarization curves of the MEAs operating at 60 C Fig.7: DMFC test station and its components III. Results and discussion The results for the experiments conducted at 80 C are shown in Fig.9. This figure shows that the performance of the MEA which was manufactured using ultrasonic coating method is the highest (with the maximum power density value of W/m 2 ). This performance value is significantly higher than that of the MEAs which were fabricated by using two other manufacturing techniques. The maximum power density values for the MEAs which were produced using air spray and brush painting methods are found as W/m 2 and W/m 2, respectively. In this study, the effect of the coating technique on the performance of the DMFC is assessed. It is clear that if the catalyst ink is coated on backing layers homogenously, the performance of the DMFC can be comparatively high. For this reason, the main approach may be coating the catalyst ink on the 548
, 35-42 (2005). Fig.")
104 for his help in the modification of DMFC test station, and Huseyin Devrim, Kubra Pehlivan, Omer Erdemir, and Mustafa Karakoyun from TEK-SIS for their help in the ultrasonic coating process. References Bébin P., Caravanier M., Galiano, H., Nafion /clay-so 3 H membrane for proton exchange membrane fuel cell application, Journal of Membrane Science, 278(1-2), (2005). Fig.9: The polarization curves of the MEAs operating at 80 C IV. Conclusions In this study we aimed to investigate the effects of three most common catalyst coating techniques on the performance of DMFCs. For this purpose, brush painting, air spraying and ultrasonic coating techniques were applied to evaluate the performance of MEAs operating at the temperatures of 60 C and 80 C. The main conclusions derived from the studies conducted are as follows. The MEA which was manufactured using ultrasonic coating technique provided much better performance with the power value of W/m 2 (0.3 V) and W/m 2 (0.3 V) at 60 C and 80 C, respectively, as compared to two other coating methods (air spraying and brush painting methods). The MEA with air spraying coating method demonstrated better performance with the power value of W/m 2 (0.3 V) and W/m 2 (0.3 V) at 60 C and 80 C, respectively, as compared to the MEA which was produced using brush painting method. The MEA with brush painting method showed the worst performance with the power value of W/m 2 (0.3 V) and W/m 2 (0.3 V) at 60 C and 80 C, respectively as compared to the MEA which was fabricated using brush painting technique. In conclusion, the ultrasonic coating technique can be considered as the most promising coating method among all the investigated coating methods in these experiments. Chen C. Y., Yang P., Performance of an air-breathing direct methanol fuel cell, Journal of Power Sources, 123(1), (2003). Liu F., Optimizing Membrane Electrode Assembly of Direct Methanol Fuel Cells for Portable Power, ProQuest, (2006). Liu J. G., Zhao T. S., Liang Z. X., Chen R., Effect of membrane thickness on the performance and efficiency of passive direct methanol fuel cells, Journal of Power Sources, 153(1), (2006). Mao Q., Sun G., Wang S., Sun H., Wang G., Gao Y., Ye A., Tian Y., Xin, Q., Comparative studies of configurations and preparation methods for direct methanol fuel cell electrodes, Electrochimica Acta, 52(24), (2007). Prasanna M., Cho E. A., Lim T.H., Oh, I.H., Effects of MEA fabrication method on durability of polymer electrolyte membrane fuel cells, Electrochimica Acta, 53(16), (2008). Sabet-Sharghi N., Cruickshank C. A., Matida E., Hamdullahpur F., Performance measurements of a single cell flowing electrolyte-direct methanol fuel cell (FE-DMFC), Journal of Power Sources, 230, (2013). US Fuel Cell Council, Single Cell Test Protocol (2006). Zhang J., Yin G., Wang Z., Shao Y., Effects of MEA preparation on the performance of a direct methanol fuel cell, Journal of Power Sources, 160(2), (2006). Zhao X., Fan X., Wang S., Yang S., Yi B., Xin Q., Sun, G., Determination of ionic resistance and optimal composition in the anodic catalyst layers of DMFC using AC impedance, 30, (2005). Acknowledgments This study is supported by The Scientific and Technological Research Council of Turkey (TUBITAK) with the Project number 1919B (Tubitak 2209-A program). The authors also would like to thank Dr. David Ouellette 549
105 2 The Effects of Bio-Inspired Flow Field Design on the Performance of DMFCs David Ouellette 1*, Adnan Ozden 2, Mustafa Ercelik 1, Can Ozgur Colpan 2 1 Dokuz Eylul University, The Graduate School of Natural and Applied Sciences, Mechanical Engineering Department, Tinaztepe Campus, 35397, Buca, Izmir, Turkey Dokuz Eylul University, Faculty of Engineering, Mechanical Engineering Department, Tinaztepe, Buca, Izmir, 35397, Turkey * [email protected] Abstract In this study, a numerical model was developed to understand the effects that a bio-inspired flow field has on the performance of a DMFC anode. Murray s Law was applied to determine the appropriate channel dimensions of the bio-inspired design, to maintain a constant velocity and pressure distribution within the anode flow field. The numerical results suggest that, for the same operating conditions, the serpentine flow field design yields pressure drops and crossover current densities that are each more than 2 times higher than the examined bio-inspired design, whereas both flow fields provided comparable uniformity in the methanol concentration distribution. These results suggest that bio-inspired flow fields could be of practical interest in DMFCs to improve fuel cell performance as well as reduce the auxillary pump load in DMFC stacks. Keywords: Direct methanol fuel cell, Bio-inspired design, flow field design, Murray s equation, Comsol Modeling I. Introduction In a modern society, people always face with the negative effects of drastic environmental issues. There is no denying the fact that pollution is a hot topic which is much talked about by people across the world. The solution ways for this problem has been occupying the researchers for a long time. Recent studies have shown that fuel cells, characterized by almost-zero emission levels, are promising alternatives for other power generation sources Narayanan et al. (1996). Fundamentally, fuel cells are devices which can convert the fuel's chemical energy into electrical energy efficiently. There are several kinds of fuel cells are available and their names most likely vary depending on the types of fuels and membranes. Among the other types of fuel cells, DMFCs have started to receive significant attention due to their important properties such as higher energy density, low emission, and high efficiency. In spite of all above mentioned advantages of DMFCs, there are still some obstacles in the way of their commercialization such as, their relatively low performance as compared to other types, high cost and size. However, it is possible to make some changes which can be useful for improving their performance to help them come into prominence. Functionally, the bipolar plates are responsible for connecting DMFCs electrically and physically. In other words, bipolar plates are indispensible components of DMFCs and have a huge effect on the performance of DMFCs. Therefore, it is very sagacious to optimize the general structure of the channels locating on the bipolar plates to improve the performance of DMFCs. The flow channels are responsible for distributing two different reactants efficiently and homogenously in the reaction area. That is why the design of the flow channels plays a critical role in the performance of DMFCs. Two different approaches in the flow field design which have received more attention to develop an appropriate flow field designs. According to the first approach, a net-work based optimization model was used for creating the appropriate configuration for the flow channels. To put it in a different way, a serpentine flow field profile was designed to improve flow distributions inside the flow channels. Some researchers believe wholeheartedly the opinion that serpentine flow fields have a potential for carrying the reactants to the reaction area effectively. There are some research studies which have been carried out to examine the effects of serpentine flow field design on fuel cell performance. Jung et al. (2007) compared parallel, serpentine and grid cathode profiles. They found that the serpentine profile design has a more stable and better performance than the other profiles thanks to their effective mass transfer and reactant distribution. Oleveria et al. (2010) investigated the effect of three different anode and cathode flow field designs and found that serpentine flow field designs could be promising for especially portable applications. However, another approach for developing an appropriate flow field design was using the flow channels design which was created inspiring from some natural networks due to their great potential to transport certain fluids efficiently. Many efficient natural networks such as, lung blood vessels of human lungs and leaf vein system carry some 550

, Manso et al.")
106 nutrients from a central source to a target efficiently. Leaf vein, human lung, and human blood vessel systems are shown in Fig 1, Fig.2 and Fig.3, respectively. All of them have a structure to transfer nutrients from one main source to the entire leaf or lung in an efficient way. Fig.1:Leaf vein system Fig.2: Human lung system Some researchers hold the opinion that bio-inspired flow fields have a great potential for carrying reactants efficiently and enhancing the performance of the DMFCs. There are a few research studies which have been performed so as to investigate the effects of bioinspired flow field design on fuel cell performance. Wang et al. (2010), Manso et al. (2012), and (Arbabi et al. (2012) have conducted research works on the effects of different bio-inspired designs on the performance of PEMFCs. Tüber et al. (2004) also carried out some studies to investigate the effects of different flow field designs on the performance of DMFCs and PEMFCs. The flow channels could be designed by considering the negative sides of traditional flow fields (serpentine and parallel flow fields) to distribute reactants efficiently and more homogenously. For this purpose, it is possible to design a flow field configuration which is inspired from the natural structures such as, leaf veins. If their structures are analysed carefully, it is not intriguing to see that at each generation of the leaf veins, the dimension of the vein segments generally becomes smaller so as to keep the pressure constant and carry the nutrients effectively. As far as the sources are concerned, there is a relationship between the perimeter of the daughter vessels, and this relation can be explained by Murray's law Sherman (1981). Murray's law reveals that at the location where a parent channel branches into daughter channels, the cube of the hydraulic diameter of the parent channel is equal to the sum of the cubes of the hydraulic diameters of daughter channels. In this study, Murray's law has been used to determine the channel dimensions (hydraulic diameter and diameter of the channels) of the bio-inspired configuration. Fig.3: Human blood vessel systems In the same way, in the design of the DMFCs, the flow channels must be modeled to distribute the methanol and oxygen the reaction area effectively to reach the possible highest performance. Therefore, there should be a similarity between the natural structures and the flow fields of bipolar plates in terms of functions, structures and these natural structures could be a source of inspration for the design of flow field design. 551 All things considered, although there are a few studies on bio-inspired flow field designs in the literature, it is obvious that researchers had better more pay attention to bio-inspired flow field designs to enhance the performance of fuel cells. In this study, we mainly aimed to raise awareness about the bio-inspired flow field designs to enhance the overall performance of fuel cells. More importantly, as a consequence of our studies, we proposed an optimized bio-inspired flow field design. II. Design and Experimental Study II.1. Calculation and design of the flow fields In this study, Murray's law was used in the calculation of the reqired diameters of the flow channels in order to carry reactants through the flow field effectively. Murray's law reveals that when a parent channel branches into daughter channels, the cube of the hydraulic diameter of the parent channel is equal to the sum of the cubes of the hydraulic diameters of daughter channels. In the design process of the bioinspired configuration, Murray's law was used to calculate the diameters of the channels. There are a few studies which have been conducted by using Murray's law in their flow field design. Arvay et al. Arvay et al. (2013) designed some bio-inspired flow configurations by using Murray's law and some other mathematical equations. Their aim for using


107 Murray's branching law was creating a flow channel configuration in order to balance the gas distribution and optimize the pressure drop. They reported that their nature inspired designs provided improved fuel cell performance over usual designs by improving uniform gas distribution and reducing pressure drop through the channels. Zagrofos et al. also proposed a design and they used Murray's law in order to predict the optimum ratio between the diameters of the parent and daughter vessels in networks with circular cross section software as drawing tool to design threedimensional modeling. The designed bio-inspired flow design is shown in Fig.5. One of the mathematical equations which was used in the design of our bio-inspired configuration is shown in the below Eq. (1). d d d... d d (1) d1 d2 d3 dn p Where dp is the hydraulic diameter of the parent channel and,,,..., are the hydraulic d d1 d d2 d d3 diameters of daughter channels. Because of the rectangular cross sections of the flow channels, the hydraulic diameters must be used in the above equation. The hydraulic diameters of the each channel was predicted using following Eq. (2). d H 4 AC 2 W D P W D d dn (2) where d H is the hydraulic diameter of the flow channel, Ac is the cross-sectional area of the flow channel, P is the perimeter of the channel, W is the width of the flow channel, and D is the depth of the flow channel. In our design, velocity was kept constant through the flow field area, the daughter channels which are separated from the same parent channel have the same width. For this reason, Eq. 1 was turned into Eq 3. Then, the hydraulic diameter of the related parent channel were calculated by using following Eq. (3). Fig.4: Distince between the consecutive channels Table.1: Widths and hydrolic diameters of the channels Channel No w1 d H 1 w2 d H 2 d H 3 w d 2 d d (3) p d1 d3 In this study, the width of the parents and daughter channels becomes smaller according as Murray's law. The relationships between the diameters of the certain flow channels and the distances between the certain consecutive channels are shown in Fig.4 and given in Table 1. These equations were applied to all channels in the bio-inspired flow field design. In design of the bio-inspired flow field configuration, the width of the minimum daughter channel was assumed as 0.26 mm and the width of the minimum parent channel was calculated by using above equations. The first step was calculating the hydraulic diameter of the two daughter channels by using Eq. 2. Then, the hydraulic diameter of the minimum parent channel was calculated using Eq. 1. Then, the width of the minimum parent channel was calculated by using Eq. 2. This calculation method was used for all the channels. After the calculation process, the bioinspired flow channels were designed by SolidWorks 552 Fig.5: Bio-inspired flow field design III. Numerical Modeling This model was developed in a COMSOL Multiphysics environment. It was first assumed that the flow was single phase, steady and incompressible. It was further assumed that the air flow rate within the


108 cathode was sufficiently high to prevent any mass transport limitations within the cathode. Therefore, the model only examines the AFC, ABL and ACL. This last assumption also helped to more than halve the computational costs associated with solving this model. As the model, without the membrane and cathode, required more than 8x10 6 elements to be solved. densities, due to the incompressible assumption within the model, and low consumption rate within the ACL in comparison to the introduction rate of fuel within the Using these assumptions, this allowed the conservation of mass, momentum and species to be solved. These equations are given by Eqs. (1) (3), respectively. u S gen (1) u T 2 u I u u u (2) I P 2 3 u Sgenu g 2 K M M M D C u C S (3) M l l l Even though the cathode is not explicitly modeled, the methanol crossover flux is still accounted for as a local diffusive and electro-osmotic flux at the ACL-M interface, as shown below. This equation also serves as a boundary condition to solve Eq. (3). i N M M M M M (4) xover De Cl xl nd F III.1 Boundary Conditions To solve Eqs. (1) to (3), 6 boundary conditions were needed. These included: gen No slip conditions (u = 0) on all channel walls A slip condition was set at the ACL-M interface A methanol crossover flux, given by Eq. (4) was set at the ACL-M interface An outlet gauge pressure of 0 Pa was set at the AFC outlet A known inlet velocity and methanol concentration was placed at the AFC inlet. The inlet methanol concentration and flow rate were set to 2000 mol m -3 and 5 ml min -1, with a cell temperature of 80 C. IV. Result and conclusions IV.1 Pressure and Velocity The pressure drop from inlet to outlet is primarily driven by hydrostatic pressure, where the result is estimated to be 467 Pa, as shown in Fig. 6a. This distribution drops linearly from inlet to outlet. If the hydrostatic pressure is subtracted from the overall pressure, as depicted in Fig. 6b, the pressure drop becomes 3.54 Pa. The primary reason for this low pressure is due to the low velocity (on the order of 1 mm s -1 ) within the bifurcated channels. No significant difference in pressure was found between current 553 Fig. 6: The pressure distribution within the AFC. a) Accounts for the hydrostatic pressure, whereas b) Does not account for the hydrostatic pressure. Both scales are measured in [Pa]. AFC. Due to the low pressure drop, this suggests that this configuration could be useful for DMFC stack applications, where very large pressure drops could be observed due to the large number of bipolar plates. As for the velocity distribution within the AFC, shown in Fig. 7, it was found that as the fuel traveled along the primary channel, the velocity decreased. This is primarily attributed to the bifurcation of mass into each daughter channel, reducing the mass flow within the main channel. The opposite trend is observed along the other half of the flow field. Also, since there is a higher pressure difference across the initial daughter channels, these daughter channels have a higher flow rate in comparison to the remaining daughter channels. For example, outermost daughter channels have a mean velocity (u = 2 u max /3) of 2.8 mm s -1, whereas the innermost daughter channels have a mean velocity of 1 mm s -1.


109 Fig. 7: The velocity magnitude distribution within the AFC, both for the full range and narrow range of values to highlight the velocities within the daughter channels. The units within the scale are [m s -1 ]. IV.2 Methanol Concentration and Crossover The methanol concentration distribution is shown in Fig. 8 for cell current densities of 500 A m -2 and 2000 A m -2. At 500 A m -2, there was ~100 mol m -3 drop in methanol. However, between the daughter channels, near the 90 bends, the methanol concentration dropped by ~6.5% at the ACL-M interface, relative to the same location, but under the channel. At a higher current density of 2000 A m -2, this relative difference became more noticeable, with a relative difference of ~36%. This is largely due to the increased consumption rate and mass transport resistances within the ABL and ACL associated with higher current densities. These locations could be problematic as the model suggests that these regions would be the first to reach a zero concentration. A potential solution to this issue could be to round the bends and ensure that the center-to-center distance is consistent at all locations along the daughter channels path. Fig. 8: Comparison of the methanol concentration distribution at the ACL-M interface at a current density of a) 500 A m -2 and b) 2000 A m -2. The scales in both cases are in units of [mol m -3 ]. Between both scenarios, it was found that the crossover current density of methanol was rather low (a maximum of 1100 A m -2 and 350 A m -2 at an operating current density of 500 A m -2 and 2000 A m -2 respectively) incomparison to values published in literature, which is generally on the order of A m -2. These lower crossover current densities could be attributed to the difference in the supplied methanol s residence time within the fuel cell. In this configuration, the residence time is ~14.5 s, whereas one for a single channeled serpentine flow field (which seems to be one of the most common flow fields used in literature) would have a residence time of ~24 s, which corresponds well with the difference in crossover current densities. The highest crossover current densities were observed near the AFC inlet due to the locally higher methanol concentrations at the ACL-M interface. The lowest crossover current densities were observed near the AFC outlet and 90 bends, due to the locally lower methanol concentrations at the ACL-M interface. 554
 for their financial support in this work. References Arbabi, F., Numerical Modeling of an Innovative Bipolar Plate Design Based on the Leaf Venation Patterns for PEM Fuel Cells.")
. Elsevier Ltd: 3717 26. (2013). Chen, C. Y., and P. Yang.")
110 Acknowledgements The authors thank TUBITAK (The Scientific and Technological Research Council of Turkey, contract number: 213M257, and their research fellowship programme for international researchers, 2216) for their financial support in this work. References Arbabi, F., Numerical Modeling of an Innovative Bipolar Plate Design Based on the Leaf Venation Patterns for PEM Fuel Cells.,International Journal of Engineering 25 (3 (C)): (2012.) Arvay, A., J. French, J. C. Wang, X. H. Peng, and A. M. Kannan. Nature Inspired Flow Field Designs for Proton Exchange Membrane Fuel Cell. International Journal of Hydrogen Energy 38 (9). Elsevier Ltd: (2013). Chen, C. Y., and P. Yang., Performance of an Air- Breathing Direct Methanol Fuel Cell. Journal of Power Sources 123 (1): (2003) Chen, R., T. S. Zhao, and J. G. Liu., Effect of Cell Orientation on the Performance of Passive Direct Methanol Fuel Cells. Journal of Power Sources 157 (1): (2006) Fig. 9: Comparison of the crossover current density at the ACL-M interface at a cell current density of a) 500 A m -2 and b) 2000 A m -2. The scales in both cases are in units of [A m -2 ]. V. Conclusions A COMSOL Multiphysics model was developed to examine the effects that a bio-inspired flow field configuration has on the performance of a DMFC. Murray s Law was applied to determine the channel dimensions and it was found that using this approach, a very low pressure drop (3.54 Pa) could be obtained. This could help increase the balance of plant of a DMFC stack, as smaller pumps would be required. Furthermore, the model suggests that this configuration would yield lower methanol crossover fluxes (~1/2) incomparison to traditional flow field designs. However, between the channels 90 bends seems to be potentially problematic, as the methanol concentration in these locations could be the first to be mass transport limited, reducing the overall cell s performance. In further studies, an experimental and numerical comparison will be made between a wide array of flow fields that do and do not obey Murray s Law. An optimization of Murray s Law-based flow field designs will also be conducted. It is hoped that these two studies will help determine if Murray s Law is indeed a viable flow field design tool for DMFCs. 555 Jung, Guo B., Ay Su, Cheng Hsin Tu, Yur Tsai Lin, Fang B. Weng, and Shih Hung Chan., Effects of Cathode Flow Fields on Direct Methanol Fuel Cell- Simulation Study.,Journal of Power Sources 171 (1): (2007). Liu, J. G., T. S. Zhao, Z. X. Liang, and R. Chen., Effect of Membrane Thickness on the Performance and Efficiency of Passive Direct Methanol Fuel Cells., Journal of Power Sources 153 (1): (2006) Manso, A. P., F. F. Marzo, J. Barranco, X. Garikano, and M. Garmendia Mujika., Influence of Geometric Parameters of the Flow Fields on the Performance of a PEM Fuel Cell. A Review. International Journal of Hydrogen Energy 37 (20). Elsevier Ltd: (2012) Mao, Qing, Gongquan Sun, Suli Wang, Hai Sun, Guoxiong Wang, Yan Gao, Aiwei Ye, Yang Tian, and Qin Xin. Comparative Studies of Configurations and Preparation Methods for Direct Methanol Fuel Cell Electrodes. Electrochimica Acta 52 (24): , (2007) Narayanan, S.R. and Kindler, A. and Jeffries- Nakamura, B. and Chun, W. and Frank, H. and Smart, M. and Valdez, T.I. and Surampudi, S. and Halpert, G. and Kosek, J. and Cropley, C., Recent Advances in PEM Liquid-Feed Direct Methanol Fuel Cells, , (1996). Oliveira, V. B., C. M. Rangel, and A. M F R Pinto.
111 Effect of Anode and Cathode Flow Field Design on the Performance of a Direct Methanol Fuel Cell. Chemical Engineering Journal 157 (1): (2010). Sabet-Sharghi, Nasim, Cynthia Ann Cruickshank, Edgar Matida, and Feridun Hamdullahpur., Performance Measurements of a Single Cell Flowing Electrolyte-Direct Methanol Fuel Cell (FE-DMFC). Journal of Power Sources 230. Elsevier B.V: (2013). Sherman, T F., On Connecting Large Vessels to Small. The Meaning of Murray s Law. The Journal of General Physiology 78 (4): , (1981). Tüber, K., A. Oedegaard, M. Hermann, and C. Hebling. Investigation of Fractal Flow-Fields in Portable Proton Exchange Membrane and Direct Methanol Fuel Cells. Journal of Power Sources 131 (1-2): (2004) US Fuel Cell Council. Single Cell Test Protocol., (2006) Wang, Chin Tsan, Yuh Chung Hu, and Pei Lun Zheng. Novel Biometric Flow Slab Design for Improvement of PEMFC Performance. Applied Energy 87 (4). Elsevier Ltd: ,(2010) Zhang, Jian, Geping Yin, Zhenbo Wang, and Yuyan Shao. Effects of MEA Preparation on the Performance of a Direct Methanol Fuel Cell. Journal of Power Sources 160 (2): (2006) 556
112 FLUID MECHANICS, HEAT AND MASS TRANSFER 557
113 Diesel-Like Fuel from Waste Engine Oil by Thermo-Catalytic Pyrolysis Tarabet Lyes 1*, Maamouri Mohamed 1, Zouad Youcef 1, Khiari Karim 1, Mahmoud Rachid 1, Mohand Tazerout 2 1 LGP, Ecole Militaire Polytechnique, BP 17 Bordj El Bahri 16046, Algeria. 2 GEPEA, UMR 6144, DSEE, Ecole des Mines de Nantes, Rue Alfred Kastler Nantes 44307, France. * [email protected] Abstract Waste lubrication engine oil is an increasing economic and environmental problem as such there is a great need to process this waste and reduce its environmental impact. For this purpose, the pyrolysis of waste lubrication engine oil is investigated using both thermal and catalytic cracking techniques where various catalyst types have been tested. The experiments are conducted at atmospheric pressure in a batch reactor operated within the temperature range of room temperature to 550 C. In this work, the optimum reaction conditions (reaction temperature, feed rate and catalyst quantity) are examined for the high yield of pyrolysis oil and to analyze the oil composition qualitatively and quantitatively. Density, viscosity, higher heating value, volatility and flash point for each sample are examined. It is shown that the addition of a catalyst in the reaction leads to increase the condensed liquid fraction (>92%) with an improvement of all physicochemical characteristics, particularly when MgO catalyst is combined with CaCO3 and NaCO3 with a ratio of 3%. Our results indicate that the pyrolysis process shows exceptional promise as a means for treating problematic waste oil and providing diesel like fuel with significant commercial value. Keywords: Waste engine oil, catalytic pyrolysis, diesel like fuel I. Introduction In recent years, diminishing of fossil fuel sources, growing of demand and cost of petroleum-based fuels, and environmental hazards as a result of burning of them have encouraged researchers to investigate possibility of using alternative fuels instead of the fossil fuels. Therefore, the researchers have focused on finding alternative new energy resources and utilizing them. Many research works addressed the utilization of waste oils that are of lubricating oils originated from crude oil and biomass origin waste oils for the case of diesel engine applications as sources of energy. The production of waste automotive engine oil is estimated at 24 million tons each year throughout the world, posing a significant treatment and disposal problem for modern society. The waste oil, containing a mixture of aliphatic and aromatic hydrocarbons, also represents a potential source of high-value fuel and chemical feedstock. The preferred disposal options in most countries are incineration and combustion for energy recovery, and vacuum distillation and hydro-treatment for re-refining the waste oil Brinkman DW and Dickson JR (1995). However, these disposal routes recover only the chemical value of the waste and they are becoming increasingly impracticable as concerns over environmental pollution, and the difficulties and additional costs of sludge disposal Ramasamy KK and T-Raissi A (2007) are recognised due to the undesirable contaminants present in waste oil Brinkman DW and Dickson JR (1995). Pyrolysis techniques have recently shown great promise as an economic and environmentally friendly disposal method for waste oil Song G-J et al. (2010), Lam SS et al. (2010) and Sinag A et al. (2010). The main advantage of pyrolysis is that it could deal with waste, which is otherwise difficult to be recycled. The waste material is thermally cracked and decomposed in an inert atmosphere, with the resulting pyrolysis liquid and gaseous fractions able to be used as a fuel or chemical feedstock, and the char produced used as a substitute for activated carbon, though such practice is yet to become popular. The pyrolysis oil produced is of particular interest due to its easy storage and transportation as a liquid fuel or chemical feedstock. The oil can be catalytically upgraded to transport-grade fuels, or added to petroleum refinery feedstocks for further processing Lam SS et al. (2010). Pyrolysis is, in general, an endothermic process that implies many reactions such as cracking, dehydrogenation, and cyclisation/ aromatization which are affected by temperature. Therefore, temperature has a considerable effect on the products and conversion rate and, for this reason, it is the governing factor/parameter. In addition, other parameters such as heating rate (HR), particle size, pyrolysis time and volatile residence time involved in the process also have remarkable effects Ramasamy KK and T-Raissi A (2007). For this reason, depending on the final objective of the pyrolysis, it is necessary to find the optimal conditions for the feedstock. Most of the literature reports focus on pyrolysis using conventional electric resistance, microwave and electric arc heating Song G-J et al. 558
 on the yield and characteristics of the pyrolysis oils produced from electric-heated pyrolysis of the")

114 (2010), Sinag A et al. (2010), Nerin C et al. (2000) and Gomez-Rico MaF et al. (2003). This study investigates the influence of process parameters (catalyst type and heating source) on the yield and characteristics of the pyrolysis oils produced from electric-heated pyrolysis of the waste engine oil, with a focus on their elemental and hydrocarbon composition, and potential fuel properties. These evaluations are important to assess the technical feasibility and applicability of the pyrolysis process as a route to energy recovery/feedstock recycling from waste oil. II. Experimental section II.1.Materials The waste lubricant oil used in the present study is 5W40 which is collected from local auto shop. The obtained waste lubricant oil is highly viscous, then is filtered using qualitative filter paper and is centrifuged with the rotation speed of 2000 rpm for 30 min to remove any remaining particulates (i.e. metal particles, carbon soots, and other impurities). The treated waste lubricant oil then is used as a sample for thermal and catalytic treatment in present study. The thermal treatment of waste lubricant oil is carried out in the absence of catalyst. The produced vapour pushes itself out into a water-cooled (15 C) condenser, where liquid fraction is condensed in the receiving flask. Non-condensing gases will be analyzed in a future study in order to identify the gas composition. The conversion of waste oil to pyrolysis oil started to occur when the operating temperature is above 400 C, where over 50 wt.% of the product is a viscous oil mixture. The maximum conversion of waste oil is accomplished at 550 C, during which P67 wt.% of the waste oil is transformed into pyrolysis oil. The pyrolysis oil obtained at 550 C is a fairly pale brownwish-gold hydrocarbon liquid (Fig. 2) containing a small amount of dark solids. It is thought that these solids derived from the small quantities of very fine carbon particles originally present in the pyrolysis reactor; these are likely to escape from the reactor and co-migrate with the pyrolysis oil. These particles are then removed by filtration. The pyrolysis oil is observed to be much less dense and viscous compared to the waste oil, indicating the cracking of heavy hydrocarbon chains in the waste oil to lighter fragments by the electric-heated pyrolysis. Then the liquid is characterized (density, viscosity, flash point, calorific value and GCMS). The experiments are conducted at atmospheric pressure in a batch reactor operated within the temperature range of room temperature to 550 C. Depending on the applied heating rate, the operation time varied between 90 and 120 min. The reactor is made of stainless steel, 20 cm height and 15 cm in diameter, heated by an electrical heating system, the temperature of which is regulated. The temperature is measured and controlled with a thermocouple placed in the center of the reactor and connected to a temperature controller. The reactor is purged using a 100 ml/min nitrogen flow for 30 min at the beginning of each experiment. To make sure that the system is full with inert gas and no oxidation process will take place, gas analysis is done at the end of purging. Simple schema about the purolysis system is shown in Fig. 1. Fig. 2: Fuel oil recovered from waste engine oil II.2.Procedure Fig. 1: Schematic layout of electric-heated pyrolysis system 559 The thermal cracking experiment is carried out without any catalyst. The catalytic cracking experiments are carried out with four different catalyst types (SiO2, MgO, CaCO3, NaCO3) in order to compare the efficiency in bio-oil production when the reaction takes place in liquid phase and in gaseous phase. The catalyst quantity used is in the range of wt.% of the waste engine oil. The maximum quantity is limited at 3 wt.% considering the economical feasibility of the process. The procedures of thermal cracking and catalytic cracking are similar in all experimental schemes. A batch reactor containing 120 g of waste oil is weighed and the
115 catalyst is added accordingly. The batch reactor is placed in an electrical heater and a thermocouple is inserted through the center of the reactor. The heater is switched on and the temperature is regulated gradually, ranging from room temperature to 550 C with 3-5 C/min. The condensed liquid product is separated into two fractions, the aqueous and the organic phase respectively. The reaction products are classified into three groups: gas, pyrolytic oil and residual coke. The yield of pyrolytic oil is defined as the amount of liquid collected whereas the yield of residual coke is the amount of char remaining in the reactor after the experiment, while the gas yield is obtained by differentiating above both yields of liquid and solid fractions. Tab 1: Test catalyst conditions Catalyst amount case Catalyst (wt.% of WEO) A Without 0.0 B SiO C MgO 1.0 D CaCO E NaCO F SiO 2, MgO, NaCO G SiO 2, MgO, NaCO H SiO 2, MgO, NaCO I SiO 2, MgO, NaCO II.3.Fuel properties measurement The oil fraction obtained from thermal/catalytic cracking process is analyzed to measure its fuel properties. Density, viscosity, higher heating value and sulfur content for each sample are examined. The density measurement is conducted at room temperature using a mass balance and measuring glass to determine its mass weight and volume respectively. The viscosity measurement is performed using Vibro Viscometer and SV-100 at temperature interval ranging from 0 C to 40 C. In order to obtain the cold temperature, the sample is stored in a freezer for at least 6 h prior to the analysis. The higher temperature is obtained by heating the sample in a water bath heater. The higher heating value of each sample is determined using a calorimetric bomb (Parr Calorimeter Model 6200). The flash point is measured using an automated PenskyeMartens model NPM 440, following the guidelines of the ASTM D93. Sulfur content is determined by a LAB X3500 apparatus, according to the ASTM D1552. As a reference, the fuel properties of the diesel fuel are examined as well. The elemental compositions of the main elements in the biofuel (carbon, hydrogen, nitrogen and oxygen) are determined using an Elemental Analyzer (Flash EA 1112, CE Instruments). In order to identify the composition of the oil fraction, a MS/GC analysis was carried out. In this purpose, a Perkin Elmer Turbo Mass Spectrometer coupled with a gas chromatograph CLARUS 500 is used. The column is SBLTM-5ms capillary type, 30 m in length and 0.25 mm in internal diameter. The detector temperature is 350 C, and the injector temperature is 250 C. III. Results and discussion III.1.Thermal craking The thermal cracking is carried out at a heating rate in the range of slow pyrolysis process which is around 3-5 C/min. In this operation, the water vapor starts to form and cames out from the reactor at temperature between 110 C to 150 C. Starting from 300 C, a small quantity of dark brownish liquid oil is collected in the condenser line. Between 400 C and 500 C, the pyrolysis oil production becomes faster since the waste engine oil quantity hasn t been depleted. When the pyrolysis-oil production started, more energy is required to break down higher molecular weight compounds remaining in the waste engine oil. Therefore, at a constant heating rate, the temperature rise tends to be more slowly compared to the initial stage of pyrolysis process. The overall properties of the pyrolysis oil and material balances for thermal cracking process are presented in Table 2. Except the flash point and viscosity, it is shown that the pyrolysis oil properties are within the limits prescribed by ASTM D975 American requirements. The results from elemental analysis show that the electric-heated pyrolysis of waste engine oil generates pyrolysis oil with carbon and hydrogen as main elements, whereas nitrogen, sulphur, and oxygen are detected in very low concentrations. The carbon and hydrogen are mainly from the base oils from which the lubricating oil is formulated, whereas nitrogen, sulphur and oxygen are likely to originate from the additives (e.g. antioxidants) present in the engine oil Audibert F (2006). The low content of sulphur in the waste oil suggests that sulphur originally present in engine oil is likely to have reacted with oxygen in the air to form sulphur oxides, which subsequently escape to the atmosphere during engine operation. The pyrolysis oil shows a much lower content of oxygen and a significantly higher H/O atomic ratio. The reduction in oxygen content is also likely to be due to decarboxylation commonly occurring during thermal treatment processes; this agrees with the findings of Sinag et al. (2010). The low oxygen content in the pyrolysis oil represents a favourable feature in producing a potential fuel source with high calorific value. The H/C atomic ratio is a good indicator of the existence of hydrocarbons in the pyrolysis oil, and the variations in the ratio indicate the different levels of saturation in the CAC bonds. The pyrolysis oil contain a lower sulphur content; this suggests that sulphur, although present in very low concentrations in waste oil, is likely to have reacted with oxygen during 560
, which remain in the carbon bed; these reactions lead to decreased sulphur content in the pyrolysis-oils.")
 -36-15 -21 Viscosity at 40 C (mm 2 /s) 1.9 4.1 10.63 Cetane number 40-60.96 Elementary composition Carbon (wt.%) Hydrogen (wt.%) Oxygen (wt.%) Nitrogen (wt.%) Sulfur (wt.")

116 pyrolysis to form sulphur oxides. In addition, new sulphur compounds may be formed during pyrolysis, e.g. metal or non-volatile inorganic sulphides Ucar S et al. (2005) and Lazaro MJ et al. (2000), which remain in the carbon bed; these reactions lead to decreased sulphur content in the pyrolysis-oils. Tab 2 : Pyrolysis oil properties with standard limits property Limits Min Max PO Density at 15 C Flash point ( C) LHV (MJ/kg) / / 43.8 Cold temperature ( C) Viscosity at 40 C (mm 2 /s) Cetane number Elementary composition Carbon (wt.%) Hydrogen (wt.%) Oxygen (wt.%) Nitrogen (wt.%) Sulfur (wt.%) Product yield Pyrolysis oil Gas Residue III.2.Catalyst type effect / / / / The overall material balances and production yield for catalytic cracking process with various catalyst types are presented in Fig. 3, as compared to the thermal cracking process. It is shown that using any used catalyst at 1% by wt. in the waste engine oil pyrolysis leads to the increase in the pyrolysis oil quantity. Regarding the catalyst type, the highest pyrolysis-oil production yield is found in the process in which SiO2 catalyst is used. In the catalytic reaction system, the char and metal particles yield is found in the range of 2 3 wt.%, while the gaseous fraction yield is 4 wt. % for SiO2 and 13 wt. % for CaCO3. fuel (2-4 mm 2 /s). This is may be due to the higher boiling range of the pyrolysis oil than that of diesel fuel. This indicates that the pyrolysis oil contains certain heavier fragments of long chain hydrocarbon components (i.e. higher boiling point components) that those of diesel. Further treatment may be needed to reduce the viscosity of the pyrolysis oil to a value comparable to diesel since a lower viscosity is necessary and represents a favourable feature for diesel engine fuelling. Fig. 4: Catalyst type effect on the pyrolysis oil viscosity Fig. 5 shows the catalyst type effect on the pyrolysis oil sulphur content. In all cases, the sulphur content of the pyrolysis oil obtained ( % by wt.) is found to meet internationally prescribed standards for unleaded petrol and diesel fuels (0.15% by wt.). For the catalytic reaction system, the sulfur content is decreased, particularly when NaCO3 catalyst is used. The use of fuel derived from these low-sulphur pyrolysis oils can potentially lead to a reduction of SOx emissions compared to fossil fuels. Fig. 3: Catalyst type effect on Product yields Fig.4 shows the effect of the catalyst use (at 1% of the waste engine oil total mass) on the pyrolysis oil viscosity. The pyrolysis oils obtained by catalytic process possess lower kinematic viscosities (around 9 mm 2 /s) than that of thermal reaction (10.63 mm 2 /s), however are considerably higher than that of diesel 561 Fig. 5: Catalyst type effect on the pyrolysis oil sulfur content The catalyst type effect on the pyrolysis oil flash point is shown in Fig. 6. The flash points of the pyrolysis oils, obtained by pyrolytic way, are all found to be higher than that of thermal cracking process but lower than that of diesel (67 C) and the limits prescribed by the international requirements. Similar findings have been reported by other workers.

, as compared to cases where the catalysts are used separetly at 1% ratio.")


117 CaCO3 catalyst provides the higher flash point (around 41 C), as compared to the other used catalysts. The low flash points suggest that the un-refined pyrolysis oils contain components that have a lower boiling point range than diesel. Fig. 6: Catalyst type effect on the pyrolysis oil flash point ratio than 1.5% of the total mass of the waste engine oil leads to an increase in the pyrolysis oil viscosity (more than mm 2 /s), as compared to cases where the catalysts are used separetly at 1% ratio. However, when the catalysts blend amount is increased up to 3%, the pyrolysis oil viscosity is found the lowest (around 8.7mm 2 /s), which unfortunately still higher than that of diesel fuel. Using this pyrolysis oil with high viscosity in diesel engine certainly causes poor fuel atomization and low volatility, leading to incomplete combustion and severe engine deposits, injector coking and piston ring sticking Ramadhas AS at al. (2005), Pramanik K (2003) and Silvico CA et al. (2002). Several techniques could be used to overcome these problems such as preheating the oil Kumar MS et al. (2006), oil micro emulsification Senthil Kumar M and Jaikumar M (2014) and blending or diluting the oil with other conventional fuel Ndayishimiye P et al (2011). III.3.Catalyst amount and combination effects In order to further improve the both failed properties of the pyrolysis oil (flash point and viscosity), catalytic cracking process is now carried out by combining the catalysts, used previously, at several ratios. Fig. 7 outlines the effect of combining SiO2, MgO and NaCO3 catalysts at various ratios (0.3, 0.6, 1.5 and 3% of the total mass of the waste engine oil) on the fraction of waste oil converted to pyrolysis gases, pyrolysis oil and char residues. Fig. 8: Catalyst amount and combination effect on viscosity Fig. 7: Catalyst amount and combination effect on Product yields The combination of 3 catalysts demonstrates a minor influence on the pyrolysis oil yield, which is kept around 90%. However, the increase of the catalyst amount up to 9% of the total mass of the waste oil resultes in an increased yield of pyrolysis oil (95%) to the detriment of the gaseous fraction. The effect of the catalyst amount and the combination of SiO2, MgO and NaCO3 catalysts on the pyrolysis oil viscosity is shown in Fig. 9. It is depicted that using a blend of catalysts at a lower 562 Fig. 9: Catalyst amount and combination effect on flash point The effect of catalysts blend amount on the pyrolysis oil flash point is shown in Fig. 9. It is depicted that the flash point of the pyrolysis oil is considerably improved, particularly when the amount of the catalysts blend is higher than 3% of the total mass of waste engine oil. The flash point value could reach 85 C with 9% catalysts blend amount. This higher value than that of diesel (67 C) is desirable and represents a favourable feature when it comes to
118 handling and transportation. IV. Conclusions In this present work, it is demonstrated that both thermal and catalytic cracking methods are capable of valorizing waste engine oil into diesel-like fuel. The use of these methods not only gives a considerable overall yield but also significantly improves the fuel properties of waste engine oil in terms of viscosity, flash point, as well as sulfur content. The use of three different catalysts in the catalytic cracking process gives various results in terms of production yield and fuel properties. Except the flash point, the addition of catalyst quantity in the catalytic cracking process does not significantly affect the overall production yield and its fuel properties. From the production yield point of view, SiO2 turns out to be the most effective catalyst. Taking into account the yield and fuel quality, the catalytic cracking process by using SiO2, MgO and NaCO3 as blend attains its highest effectiveness with the catalyst quantity of 3 wt.% of total mass of waste engine oil. Except viscosity, the fuel quality of bio-oils produced, using these catalysts, is the closest in comparison with the conventional diesel fuel. Based on the overall results, the catalytic cracking process is selected to produce fuel that will be tested in a diesel engine in order to evaluate its performance and pollutant emissions. References Audibert F. Waste engine oils: rerefining and energy recovery. 1 st ed. Amsterdam: Elsevier B.V; Brinkman DW, Dickson JR, Contaminants in used lubricating oils and their fate during distillation/hydrotreatment re-refining, Environ Sci Technol 29, 81 86, (1995). Gomez-Rico MaF, Martin-Gullon I, Fullana A, Conesa JA, Font R, Pyrolysis and combustion kinetics and emissions of waste lube oils, J Anal Appl Pyrol, 69, , (2003). Kumar MS, Kerihuel A, Bellettre J, Tazerout M, A comparative study of different methods of using animal fat as a fuel in a compression ignition engine, J Eng Gas Tur Pow, 128, , (2006). (2000). Ndayishimiye P, Tazerout M, Use of palm oil-based biofuel in the internal combustion engines: Performance and emissions characteristics, Energy, 36, , (2011). Nerin C, Domeno C, Moliner R, Lazaro MJ, Suelves I, Valderrama J. Behaviour of different industrial waste oils in a pyrolysis process: metals distribution and valuable products, J Anal Appl Pyrol, 55, , (2000). Pramanik K, Properties and use of jatropha curcas oil and diesel fuel blends in compression ignition engine, Renewable Energy, 28, , (2003). Ramadhas AS, Jayaraj S, Muraleedharan C. Characterization and effect of using rubber seed oil as fuel in the compression ignition engines, Renewable Energy, 30, , (2005). Ramasamy KK, T-Raissi A. Hydrogen production from used lubricating oils. Catal Today, 129, , (2007). Senthil Kumar M, Jaikumar M. A comprehensive study on performance, emission and combustion behavior of a compression ignition engine fuelled with WCO (waste cooking oil) emulsion as fuel. Journal of the Energy Institute, 87, , (2014). Silvico CA, Carlos R, Marious VG, Leonardodos SR, Guilherme F, Performance of a diesel generator fuelled with palm oil, Fuel, 81, , (2002). Sinag A, Gulbay S, Uskan B, Ucar S, Ozgurler SB. Production and characterization of pyrolytic oils by pyrolysis of waste machinery oil. J Hazard Mater, 173, , (2010). Song G-J, Seo Y-C, Pudasainee D, Kim I-T. Characteristics of gas and residues produced from electric arc pyrolysis of waste lubricating oil. Waste Manage, 30, , (2010). Ucar S, Karagoz S, Yanik J, Saglam M, Yuksel M. Copyrolysis of scrap tires with waste lubricant oil. Fuel Process Technol, 87, 53 58, (2005). Lam SS, Russell AD, Chase HA, Pyrolysis using microwave heating: a sustainable process for recycling used car engine oil, Ind Eng Chem Res 49, 45 51, (2010). Lam SS, Russell AD, Chase HA, Microwave pyrolysis, a novel process for recycling waste automotive engine oil, Energy, 35, , (2010). Lazaro MJ, Moliner R, Suelves I, Nerin C, Domeno C. Valuable products from mineral waste oils containing heavy metals, Environ Sci Technol, 34, , 563
119 MHD Natural Convection and Entropy Generation in a Nanofluid Filled Cavity with a Conductive Partition Abstract Fatih Selimefendigil 1*, Hakan F. Oztop 2 1 Celal Bayar University, Department of Mechanical Engineering, Manisa, 45140, Turkey 2 Firat University, Department of Mechanical Engineering, Technology Faculty, Elazığ, 23119, Turkey * [email protected] In this study, MHD natural convection in partitioned cavity filled with different nanofluids (Al2O3--water and CuO-water) on different sides of the partition is numerically investigated. The left and right vertical walls of the square enclosure are maintained at constant hot and cold while other walls are assumed to be adiabatic. Different combinations of Hartmann numbers are imposed in the left and right half cavities filled with different nanofluids. The governing equations are solved with finite element method. Numerical simulations are performed for different values of Grashof numbers, thermal conductivity ratio of the partition to the fluid Hartmann number and solid volume fraction of the nanofluid. The averaged heat transfer enhances with Grashof number, thermal conductivity ratio and solid nanoparticle volume fraction whereas it deteriorates with magnetic field. Second law analysis of the systems with different combinations of parameters was also performed. Keywords: MHD flow, nanofluids, partition, finite element I. Introduction Natural convection in cavities may be encountered in various engineering applications such as heat exchangers, cooling of electronic devices, chemical reactors solar collectors and many others (Ostrach (1988)). Partial or full partitions are added to control the natural convection inside the cavities. Alhazmy (2010) presented an approach to reduce the natural convection inside the cavities of hollow bricks by inserting the cell dividers and studied the problem numerically. Mamou et al. (1994) numerically and analytically investigated the natural convection in a tilted enclosure with fluid layer separated by finite thickness solid partitions. They predicted the averaged Nusselt number in terms of Rayleigh number, thermal conductivity ratio, solid partition thickness and number of partitions. Magnetic field effect on the heat transfer and fluid flow may have importance for the coolers of nuclear reactors, purification of molten metals micro-electronic devices and many others. External magnetic field were imposed to control the heat transfer and fluid flow characteristics in various systems (Rahman et al. (2010), Selimefendigil and Oztop (2014a)). In heat transfer applications, nano-sized particles of high thermal conductivity are added to the base fluid such as water or ethylene glycol to increase thermal transport and enhance the heat transfer. The particle size varies between 10 and 100 nm and different shape of particles can be considered. A vast amount of literature is dedicated to obtain correlations for thermophysical properties of these special type fluids called nanofluids and to investigate the performance of thermal systems using the nanofluids (Selimefendigil and Oztop (2013, 2014b,c), Sheikholeslami et al. (2012)). Second law analysis with entropy generation is important for system performance and several studies have been conducted to investigate the entropy generation within cavities (Basak et al. (2012), Varol et al. (2009), Bhardwaj and Dalal (2013)).The available energy destruction can be quantified by the measurement of irreversibly during a process which is called entropy generation rate. The performance of the system can be increased by using the entropy generation minimization concept (Bejan (1980)). A review of entropy generation in natural and mixed convection for energy systems may be found in (Oztop and Al-Salem (2012)). Second law analysis of natural convection with nanofluids and MHD flow can be found in refs. (Mahian et al. (2013a), Parvin et al. (2014), Mahian et al. (2013b, 2012)). Based on the above literature survey and to the best of authors' knowledge, MHD conjugate natural convection-conduction in a partitioned cavity filled with different nanofluids on different sides of partition and different Hartmann number combinations has never been studied in the literature despite its importance in many engineering systems as outlined above. The present study aims at investigating the effects of various parameters (Grashof number, Hartmann number etc.) on the fluid flow and heat transfer characteristics inside the partitioned cavity. Entropy generation analysis of the systems with different combinations of parameters was also performed. II. Physical model and mathematical formulation A schematic description of the problem along with the boundary conditions is shown in Fig.1. The square cavity is partitioned with a conductive wall of finite thickness (10 percent of the length) and it is located 564
120 in the mid of the cavity. The partition thermal conductivity was changed. The left enclosure is filled Al2O3-water nanofluid while the right enclosure is filled with CuO-water nanofluid. The left wall of the cavity is kept at constant temperature of Th and the right wall is at constant temperature of Tc with Th > Tc. No-slip boundary conditions were set for all other walls of the cavity. Thermo-physical properties of water, CuO and Al2O3 at the reference temperature are presented in Table 1. No-slip and thermal equilibrium between the base fluid and nanoparticles are assumed. The flow is assumed to be 2D, laminar and the density in the buoyancy force was modelled according to Boussinesq approximation. The conversation equations of mass, momentum and energy in 2D Cartesian coordinate system can be written in dimensional form for each of the sub-domains (left and right enclosures) as follows: are defined by using the following formulas: (1 ) (7) nf bf p cp (1 ) cp cp (8) nf bf p (1 ) (9) nf bf p where the subscripts bf, nf and p denote the base fluid, nanofluid and solid particle, respectively. The effective thermal conductivity of the nanofluid includes the effect of Brownian motion. In this model, the effects of particle size, particle volume fraction and temperature dependence are taken into account and it is given by the following formula (Koo and Kleinstreuer (2005)): knf kst kbrownian (10) u v x y 0 (1) where kst is the static thermal conductivity as given by (Maxwell (1873)): 2 2 u u 1 p u u u v nf 2 2 x y nf x x y 2 nf B0 v 2 sin( )cos( ) u sin ( ) nf 2 2 v v 1 p v v u v nf 2 2 x y nf y x y 2 nf B0 2 u v nf g T T c nf sin( )cos( ) cos ( ) ( ) (2) (3) 2 2 u T v T u u nf 2 2 (4) x y x y For the conductive solid medium: 2 2 T T x y (5) k st ( kp 2 kf ) 2 ( kf kp ) kf ( kp 2 kf ) ( kf kp ) (11) The interaction between the nanoparticles and the effect of temperature are included in the models as T k c f T d (12) 4 b Brownian 5 10 f p, f '(,, p ) bdp where the function f for Cu-water nanofluid is given in (Koo and Kleinstreuer (2005)).The effective viscosity of the nanofluid due to micro mixing in the suspension was given by (Koo and Kleinstreuer (2005)). f kbrownian f nf st Brownian 0.25 (13) (1 ) k Pr f f Entropy generation equation for each of the fluid domains can be written as: 2 2 k nf T T S 2 T0 x y nf u v u v 2 T 0 x y x y 2 nf B0 u v T 0 sin( ) cos( ) 2 (6) Entropy generation due to heat transfer, viscous dissipation and MHD flow are represented by the first, second and third terms on the right hand side of the above equation. For the solid domain, the velocity components in the above equation are set to zero. The effective thermo physical properties of nanofluids 565 where the first terms on the right hand side of equation is the viscosity of the nanofluid given in ref. (Brinkman (1952)). The relevant dimensionless physical parameters are: g ( T T ) H Gr Ha B H 3 f h c f f, Pr, 2 0 f f f The appropriate forms of the dimensional boundary conditions are: For the hot wall: u v 0, T Th For the cold wall: u v 0, T Tc Along the interface of fluid domain with the solid domains: k1 k2 n n 1 2
121 For the adiabatic walls: u v 0, 0 n Local Nusselt number along the hot wall of the enclosure is calculated as: Nu k nf s k f n n0 (14) where θ represents the non-dimensional temperature and S denotes the non-dimensional coordinate along the wall. Averaged Nusselt number is obtained after integrating the local Nusselt number along the hot wall as: 1 Nu Nu ds (15) m 0 s III. Solution methodology and solver validation Galerkin weighted residual finite element method was used to solve the governing equations along with the boundary conditions as described above. Weak form the governing equations with Galerkin procedure is established. Non-overlapping regions are constructed from the computational domain within each of the flow variables are approximated by using interpolation functions. Approximations are substituted into the governing equations and residuals for each of the conservation equation are obtained. Newton-Raphson iteration algorithm is used to simplify the nonlinear terms in the momentum equations. The convergence of the solution is assumed and the solution is terminated when the relative error for each of the variables denoted by Φ satisfy the following convergence criteria: Streamline and isotherm distributions within the cavity are shown for various values of Grashof numbers and different Hartmann number combinations in Fig. 2 and Fig. 3. The cavities are filled with single main recirculating zones and the maximum value of the stream-function is higher in the left half since the thermal conductivity of Al2O3-water is higher than that of CuO for the same Hartmann number and Grashof numbers. As the value of the Grashof number increases, the fluid motion accelerates and the convective heat transfer increases. At the highest value of the Grashof number, in the absence of magnetic field, two cell centres are seen in the left and right fluid domains. As the strength of the magnetic field enhances, the fluid motion dampens and the convection is reduced. The center of the recirculating zones moves with Hartmann number. The temperature gradient is higher along the lower part of the left wall and becomes higher with increasing Grashof number. In the interior of the cavities, the isotherms become parallel to the horizontal walls indicating the enhanced convection with Grashof numbers. As the Hartmann number is increased, the isotherms become less clustered along the hot wall and the isotherms become parallel to the vertical wall indicates the reduction of convection. The local and averaged Nusselt number distributions along the hot wall are shown in Fig. 4 for various Grashof and Hartmann numbers. Heat transfer is generally locally enhanced with increasing Grashof number and decreasing Hartmann numbers. n1 n n (16) To obtain an optimal grid distribution with minimal computational time, grid independence study is performed. The present solver is validated against the numerical results of Varol et al. (2010) for a partitioned cavity filled with air and water. Table 2 shows the comparison of the averaged Nusselt number variations for different Grashof numbers between the present solver numerical results of Varol et al. (2010). IV. Results and Discussions Numerical simulation results for different values of Grashof numbers (between 10 3 and 10 6 ), Hartmann numbers (between 0 and 50), thermal conductivity ratio (between 0.01 and 10) and solid volume fraction of the nanofluids of the two cavities (between 0 and 0.04) are presented in terms of streamlines, isotherm and Nusselt number distributions. The left and right enclosures were filled with Al2O3-water and CuO-water nanofluids. Fig. 1: Schematic description of the physical model and boundary conditions 566


 Fig.")
122 Tab. 1: Thermophysical properties of base fluid and nanoparticles Tab. 2: Code validation: Comparison of averaged Nusselt numbers along the hot wall for various Grashof numbers friction irreversibility and therefore the total entropy generation of the domains increases with ϕ. The slope of the linear curves is higher for the solid domain and the slope of the curves enhances as the strength of the magnetic field increases. Normally, there is reduction in the convection and temperature gradients along the hot and cold walls of the cavities decrease with increasing Hartmann number but at the same time the entropy generation contribution due to the magnetic field also enhances with Hartmann number which causes the slope of the curve for the fluid domains to increase with Hartmann number. Fig. 3: Isotherms for various Grashof numbers and different Hartmann numbers of fluid domains (Kr=1, ϕ1=0.01, ϕ2=0.01) Fig. 2: Streamlines for various Grashof numbers and different Hartmann numbers of fluid domains (Kr=1, ϕ1=0.01, ϕ2=0.01) The effect of conductivity ratio on the local heat transfer distribution are shown in Fig. 5 for various Hartmann number combinations and for fixed values of Gr=10 5, ϕ1=0.01, ϕ2=0.01. As the value of thermal conductivity ratio increases, heat transfer is locally enhanced. The discrepancy between the local heat transfer values from Kr=1 to Kr=10 is reduced at the highest values of Hartmann number combinations. The normalized entropy generation rate of fluid and solid domains are shown in Fig. 6 for various nanoparticle volume fractions and different Hartmann number combinations. The normalization is performed with the total entropy generation rate of the domains at the nanoparticle volume fraction of ϕ=0. For all Hartmann number combinations, as the nanoparticle volume concentration increases, the normalized entropy generation enhances. This is due to the increased temperature gradient along the hot and cold walls of the cavities and increased fluid Fig. 4: Effects of Grashof number on the Nusselt number distributions along the hot wall for various Hartmann numbers (Kr=1, ϕ1=0.01, ϕ2=0.01) 567

123 Tab. 3. Normalized entropy generation rate for various Hartmann numbers and thermal conductivity ratios, (Gr=10 5, (Ha1, Ha2)=(10, 10)) Fig. 5: Effects of thermal conductivity ratio on the Nusselt number distributions along the hot wall for various Hartmann numbers (Gr=10 5, ϕ1=0.01, ϕ2=0.01) Finally, the normalized entropy generation rates for various thermal conductivity ratios and different Hartmann number combinations are shown in Table 3. The normalization is performed with the total entropy generation rates of the domains at the parameter value of Ha=0. As the value of the thermal conductivity ratio increases, normalized entropy generation rates of the fluid domains increase which is due to the increasing fluid friction and heat transfer irreversibility. The normalized entropy generation rate of the solid domain decreases with increasing the thermal conductivity ratio since the temperature gradient within the solid domain decreases with Kr ratio. Depending on the thermal conductivity ratio, the normalized entropy generation rates may increase or decease as the value of the Hartmann number increase which is due to the entropy generation contribution to the magnetic field and the rate of deterioration of the convection within the fluid domains. V. Conclusions In this study, MHD natural convection-conduction and entropy generation in a partitioned cavity filled with different nanoparticles (Al2O3 and CuO) on different sides of the partition and different combinations of Hartmann numbers is numerically investigated. Some important conclusions from the numerical simulation results can be summarized as: Local and averaged heat transfer are enhanced with increasing values of Grashof number and decreasing values of Hartmann numbers. Fig. 6: Normalized entropy generation rate of different domains for various nanoparticle volume fraction and Hartmann numbers (Gr=10 5, Kr=1) When the value of the thermal conductivity ratio increases, heat transfer is locally enhanced. As the nanoparticle volume concentration increases, the normalized entropy generation enhances which is due to the increased temperature gradient along the hot and cold walls of the cavities and increased fluid friction irreversibility. As the thermal conductivity ratio enhances, 568
124 normalized entropy generation rates of the fluid domains increase as the convection within the fluid domains increase. The normalized entropy generation rates may increase or decease as the value of the Hartmann number increases depending on the thermal conductivity ratio. Acknowledgements This study is supported from Scientific Research Projects Unit (BAP) of Celal Bayar University under the grant no: whose support is gratefully acknowledged. Nomenclature B g Gr h Ha k H Nu p Pr T u,v x,y : Magnetic field strength : Gravitational constant (m.s-2) : Grashof number : Heat transfer coefficient (Wm-2K-1) : Hartmann number : Thermal conductivity (Wm-1K-1) : Length of the enclosure (m) : Nusselt number : Pressure (Pa) : Prandtl number : Temperature (K) : Velocity components (ms-1) : Cartesian coordinates (m) Greek letters α : Thermal diffusivity (m2s-1) : Expansion coefficient (K-1) φ : Nanoparticle volume fraction θ : Nondimensional temperature : Kinematic viscosity (m2s-1) : Density (kgm-3) : Electrical conductivity (Sm-1) Subscripts c : Cold m : Mean h : Hot References Alhazmy M. M., Numerical investigation on using inclined partitions to reduce natural convection inside the cavities of hollow bricks, International Journal of Thermal Sciences 49, , (2010). Basak T., Gunda P., Anandalakshmi R., Analysis of entropy generation during natural convection in porous right-angled triangular cavities with various thermal boundary conditions, International Journal of Heat and Mass Transfer 55, , (2012). Bejan A., Second law analysis in heat transfer, Energy 5, , (1980) Bhardwaj S., Dalal A., Analysis of natural convection heat transfer and entropy generation inside porous right-angled triangular enclosure, International Journal of Heat and Mass Transfer 65, , (2013) Brinkman H., The viscosity of concentrated suspensions and solutions, Journal of Chemical Physics 20 (1952) , (1952). Jeong J., Li C., Kwon Y., Lee J., Kim S. H., Yun R., Particle shape effect on the viscosity and thermal conductivity of ZnO nanfl uids, International Journal of Refrigeration 36, , (2013). Koo J., Kleinstreuer C., Laminar nanofluid flow in microheat-sinks, International Journal of Heat and Mass Transfer 48, , (2005). Mahian O., Kianifar A., Kleinstreuer, Al-Nimr M. A., Pop I., Sahin A. Z., Wongwises S., A review of entropy generation in nanofluid flow, International Journal of Heat and Mass Transfer 65, , (2013). Mahian O., Mahmud S., Pop I., Analysis of first and second laws of thermodynamics between two isothermal cylinders with relative rotation in the presence of mhd flow, International Journal of Heat and Mass Transfer 55, , (2012). Mahian O., Oztop H. F., Pop I., Mahmud S., Wongwises S., Entropy generation between two vertical cylinders in the presence of mhd flow subjected to constant wall temperature, International Communications in Heat and Mass Transfer 44, 87-92, (2013). Mamou M., Hasnaoui M., Vasseur P., Bilgen E., Natural convection heat transfer in inclined enclosures with multiple conducting solid partitions, Numerical Heat Transfer, Part A 25, , (1994). Maxwell J., A Treatise on Electricity and Magnetism, Oxford University Press, Ostrach S., Natural convection in enclosures, J. Heat Transfer 110, , (1988) Oztop H. F., Al-Salem K., A review on entropy generation in natural and mixed convection heat transfer for energy systems, Renewable and Sustainable Energy Reviews , (2012). Parvin S., Nasrin R., Alim M., Heat transfer and entropy generation through nanofluid filled direct absorption solar collector, International Journal of Heat and Mass Transfer 71, , (2014) Rahman M., Alim M., Sarker M., Numerical study on the conjugate effect of joule heating and magnato-hydrodynamics mixed convection in an obstructed lid-driven square cavity, International Communications in Heat and Mass Transfer , (2010) 569
125 Selimefendigil F., Oztop H. F., Identication of forced convection in pulsating flow at a backward facing step with a stationary cylinder subjected to nanofluid, International Communications in Heat and Mass Transfer, in press. Selimefendigil F., Oztop H. F., Effect of a rotating cylinder in forced convection of ferrofluid over a backward facing step, International Journal of Heat and Mass Transfer 71, , (2014). Selimefendigil F., Oztop H. F., Estimation of mixed convection heat transfer of rotating cylinder in a vented cavity subjected to nanofluid by using generalized neural networks, Numerical Heat Transfer, Part A 65, , (2014) Selimefendigil F., Oztop H. F.,, Pulsating nanofluids jet impingement cooling of a heated horizontal surface, International Journal of Heat and Mass Transfer 69, 54-65, (2014). Sheikholeslami M., Gorji-Bandpy M., Ganji D., Soleimani S., Seyyedi S., Natural convection of nanofluids in an enclosure between a circular and a sinusoidal cylinder in the presence of magnetic field, International Communications in Heat and Mass Transfer 39, , (2012). Varol Y., Oztop H. F., Koca A., Effects of inclination angle on conduction natural convection in divided enclosures lled with diferent fluids, International Communications in Heat and Mass Transfer 37, , (2010). Varol Y., Oztop H. F., Pop I., Entropy generation due to natural convection in non-uniformly heated porous isosceles triangular enclosures at different positions, International Journal of Heat and Mass Transfer 52, 1193, (2009). 570
126 CFD Simulations to Optimize Flow Distribution in a FGD Wet Scrubber Osman Gozutok *, Murat Baranak, Goktug N. Ozyonum, Asli I. Kaya TÜBİTAK Marmara Research Center, Energy Institute, Gebze/Kocaeli, 41470, Turkey * [email protected] Abstract A two-phase wet scrubber CFD numerical model has been developed via commercial CFD software. The gas and liquid flow fields of the scrubber were simulated and characteristics of the static pressure and velocity profiles were analyzed. Droplet-wall interaction model is implied to take into account effect of splashing or bounding conditions on walls via a user defined submodel. The effects of the scrubber modification alternatives (wall ring, tray) on flow dynamics of the gas and liquid streams were studied. Wall ring and tray modification improved the gas liquid flow distributions at the cost of an increased pressure drop. Keywords: Spray tower, wet scrubber, tray, wall-ring, computational fluid dynamics, flue gas desulfurization Euler-Lagrangian model. I. Introduction In coal fired power plants, SO2 emissions must be reduced substantially in order to to comply with the local air quality regulations and more importantly to minimize the power plant s environmental negative impacts. Wet limestone-gypsum process, with its high SO2 removal efficiencies, and high reagent utilization ratios, is the most widely used process throughout the world. Wet flue gas desulfurization (FGD) towers generally have several zones: reaction tank, absorber (two phase region including spray headers), dual flow tray, and mist elimination. Nozzles are used for spraying the slurry over flue gas homogeneously as very small droplets. In FGD absorber zone, the scrubber slurry comes into contact with the flue gas, allowing chemical reactions that tie up the SO2. The main scrubber design criterion is to achieve the greatest possible contact between gas and liquid to attain maximum SO2 removal efficiencies with low pressure drops. In order to enhance the scrubber gas-liquid contact area and to improve gas and slurry flow distribution and dynamics, computational fluid dynamics (CFD) technique could be utilized. However, there are a limited number of such CFD studies in the literature. This situation may be due to the complexity of two phase flow phenomena inside the scrubber, and correspondingly the need for the required submodels. While making the scrubber CFD models, the multiphase flow can be mathematically modelled with two well-known approaches, Euler continuum approach and Lagrangian trajectory approach (Bautsch and Fahlenkamp, 2006; Marocco and Inzoli, 2009). Besides continuous gas phase is solved in Euler frame, tracking dispersed phase. The main assumptions are; i. droplets are assumed to be spherical, ii. drag is dominant force in Lagrangian coordinates. Empirical droplet-wall interaction model is implied to account effect of splashing or bounding conditions on walls (Weiss and Wieltsch, 2005; Weiss, 2004). Porous-Jump condition was used to model tray with known velocity/pressure drop characteristics based on the experimental and numerical works (Dudek and Rogers, 1999; Strock and Gohara, 1995). For closing the RANS equations without solving scales of the flow, k-ε turbulence model was used. Equations were solved iteratively with Simple algorithm (Patankar, 1972) using standard finite volume techniques. 2 nd order upwind scheme, which is least sensitive to mesh structure and leads to more accurate result, was chosen for spatial discretization. In the scope of this study, a two-phase wet scrubber CFD model has been developed via Ansys-Fluent software and the effect of the scrubber modification alternatives (wall-ring, tray) on flow dynamics of the gas and liquid streams were studied. The pressure-drops and standard deviations of the upward-component of velocity were calculated, pressure, velocity and slurry mass concentration contours were also plotted at selected planes. II. Method: FGD numerical modelling All the fluid flow motions (laminar or turbulent) are governed by a set of dynamic equations (continuity, momentum and energy equations). The energy equation was not incorporated into the simulation basis. So without energy equation Navier-Stokes equations are: ρ t + (1) (ρu x i ) = 0 i t (ρu i) + (ρu x i u j ) = p + τ ij (2) j x i x j Here, u i (x, t) is the flow velocity, p(x, t) is the static 571

127 pressure, τ ij (x, t) are the viscous stresses, and ρ(x, t) is the fluid density. II.1 Discrete phase modelling Droplets in the fluid flow domain are defined with some reasonable assumptions. The prominent assumptions are that: Droplets are assumed to be spherical The ratio of spraying droplet to fluid density is very large Drag force is the dominant acting force Two-way coupling between phases Eulerian and Lagrangian approaches generally used for mathematical modeling of two-phase flow. Advantage of Lagrangian approach is that droplet physical properties (diameter, density, etc.) can differ in. III. Physical system and simplifications III.1. General sizing The FGD scrubber physical domain is given in Fig. 1. Geometrical and simulation parameters are given in Table 1. The dimensions of the scrubber are in the order of an approximately 150 MWe class power plant scrubber. Tab. 1: Geometrical and simulation parameters Geometrical parameter Column height Column diameter Number of spray levels 5 Number of nozzles m m Spray angle 96.2 Nozzle type Boundary conditions Flue-gas Mass flow rate 92 per level Single - Hollow Cone 345 kg/s. Gas density kg/m 3 Liquid spray Slurry flow rate per nozzle 27.7 kg/s Slurry density 1100 kg/m 3 III.2. Rings Adding wall rings is one of the methods to minimize the gas flow near the wall regions and to minimize the liquid slurry wall sneakage. The location of the wall ring is shown in Fig. 2. (a). Fig. 1: FGD scrubber physical domain At 5 spray levels, totally 460 nozzles are inserted and defined into the domain. The nozzle was simulated as a hollow cone type. The distribution of the slurry droplets going out of the nozzles are defined according Rosin-Rammler distribution. 2 mist eliminators are defined into domain as a porous-jump region. Rings are defined as non-thickness walls. As shown in Figure 2 (a), rings were positioned between 1 st -2 nd and 3 rd -4 th spray levels. As seen on Fig. 1, spray levels are also modeled as a non-thickness wall. So the blockage of piping effects can be seen on the simulations. 572 (a) (b) Fig. 2: Scrubber physical domain (a) rings, (b) tray and mist eliminators in the domain III.3. Tray In an FGD scrubber, tray can be defined as a perforated plate composed of a number of compartments. The tray is used to enhance liquid-gas interactions, and therefore increasing the SO2 removal efficiency. In the CFD studies, tray was taken into account by using simply its pressure drop. The pressure drop was calculated as the summation of the following constituents; i. dry perforated plate, ii. hydrostatic pressure drop, iii. surface tension. As seen in Figure 2 (b), tray was modelled below the 1 st spray layer in the domain. IV. Results and discussions An even and uniform gas distribution at the absorber inlet, and a balanced gas distribution through the absorber unit for FGD systems are important requirements for obtaining high removal efficiency, and good performance of the mist elimination system.
.")
128 CFD modeling is commonly used to analyze the gas flow distribution at the inlet and between modules, as well as being used to design and evaluate flow control devices to correct flow maldistribution problems when they are present. the pressure losses and obtaining equalization of the velocity field is the elimination of eddy zones inside the absorber (Kitto and Stultz, 2005). In the scope of discrete phase analyzes, firstly gas and liquid distribution and generated pressure drops through the absorber were analyzed for open spray tower as the base case. After that, improvement of the gas and liquid distribution and change of pressure profiles for the cases of wall ring and tray modifications were analysed. As can be seen from Fig. 3(a), when the flue gas enters the tower at high velocities, the y-component velocity distribution is uneven after expansion. Because of inertia, the flue gas strikes to the tower wall at the opposite side and goes up from the vicinity of the wall at a rate of 7-8 m/s. Due to the change of direction of the flue gas flow in the entrance section of the absorber and the presence of spray headers, a significant level of reverse gas flow (recirculation) is formed inside the absorber. This causes y-component of the velocity to be below zero in many sections of the absorber which is clearly evident from the figure. The recirculation zone is not benefit to the uniform distribution of flue gas. With the height of the tower increasing, the velocity gradient becomes relatively small, but the maximum flue gas velocity zone is still near the tower wall, while the central velocity is smaller, causing uneven distribution of flue gas. In this case, desulfurization efficiency would be lower. Fig. 3: y-component of the velocity clipped contours at column symmetry plane (a) base-case (b) two-rings (c) two-rings and tray analysis results When adding the wall-rings to the scrubber, the velocity distribution improved slightly and the reverse flow regions were diminished (Fig. 3(b)). However, the main contribution of the wall-rings was preventing of the liquid film formation on the scrubber wall. Since the interfacial area between slurry film and flue gas is very small, this portion of the circulated slurry has very small positive impact on the SO2 removal. By integrating the wall ring(s), this liquid slurry film can be recovered and directed back to the inner side of the absorber. This effect can be clearly seen in Fig. 4. In Fig.3 (c), the velocity distribution of the scrubber having both two-rings and dual flow tray can be seen. By adding the tray, the gas flow distribution became considerably better and more homogeneous. The regions with back-flow decreased. This even gas flow distribution would result in better SO2 removal efficiency and better mist elimination performance. As can be seen from the pressure profile given in Fig. 5(a), pressure loss takes place through the absorber in inlet section (change of flow direction zone), spraying section (absorption zone), mist eliminators and outlet section. Even though the losses resulting from spraying, mist elimination and reduction of cross sectional area at the outlet are inevitable, they can be reduced to some extent by providing a uniform flow inside the absorber. The main factor in decreasing 573 Fig. 4: Slurry mass concentration at 1 st spray level (a) base-case (b) two-rings (c) two-rings and tray analysis results Besides, although the expansion at the inlet of the absorber causes a reduction of gas velocity, the change in flow direction at that section produces pressure losses caused by both fluid friction and momentum exchanges. Even though momentum is conserved, kinetic energies are dissipated as heat at these points. This means that pressure losses are influenced mainly by the geometries. For two phase
.")
129 flow case, making an evaluation is much more complex due to the slurry droplets sprayed onto the incoming flue gas and spray headers obstructing the flow (Kitto and Stultz, 2005). Together with the mist eliminator losses, the total pressure drop through the absorber is calculated to be 515 Pa for the base case (Table 2). The addition of wall rings increased the pressure drop slightly, from 515 Pa to 546 Pa. Since the wall ring blocks only a very small portion of the cross sectional area of the scrubber, its impact on the pressure drop is limited. On the other hand, since the tray cover the whole cross section of the scrubber and a level of liquid accumulates on it, the pressure drop in this design (Fig. 5(c)) is substantially higher. Adding the tray resulted in an increase of pressure drop from 546 Pa, to 966 Pa (Table 2). In Table 2, mass-weighted average y velocities, their standard deviations and pressure drop values are tabulated. The standard deviation is used as a criterion showing the evenness of the gas flow. As expected, by adding two wall rings and then tray, the y velocity standard deviation decreased, implying that the gas flow distribution became more homogeneous. V. Conclusions Commercial CFD software has been used to investigate the gas and liquid distributions within a counter flow wet scrubber. The effects of the scrubber modification alternatives (wall ring, tray) on flow dynamics of the gas and liquid streams were studied. The results show that, by these modifications, the flow distribution which affects SO2 removal efficiency and mist eliminator performance in the scrubber can be improved substantially. The main contribution of the wall-rings is preventing of the liquid film formation on the scrubber wall. By integrating the wall ring(s), the liquid film was recovered and directed back to the inner side of the absorber. By adding the tray, the gas flow distribution became considerably better and more homogeneous. On the other hand, these modifications increased the pressure drop along the scrubber, which results in a higher fan power need, thus higher operating costs. Especially the tray increased the pressure drop considerably. It can be concluded that, the numerical CFD simulations is an effective method of studying the flow characteristics of a wet scrubber system. Wall ring and tray modifications improved the gas liquid flow distribution at the cost of the increased pressure drop. Nomenclature CFD : Computational fluid dynamics FGD : Flue gas desulfurization RANS : Reynolds-averaged Navier-Stokes u : flow velocity (m/s) τ ij : viscous stresses p : pressure (N.m -2 ) References Bautsch, C., Fahlenkamp, H., Detailed simulation of wet flue-gas-desulphurisation scrubbers with CFD. (2006). Fig. 5: Pressure contours at column symmetry plane (a) base-case (b) two-rings (c) two-rings and tray analysis results Tab. 2: Three analysis cases results at between 2 nd -3 rd (y=10.1 m) and 4 th -5 th (y=14 m) layers Cases Base-Case Two-Rings Two-Rings and a Tray Contour at Y= x (m) Mass- weighted average y velocity, m/s Standart deviation y velocity Pressure drop, Pa Dudek, S.A., Rogers, J.A., Computational fluid dynamics (CFD) model for predicting two-phase flow in flue-gas-desulfurization wet scrubber. 1 6 (1999). Kitto, J.B., Stultz S.C, Steam: its generation and use. The Babcock&Wilcox Company, 41 st edition, (2005). Marocco, L., Inzoli, F., Multiphase Euler Lagrange CFD simulation applied to wet flue gas desulphurisation technology. Int. J. Multiph. Flow. 35, 2, (2009). Patankar, S. V, Spalding, D.B., A calculation procedure for heat, mass and momentum transfer in three-dimensional parabolic flows. Int. J. Heat Mass
130 Transf. 15, 10, (1972). Strock, T.W., Gohara, W.F., Experimental approach and techniques for the evaluation of wet flue gas desulfurization scrubber fluid mechanics. 49, 24, (1995). Weiss, C., The liquid deposition fraction of sprays impinging vertical walls and flowing films. Int. J. Multiph. Flow. 31, 1, (2004). Weiss, C., Wieltsch, U., Laser optical flow measurements and computational fluid dynamic calculation of spray tower hydrodynamics. Chem. Eng. Res. Des. 83, 5, (2005). 575
131 Determination of Flow Characteristics of Multiple Slot-Jets Impingement Cooling Nuri Kayansanayan 1*, Ersin Alptekin 2, Caner Erdogan 2 1 Near East University, Faculty of Engineering, Mechanical Engineering Department, Mersin 2 Dokuz Eylül University, Faculty of Engineering, Mechanical Engineering Department, Tinaztepe, Buca, Izmir * [email protected] Abstract This study is about numerical modeling and analysis of cooling problem of the lower surface of a channel by multiple slot jets located at the upper surface which is furnished with three slot jets in series having identical width and depth. The two ends of the flat channel is open and the upper wall after evenly spaced slots extends with adiabatic wall sections symmetrical at both ends. The present work deals with analyzing the flow characteristics of such geometry and determines the effect of flow rate, slot spacing, and the channel geometry on the flow velocity profiles, circulation zones and on the channel pressure drop. Referring to similar studies in literature, appropriate meshing of the solution domain by using ANSYS - FLUENT software has been carried out. To validate the computer code developed and to check the effect of various turbulence models on flow behavior, the experimental results of a similar geometry are produced and compared. Accordingly, SST k - turbulence model represents the experimental data quite accurately, and identifies the effect of flow rate on recirculation zones occurring between adjacent slot jets. In addition to the injection flow rate, the effect of channel height and slot spacing on channel pressure drop is also studied. Keywords: Jet impingement, turbulence, computational fluid dynamics, flow behaviour I. Introduction Impinging jets are encountered in a wide range of industrial processes as an efficient means to enhance and control localized heat and mass transfer. Applications of impinging jets include drying of textiles, film, and paper; cooling of gas turbine components and the outer wall of combustors; freezing of tissue in cryosurgery; and cooling of electronic equipment. Significant attention has been paid to impinging jets and the high heat and mass transfer rates associated with impinging gaseous jets have been well recognized and documented Williamson (Zhou and Lee (2004),Dewan et al. (2012)).Single, normally impinging, jets are efficient for localized heat transfer from the impingement location on a surface. For distributed cooling (or heating) of an extended surface, multiple impinging jets can be used. However, the flow structure for multiple and confined jet impingements becomes very complicated in nature because the spent fluid flow from upstream moves along the surface as wall jet, and then interacts with the downstream impinging jet flow. Fluid re-circulates and degrades the heat transfer efficiency of the downstream jet. Gao (2003) conducted experimental investigation of multiple jet impingement and showed stagnation point Nusselt number for the downstream jet decreases by about 30%. Even though multiple impinging cooling is an effective method for achieving distributed heat transfer, designing and analyzing of these systems is much more complicated than the single jet impingement system. Shariatmadar et al. (2015) carried out experiments and numerical analyses to investigate the effects of number of slot-jets, width and jet-to-jet spacing on heat transfer mechanism for laminar flow. Average and stagnation Nusselt numbers are correlated as a function of independent dimensionless parameters for single jets and three different jet arrays tested with different jet-to-jet spacing and width values. It is indicated that although the average Nusselt numbers are substantially independent to the jet-to-jet spacing, they increase considerably with increments of Reynolds number as well as jet width. Afroz and Sharif (2013) investigates the convective heat transfer from an isothermally heated flat surface due to two-dimensional turbulent twin oblique confined slot-jet impingement. The results showed that SST k - turbulence model agrees notably better with the experimental data. In this study, the flow characteristics and the flow distribution patterns of a single slot-jet as well as multiple slot-jet located at the upper wall of 2-D channel is analyzed numerically. The pressure distribution of the channel and the variation of skin friction coefficients along the impingement surface plate are also presented. II. Material and method II.1. Definition of the problem The flow characteristics of the single and multiple two-dimensional confined slot-jets impingement on plane surface is numerically investigated due to the various flow and geometric parameters. Depending upon the number of slot-jet injection, the problem is schematically described in Figure 1 as a single slot-jet (Figure 1a) and a multiple slot-jet (Figure 1b) 576
132 injection.for both configurations, flow characteristics areanalyzedat various air flow rates (Reynolds number, Re Vinj Dh ), and at channel height ratios (H/L).In the analysis, however, ratio of the jet spacing to jet width(s/l) is kept constant in flow analysis of multiple slot-jets. (a) Single slot-jet where model constants and source terms of the right hand side of the Equations (3) and (4) can be reached in the ANSYS FLUENT User Manual (2011). Equations (1) to (4) are solved with the aid of ANSYS-FLUENT software. Software is based on the control volume approach of Patankar (1980). QUICK scheme (Leonard, 1979) is applied for discretization of convective terms and SIMPLE (Patankar and Spalding, 1972) algorithm is adapted for the solution of momentum and continuity equations. Enhanced wall treatment is adopted. Convergence criteria for all conservation equations are taken to be 10E-6. II.3. Boundary conditions and mesh independency (b) Multiple slot-jets Fig. 1: Schematic diagram of the problem II.2. Governing equation and solution method In determining flow characteristics of confined slot-jet impingement, the following time averaged mass and momentum equations are considered: x i u 0 i p u u x x x x x i j uiu j ui u j j i j j i (1) (2) where, u and u' indicate the average and fluctuating part of the velocities respectively. Although, there are many models to represent the apparent turbulent stresses in Eq. (2), turbulence modelling by using SST (Shear-Stress Transport) k - has been in use by many authors for such confined flow problems(afroz and Sharif (2013)). The standard k - model can estimate near wall flows well. Moreover, the standard k - model represents the flow behaviour better far from the wall. Hence, Menter (1994) coupled these two turbulence model and generated SST k - model. Thus, SST k - model are more accurate and reliable for a wider class of flowswhich include adverse pressure gradient flows, flow over airfoils. The turbulence kinetic energy, k, and the specific dissipation rate,, are obtained from the following transport equations, k k kui k Gk Yk Sk (3) t xi x j x j u j t xj (4) G Y D S x j x j 577 Due to symmetry of the flow, gradients of all transport propertieshave to be zero x 0 at the xx/2 symmetry surface, and no slip condition at the walls is satisfied by (u=v)wall=0.uniform velocity (V inj) profiles are assumed at the slot sections of the computational domain and V inj depends on Reynolds number, (V inj=f(re)).the turbulence intensity of jet flow is assumed to be 2% in the analysis. At the outlet section, the pressure is specified to be at the atmospheric pressure. To get numerical results free of mesh size, single slot-jet impingement for H/L= 2 and Re = is studied for four different mesh densities. Computational domain is divided into non-uniform quadrilateral grids. To capture the velocity and pressure gradients at a region close to the stagnationpoint, fine grids are generated. The details of mesh size distribution isgiven in Table 1. Tab. 1: The details of the considered mesh sizes Cases x-dir y-dir Total number of meshes A B C D IV. Results and discussions IV.1. Validation of methodology Because of having similar geometry and flow conditions, the work of Afroz and Sharif (2013) is utilized in determining the most appropriate turbulence model and wall function for the present study. Five different turbulence model and wall function pairs including SST k - model, realizable k - and RNG k- models are examined and have been tested. In studying realizable k-e and RNG k - turbulence models, both standard and enhanced wall functions are considered for capturing the near wall effects. In comparing the models, the variation of Nusselt number along the heated surface is analyzed for two different injection Reynolds numbers. In the analysis, mesh distribution for Case A is used. As
133 depicted in Figure2, SST k- turbulence model predicts the results of the reference work fairly accurately than the other models. (a) Non-dimensional pressure distribution (a) Re = (b) Skin friction coefficient Fig. 3: Mesh size comparison (b) Re = Fig. 2: Local Nusselt number distribution along the heated surface As shown in Figure 3, mesh types are compared in terms of non-dimensional pressure distribution, * w P P P 0 and skin friction coefficient, C f V 2 inj 2 distribution along the impingement plate for selected SST k-w turbulence model. In comparing the pressure distributions, no essential difference among the studied cases exist. However, in skin friction coefficient, deviation in results especially at a region close to the stagnation point is noticed. The discrepancy between the results of Case A and B being negligibly small, case B is selected for the parametric studies. After determining the optimum mesh density, meshes are generated for all of the geometric configurations. Depending upon the number of slots, and jet aspect ratio (H/L), the mesh number of a particular geometry is provided in Table Tab. 2: Mesh details of all configurations Total number of Slot type H/L x-dir y-dir meshes Single slot-jet Multiple slot-jet IV.2. Parametric results To evaluate and assess the effect of jet velocity on flow behaviour, the flow Reynolds number which is defined with respect to hydrolic diameter of jet width, 2L, as Re Vinj Dh assumes values as 5900, and in the analysis.in studying the multiple slot-jet configurations, the jet spacing parameter, S/L, is kept constant at 3. However, the effect of jet aspect ratio, H/L, is varied by considering the aspect ratios of 2, 4 and 6. In single-slot-jet analysis, Fig. 4 represents the flow patterns of three different jet aspect ratios at a constant Reynolds number of A re-circulating buble develops in the flow domain. This buble is encompassed by the top adiabatic wall, main jet stream, and by the deflected wall jet at the bottom. As in Fig. 4, increasing the aspect ratio, H/L, increases the size of the recirculation buble. The main jet stream impinges on the bottom surface of the

134 channel, gets deflected, and flows downstream in a meandering path between the top primary recirculation buble and the channel surfaces toward the outlet. The flow patterns for the triple slot-jet impingement case is shown in Fig. 5 where jet Reynolds number is Re = 5900, and the geometric parameters of the channel are taken to be H/L = 6 and S/L = 3. It can be seen that the multiple slot-jet flow structure is much more complicated due to interaction of spent flow of upstream jet with the downstream jet. The main recirculation buble still exists at the downstream region after the second injection slot. However, due to interaction of wall-jet with the impinging jet, the flow between two adjacent jets becomes complicated and re-circulation bubbles are generated. (a)h/l = 2 (b)h/l = 4 (c)h/l = 6 Fig. 4: Variation of recirculation zone at fix Reynolds number (Re = 5900) - single slot-jet Fig. 5: Comparison with multiple slot-jet for Re = 5900,H/L = 6 and S/L = 3 Figure 6 illustrates the skin friction coefficient distribution over the lower surface of the channel due to single slot jet located at the symmetry line of the upper surface. In this figure, both the effect of flow Reynolds number and the jet aspect ratio on surface friction are analyzed. At a particular height ratio of (H/L), increase in Reynolds number decreases peak value of the friction coefficient which occurs in one-slot width distance from the symmetry line and then monotonically decreases. As expected, increase in height ratio at a specified flow Reynolds number results with a decrease in peak value of friction coefficient. A typical skin friction distribution on the lower surface of a channel with three slots located at the upper wall is illustrated in Fig. 7. Due to interaction of wall jet with the downstream impinging jet, a secondary peak takes place at the downstream section. The magnitude of secondary peak is always less than the first slot peak and in fact gets flattened as the Reynolds number decreases. Increase in Reynolds number does not change the location of the secondary humb but increases its intensity. (a) H/L = (b) H/L = 4
135 As the flow rate increases the slopes at several sections of the distribution curve become steeper. The existence of secondary peak in the pressure profile is solely due to injection through the adjacent jet. As indicated in Fig. 9b, the discrepancy due to Reynolds number effect becomes less effective as the height ratio increases. (c) H/L = 6 Fig. 6: The deviation of skin friction coefficient along the impingement plate for single slot-jet (a) Re = 5900 Fig. 7: The deviation of skin friction coefficient along the impingement plate for multiple slot-jet H/L = 6, S/L =3 Figure 8 shows the pressure distribution profile of single slot jet impingement along the channel; starting from the channel symmetry (stagnation point) and ending at the channel exit. As previously mentioned, the slot jet is located at the symmetry line of the channel, and then the effect of slot-jet flow rate and the channel aspect ratio on pressure distribution are both illustrated in Fig. 8. Comparing the overall pressure distributions in Figs. 8a, 8b, and 8c, it is observed that variation in flow Reynolds number does not have any influence on pressure distribution for the range of Reynolds numbers studied. In a range extending a few slot widths from the stagnation, the pressure assumes negative values and reflects typical jet characteristics. Moreover, occurrence of a positive pressure gradient after the minimum supports the existence of a recirculation zone. The variation of the channel height ratio certainly affects the pressure distribution. As the height ratio increases, the negative pressure zone extends in downstream direction and the size of recirculation zone enlarges. (b) Re = (c) Re = Fig. 8: Non-dimensional pressure distribution along impingement plate for single slot-jet The pressure variation in the channel for triple slot jet impingement is shown in Figure 9. In this figure, two aspect ratios; H/L = 2, and 6, are considered for determining the effect of height ratio on pressure, but the slot spacing is kept constant at S/L=3 Figure 9 shows that flow Reynolds number modifies the pressure profile in multiple slot-jet impingements. 580
136 Nomenclature (a) H/L = 2 C f : Skin friction coefficient D h : Hydraulic diameter of the slot-jet, (m) k : Turbulence kinetic energy P : Pressure (Pa) Re : Reynolds number, ( ) V D V : Velocity of the fluid, (m.s-1) u,v : Velocity components, (m.s-1) X : Non-dimensional length, (X=x/D h) x,y : Cartesian axis directions Greek letters : Density of the fluid w : Shear stress on the wall, (kg.m-1.s-2) : Kinematic viscosity, (m2.s-1) : Viscosity (Pa.s) inj : Effective diffusivity : Specific dissipation rate Superscripts * : Dimensionless Subscripts inj : jet injection 0 : stagnation point, x=0 h References (b) H/L = 6 Fig. 9: The deviation of non-dimensional pressure distribution along impingement plate for multiple slot-jet V. Conclusions Flow characteristics of a channel with three equally spaced and identical slots located at the upper wall is investigated numerically using the ANSYS FLUENT CFD code. The jet velocity at each slot exit is taken to be identical for all cases studied. Hence the flow is symmetric with respect to the centerline of the mid-slot and flow symmetry is taken into account in the analysis. The main objective of this study is to investigate the multiple slot-jet impingement effect on the channel flow instead of a single normal impinging jet for which major pressure drop is concentrated near the impingement location. In the analysis, two parameters; the injection flow rate through the slots, and the channel height ratio, have been altered so that the resulting effect on the flow behavior is recorded by the considering the flow streamlines, the friction factor at the bottom surface of the channel, and by the non-dimensional pressure distribution. Close examination of the local friction coefficient distribution and the pressure distribution plots for multiple injection case reveals that a secondary hump takes place at the downstream section after the second injection slot. Hence, in addition to recirculation bubble caused by a single-slot jet, a circulatory zone exists between two adjacent slots of the channel. Afroz F., Sharif M.A.R., Numerical study of heat transfer from an isothermally heated flat surface due to turbulent twin oblique confined slot-jet impingement, Int. J. Thermal Sciences. 74, 1-13, (2013). ANSYS-FLUENT 14.0 User Guide, ANSYS Inc., Dewan A., Dutta R., Srinivasan B., Recent trends in computation of turbulent jet impingement heat transfer, Heat Transfer Eng. 33, (2012). Gao X., Experimental investigation of the heat transfer characteristics of confined impinging slot jets, Exp. Heat Transfer 16,1-18 (2003). Menter F.R., Two-Equation Eddy-Viscosity Turbulence Models for Engineering Applications, AIAA Journal, 32, , (1994). Patankar S.V., Numerical Heat Transfer and Fluid Flow. New York: Taylor & Francis (1982). Patankar S.V., D.V. Spalding., A calculation procedure for heat, mass and momentum transfer in three-dimensional parabolic flows, Int. J. for Heat and Mass Transfer 15, , (1972). Shariatmadar H., Momeni A., Karimi A., Ashjaee M., Heat transfer characteristics of laminar slot jet arrays impinging on a constant target surface temperature, Applied Thermal Eng. 76, , (2015). Zhou D.W., Lee S.J., Heat transfer enhancement of impinging jets using mesh screens, Int. J. Heat Mass Transfer 47 (10 11), (2004). 581
137 Experimental and Numerical Investigations of Heat Transfer in Multi-Port Tubes Kemal Ermis 1*, H. Ibrahim Coban 1, Mehmet Coban 2 1 Sakarya University, Faculty of Technology, Department of Mechanical Engineering, Sakarya, 54187, Turkey 2 Sakarya University, Sakarya MYO, Department of industrial Moulding, Sakarya, 54187, Turkey * [email protected] Abstract With developing technology, dimensions of air-conditioning systems are getting smaller. Small hydraulic diameter tubes which multi-port extruded aluminium are using in automotive refrigerant condensers and process industries. Applications of condenser have been developed for heat transfer in a small hydraulic diameter tubes having rectangular shapes. The purpose of this study is to investigate subcooled liquid heat transfer and friction pressure drop experiments results for R-134a in small tubes. The tubes, having different rectangular ports tested between 1.26 mm and 2.64 mm hydraulic diameters for single-phase flow. This paper provides heat transfer data presented at 8 kw/m 2 heat flux for different mass velocities. In addition, obtained data from experimental study is compared to prediction correlations and numerical analysis. The numerical analysis study was conducted for 300 kg/m 2 s of mass velocity by using Ansys-Fluent packet programme. Compared results are presented in this study. Keywords: Heat transfer, Friction pressure drop, numerical analysis, small tube I. Introduction Small hydraulic diameter copper and extruded aluminium tubes are finding increasing usage in airconditioning applications. Multi-port, flat extruded aluminium tubes are widely used in automotive refrigerant condensers. Because of the small minor diameter of the flat tube, the air-side pressure drop is significantly smaller than will occur for condensers made with round tubes. As the tube minor diameter is reduced, the tube-side hydraulic diameter decreases. There are some studies in this area. Cavallini et al. (2009) presented a model for calculation of the frictional pressure gradient during condensation or adiabatic liquid gas flow inside minichannels with different surface roughness. Garimella (2004) presented an overview of the use of flow visualization in micro- and mini-channel geometries for the development of pressure drop and heat transfer models during condensation of refrigerants. In this study, the effect of channel shape and miniaturization on the flow regime transitions was documented by author. Sakamatapan et al. (2013) were investigated the condensation heat transfer characteristics of R- 134a flowing inside multiport minichannels and found results that the average heat transfer coefficient increased with the increase of vapor quality, mass flux, and heat flux, but decreased as saturation temperature rose. Derby et al. (2012) presented data for three channel geometries (square, triangle, semicircle) with hydraulic diameters of 1 mm were machined to facilitate comparison of channel shape and condensation physics due to surface tension. They showed that single-phase experiments validated the experimental apparatus and procedures, with good agreement between single-phase heat transfer coefficients and the Gnielinski (1995) correlation. Lopez-Belchi et al. (2014) presented a paper reports condensing two-phase flow pressure drop inside a mini-channel tube with 1.16 mm inner hydraulic diameter with R1234yf, R134a and R32. Webb and Ermis (2001) investigated effect of hydraulic diameter on condensation of R-134a in flat, extruded aluminium tubes. Also, they discussed the effect of hydraulic diameter on condenser design and operation. This study provides subcooled liquid heat transfer and friction pressure drop experiments results for R-134a in small tubes, having different rectangular ports tested between 1.26 mm and 2.64 mm hydraulic diameters as shown Figure 1. Also, this study provides condensation results of tubes. In addition, obtained data from experimental study is compared to prediction correlations and numerical analysis. The numerical analysis study was conducted for 300 kg/m 2 s of mass velocity by using Ansys-Fluent packet programme. II. Experimental Facility II.1. Experimental program Figure 1 show photos of the tubes and Table 1 lists their geometrical dimensions. The descriptive code used to describe the code is as in the format X-YY-ZZ, where first digit (X) is the minor tube diameter, the second digits (YY) are the major tube diameter, and the third digits (ZZ) are the numbers of ports in the tube. 582
 16 16 18 b (mm) 3 3 3 t (mm) 0.5 0.40 0.4 A c (mm 2 ) 27.")


138 Fig. 1: Photographs of tubes tested Tab. 1: Dimension of the tubes tested Tube A Tube B Tube C ITEM P P P* Np 4 rectangular 8 rectangular 12 rectangular w (mm) b (mm) t (mm) A c (mm 2 ) D h (mm) p (mm) *Refer to Fig mm long and is centered within the water channel. The test section is designed such that the waterside heat transfer coefficient is larger than that of the refrigerant side. The water flows between 0.6 mm and 1 mm wide annulus around the test section outer surface. An electric pre-heater controls the vapor quality entering the test section. The refrigerant is condensed against cooling water flowing in the annulus. The two-phase mixture leaving the test section enters a post condenser and then the condensate is drained to the receiver. The sub-cooled refrigerant liquid is then passed through a dryer and a gear pump. The gear pump transports the liquid to the electric pre-heater. A flow meter is located between the gear pump and the pre-heater to measure refrigerant flow rate. The refrigerant flow rate is independently controlled by the gear pump. The inlet vapor quality is determined by the heat input to the pre-heater, which is independently controlled. The test section saturation temperature is controlled by adjusting the cooling water flow rate to the postcondenser. The heat transfer rate is controlled by adjusting the temperature and flow rate of the cooling water. Thus, inlet the vapor quality, mass velocity and heat flux are independently controlled. II.2. Test facility Figure 2 shows a schematic diagram of the test facility. It includes the test section, refrigerant system and water system. Fig. 2: Schematic diagram of test facility A cross-section view of the test section is shown in Figure 3. Refrigerant flows inside tube, with high velocity cooling water in the annulus. The test tube is 583 Fig. 3: Cross-section view of the test section Water is moved by a variable speed centrifugal pump and enters the annulus side of the test section at a known temperature and flow rate. The water condenses the refrigerant flowing in the test section. The heated water leaves the test section and goes to a water-to-water heat exchanger. The cooled water goes to a storage tank, in which an electric cartridge heater is installed. The water is heated to the desired temperature. A turbine flow meter is placed between the pump and the test section to measure water flow rate. II.3. Data acquisition and reduction The data measuring instruments consist of five thermistors, two pressure transducers for measuring absolute pressures, one differential transducer for measuring pressure drop and two turbine flow meters to measure refrigerant and water flow respectively.
139 The pressure drop data were taken under adiabatic condition so that the acceleration and gravity terms were not included in the measured pressure drop. The overall measured pressure drop (ΔPexp) consisted of three components; the friction (ΔPf), entrance (ΔPi), and exit (ΔPe) pressure drop. (1) For single-phase liquid flow ΔPi and ΔPe can be calculated by the equations: (2) (3) Where; σ is the ratio of the test tube cross section area to the frontal area of the inlet and exit plenums, Ac/Afr. The Kc and Ke are functions of σ and Reynolds number. Kays and London (1984) provide graphs to determine σ, Kc and Ke for different cross section shapes. The ratio (Pi + Pe)/Pexp was between 0.1 and 0.3. The ratio Pf/Pexp. was between 0.8 and 0.95 depending on the test conditions. Therefore, uncertainties associated with evaluation of the entrance and exit losses are quite small. The friction factor l for single-phase flow is defined by the following equation: (4) The modified Wilson plot method as described by Farrell et al. (1991) was used to calibrate the annulus waterside heat transfer coefficient. The total heat transferred in the test section was determined from an energy balance on the water flow in the annulus: qt l 2 G 2 Pi 1 K 2 2 G 2 Pe 1 Ke 2 l Pf Dh fl 2 G / 2 4L l c m w c pw (T w,out T w,in ) (5) 1 q r x in cpr(tsat Tpre, in) (9) h m fg r The vapor quality change in the test section was given by: qt x m h r fg (10) The refrigerant side heat transfer coefficient was determined from the overall heat transfer coefficient and the calibrated annulus heat transfer coefficient (ha). The overall heat transfer coefficient (Uo) based on the outside area was provided by: (11) Where, Tln is the log-mean temperature. Assuming no fouling resistance in the annulus, the refrigerant heat transfer coefficient was determined by the equation: 1 hi (12) 1 1 Ai tai U o h a Aa kaavg Where, Aavg is the average of the inside and outside areas of the tube, t is the tube wall thickness and k is the tube wall conductivity. III Results and discussions III.1. Subcooled Liquid Flow Pressure Drop Pressure drop data were taken for R-134a at adiabatic conditions. Single-phase liquid friction factor was measured at room temperature. The friction pressure drops (Pf) of R-134a a function of the ReDh is shown in Figure 4 inside plain tubes. As expected, the friction pressure drops increases with increasing ReDh and hydraulic diameter in all tubes. In addition, the friction pressure drops increases with increasing hydraulic diameter of tubes. The vapor quality entering the test section (xin) is calculated from an energy balance on the pre-heater. The heat input to the refrigerant from the pre-heater (qr), is the sum of the sensible and latent heat. q r q q (6) sensible latent Where: q m c sensible q m h latent r r fg pr x (T sat pre,out T pre, in ) (7) (8) The test section inlet quality (xin), which is also the pre-heater exit quality (xpre,out), is calculated from Equation (6), (7) and (8). Fig. 4: Subcooled liquid R-134a friction pressure 584
140 drop vs. ReDh in plain tubes The Blasius friction factor equation (0.079ReDh) is shown the solid line based on hydraulic diameter in Figure 5. Experimental friction factors are shown 6% (average for all plain tubes) below the Blasius equation in Figure 5. All experimental friction factors data are shown that the friction factor can be predicted by the Blasius equation very well. in the form Nusselt number, (NuDhPr -1/3 ) vs. Reynolds number based on hydraulic diameter is shown in Figure 7 for R134-a in tubes at 40 o C saturation temperature. The Reynolds numbers exponent of the temperature fitting line equals to 0.8, same as the Dittus-Boelter equation, as given by Bergman et al. (2011). Fig. 5: Subcooled liquid friction factor with compared the Blasius equation. III.2. Subcooled Liquid Heat Transfer Figure 6 shows subcooled liquid R-134a heat transfer coefficient at 40 o C in plain tubes plotted vs. Reynolds number based on hydraulic diameter. Subcooled liquid heat transfer coefficient increases with decreasing hydraulic diameter. Fig. 7: Subcooled liquid NuDhPr -1/3 vs. ReDh at 40 o C in plain tubes The Petukhov equation was used to predict the data for tubes, as given by Bergman et al. (2011). The Reynolds number based on hydraulic diameter was used for this prediction. The ratio of the predicted-toexperimental (hpred/hexp) subcooled liquid heat transfer coefficient in tubes at 40 o C is shown in Figure 8. The hpred is given by the Petukhov equation and f = (1.58ln(ReDh) 3.28) -2 which is recommended by Webb et al. (2005) for use with the equation. Fig.6: Subcooled liquid R-134a heat transfer coefficient at 40 o C in plain tubes. The subcooled liquid heat transfer coefficient plotted 585 Fig.8: Comparison of experimental and predicted values of liquid heat transfer coefficient in plain tubes
.")

141 III.3 Condensation Heat Transfer The condensation heat transfer coefficient of R-134a refrigerant inside plain tubes plotted as a function of the vapor quality are shown in Figures 9 for mass velocities of G=300, 600, 1000 kg/m 2 s at 40 o C saturation temperature and constant heat flux (q ıı = 8 kw/m 2 ). The condensation coefficients increase with decreasing hydraulic diameter at 40 o C saturation temperature in the plain tubes. Figure 9 shows that the condensation heat transfer coefficient increases with increasing vapor quality and mass velocity for 40 o C saturation temperature. The continuity equation:. U = 0 (13) The momentum equation: ρ DU Dt = ρg p + μ 2 U (14) The energy equation: ρc p DT Dt = k 2 T + s (15) IV.2 Software usage Using the equations 13, 14 and 15, the experimental test section is analyzed in ANSYS-Fluent software packed program. Test section is modeled in CATIA program and transferred in.stp format to the ANSYS software. After that some geometrical mistakes are repaired. Geometrical model is shown in Figure 10. Fig.10: Geometrical model of test tube C. Fig. 9: Condensation heat transfer coefficient in plain tubes at 40 o C. IV. Numerical analysis Numerical analysis was carried out on the tube C, ( P). Number of elements and nodes are limited to approximately 1 million in order to decrease iteration time. There are two boundary conditions in the test section. To define them in Fluent, Inflation command is used. First boundary condition is between the micro tube and refrigerant fluid. The more complicated second boundary condition is between the water flowing in the micro tube and the water flowing in the annulus. All of the surfaces that are in contact with water are meshed using the Inflation command. Meshed test area is shown in Figure 11. IV.1 Numerical modeling ANSYS Fluent package program has been used in this study. This package program uses continuity equation, moment equation and energy equation to analyze geometrical model. The following assumptions are adopted: (1) The refrigerant liquid and water are Newtonian and incompressible (2) The flow is laminar (3) Single phase model is used (4) Constant thermo physical properties were considered for refrigerant liquid and water. Only a brief description mathematical computation methods are provided here, for further information interested readers can refer to the literature, Versteeg (2007) and Fluent manuals (2009). Equations used in this study have been expanded in three dimensions and are listed below; 586 Fig.11: Meshed area of test tube C. It should be stated that meshing is the most important progress in analyzing with numerical methods. Fluent software program uses energy, momentum and continuity equations to all elements which are created in meshing progress. Therefore, different meshes may change the results of numerical method. In this paper variety of meshes have been used and by
142 comparing the result the optimal mesh has been found. After the meshing progress, Fluent software is initialized with atmospheric pressure and experimental initial conditions are set up. IV.3 Software results Experimental and software results are compared for Tube C. MATLAB Curve fitting tool is used to acquire a mathematical model of the experiment. Curve fitting results of the experimental and the simulation heat transfer coefficient are shown for different mass velocities with error magnitude in Figure 12 and Figure 13 respectively. 2. Single-phase friction factors are reasonably predicted by conventional turbulent flow equation, the Blasius based on hydraulic diameter. Friction factors can be predicted very well by the Blasius equation with 6% below it. 3. The pressure gradient increases with decreasing hydraulic diameter. 4. Single-phase heat transfer coefficient is reasonably predicted by conventional turbulent flow equation, the Petukhov equation based on hydraulic diameter, within 15% for plain tubes 5. The condensation heat transfer coefficient increases with increasing vapor quality and mass velocity and with decreasing hydraulic diameter. 6. Numerical study results are compared with experimental results with satisfied results using ANSYS Fluent package program. Nomenclature Fig. 12: Curve fitting results of the experimental data Fig. 13: Curve fitting results of the simulation data Comparison between experimental results and software analyses results are given in Figure 14. Fig. 14: Comparison between experimental results and software analyses results Although an acceptable error is present the results are satisfying meaning software analyses could be used instead of experiments in order to save time and money. Furthermore with elaborated models and detailed meshing more precise results could be obtained. V. Conclusions 1. Pressure drop and sub-cooled liquid friction factor are reported for R-134a at 40 o C saturation temperature for hydraulic diameters between 1.26 mm and 2.64 mm in multi-port extruded aluminum plain tubes. 587 A : Heat transfer surface area or Area (m 2 ) b : Minor diameter (m) cp : Specific heat, (J.kg-1.K-1) D : Diameter (m) G : Mass velocity in tube (kg.m-2.s-1) h : Heat transfer coefficient (W.m-2.K-1) hfg : Latent heat (kj.kg-1) k : Thermal conductivity (W.m-1.K-1) K : Functions of σ and Reynolds number L : Flow length (m) m : Mass flow rate (kg.s-1) Nu : Nusselt number p : Wetted perimeter (m) P : Fluid pressure (Pa) Pr : Prandtl number q : Heat transfer rate (W) q" : Heat flux (W.m-2) Re : Reynolds number t :Tube wall thickness (m) T : Temperature (K) Uo : Overall heat transfer coefficient (W/m 2 K) U : Velocity (m 2.s-1) w : Major diameter (m) x : Vapor quality Greek letters P : Pressure drop (Pa) x : Vapor quality change Tln : Log-mean temperature difference (K) : Density (kg.m-3) σ : Ratio of Ac/Afr : Friction factor µ : Dynamic viscosity (kg.m-1.s-1) : Divergence Subscripts a : Annulus side ave : Average h : Hydraulic diameter of flow passages c : Cross sectional flow exp : Energy f : Friction fr : Frontal i : Entrance
143 in out e l Dh t pre r sat o w : Designates inner surface of tube : Designates leaving quantity : Exit : Liquid : Based on hydraulic diameter : Tube side : Pre-heater : Refrigerant : Saturation : Designates outer surface of tube : Water in annulus Webb R.L, Kim N.H, Principles of Enhanced Heat Transfer, 2 ed., Taylor & Francis, (2005). Webb, R.L., Ermis K., Effect of Hydraulic Diameter on Condensation of R-134A in Flat, Extruded Aluminum Tubes, J. Enhanced Heat Transfer, 8, 77-90, (2001). References Bergman T.L., Lavine A.S., Incropera F.P., DeWitt D.P., Fundamentals of Heat and Mass Transfer, 7 ed., John Wiley & Sons, New York, (2011). Cavallini A., Del Col D., Matkovic M., Rossetto L., Frictional Pressure Drop During Vapour Liquid Flow in Minichannels: Modelling and Experimental Evaluation, International Journal of Heat and Fluid Flow, 30, (2009). Derby M., Lee H.J., Peles Y., Jensen M.K., Condensation Heat Transfer in Square, Triangular, and Semi-Circular Mini-Channels, International Journal of Heat and Mass Transfer, , (2012). Farrell P., Wert K., and Webb R.L., Heat transfer and friction characteristics of turbulent radiator tubes, SAE transactions, 100-5, (1991). Fluent Inc, Fluent 12.0 User Guide, Fluent Inc, (2009). Garimella S., Condensation Flow Mechanisms in Microchannels: Basis for Pressure Drop and Heat Transfer Models, Heat Transfer Engineering, 25(3): , (2004). Gnielinski V., New method to calculate heat transfer in the transition region between laminar and turbulent tube flow, Forsch, Ingenieurwes, 61-9, 240, (1995). Kays W.M., London A.L., Compact Heat Exchangers, Third Edition, McGraw-Hill Book Company, (1984). Lopez-Belchi A., Illan-Gomez F., Vera-Garcia F., Garcia-Cascales J.R., Experimental Condensing Two-Phase Frictional Pressure Drop inside Mini- Channels Comparisons and New Model Development, International Journal of Heat and Mass Transfer, 75, , (2014). Sakamatapan K., Kaew-On J., Dalkilic A.S., Mahian O., Wongwises S., Condensation heat transfer characteristics of R-134a flowing inside the multiport minichannels, International Journal of Heat and Mass Transfer , (2013). Versteeg H.K., Malalasekera W., An Introduction to Computational Fluid Dynamics: The Finite Volume Method, (second ed.) Pearson, (2007). 588
144 Effect of Length of the Wavy Shaped Splitter Plate on Flow around a Circular Cylinder Mustafa Sarioglu 1*, Mehmet Seyhan 1, Yahya Erkan Akansu 2 1 Karadeniz Technical University, Engineering Faculty, Mechanical Engineering Department, Trabzon, 61080, Turkey 2 Niğde University, Engineering Faculty, Mechanical Engineering Department, Niğde, 51240, Turkey * [email protected] Abstract The effect of the amplitude length of wavy splitter plate attached to the rear of the circular cylinder was investigated at the range of attack angle between 0 and 45 for Re = Experimental results for the mean lift and drag force measured via load cell are presented. The force measurement results indicated that maximum drag reduction is approximately obtained 52% for M1 at β = 9, SSP1 at β = 12 and SSP2 at β = 6. On the other hand, M2 and M3 splitter plates, having higher amplitude, significantly reduced drag coefficient except for attack angle range between 0 and 18 when compared with the other plate models. The obtained results showed that the amplitude of the wavy splitter plate has a significant effect on drag and lift reduction for the high amplitude values. The wavy splitter plate manipulates the wake region by changing flow structure from 2d to 3D. Keywords: circular cylinder, wavy shaped splitter plate, drag reduction, lift force I. Introduction Bluff bodies are very often shown in engineering applications. Therefore, many researchers have been performed so many studies to reduce drag, and unwanted vortex shedding induced vibrations. These types unwanted effects can be reduced with the help of flow control methods that are classified as passive (Akansu et al., 2004; Sarioglu et al., 2006, 2005) and active (Akansu et al., 2013; Feng et al., 2012; Forte et al., 2007). Especially, passive flow control methods are used in practical engineering application such as chimneys, bridges, heat exchangers. In this method, geometric modifications such as splitter plate (Akansu et al., 2004; Roshko, 1954, 1961; Sarioglu et al., 2006), control rod (Fırat et al., 2015; Sarioglu et al., 2005), etc, are used in order to suppress vortex shedding, reduce drag and improve pressure distribution around the body. Available literature about passive control methods will be summarized with regard to two and three-dimensional flow structure in the following paragraphs. Roshko (1954) experimentally investigated the effect of the splitter plate on flow around the circular cylinder. He demonstrated that the splitter plate attached to the cylinder is significantly reduced the vortex shedding. Apelt et al. (1973) performed an experimental study on flow around the circular cylinder with splitter plate at Reynolds number between 10 4 and 5 x Their results indicated that the plate, having different L / D, was decreased drag coefficient and augment base pressure. An experimental study was implemented to investigate the effect of the rotatable circular cylinder with the splitter plate for L / D = 1 in the range of 8 x 10 3 < Re < 6 x 10 4 by Akansu et al. (2004). They showed that drag coefficient of this model obtained the minimum and maximum value at 15 and 75, respectively. Sarioglu et al. (2006) experimentally investigated the effect of attack angle (which is change between 0 and 180) on flow structure around a rectangular cylinder with splitter plate, having L/D = 1, in the range of between Re = 7.5 x 10 3 to 5.5 x Maximum drag reduction is obtained at attack angle 20 and 80. In the study of Shukla et al. (2009), the effect of hinged-rigid attached behind the circular cylinder at Re = Their results showed that Oscillation of splitter plate significantly is dependent on Reynolds number and L/D. Yucel et al. (2010) experimentally studied flow pattern of a circular cylinder with a short plate. This study showed that flow structure was significantly changed dependent on the vertical distance between the circular cylinder and the plate. In order to obtain three-dimensional flow structure around the bluff and aerodynamic body, both experimental and numerical studies are performed by many researchers. Johari et al. (2007) investigated the effect of three-dimensional flow structure provided via the wavy leading edge of NACA Darekar and Sherwin (2001) numerically investigated flow around a wavy square cylinder at the range of between Re = 10 and 150. They obtained drag reduction 16% when compared straight square cylinder for Re = 100. In the study of Lam et al. (2004), investigation of wake structure of a wavy cylinder is experimentally implemented by using different flow visualization techniques such as Laser Doppler Anemometer, Laser-Induced Fluorescence, and Digital Particle Image Velocimetry. Their results clearly revealed how to obtain three-dimensional flow structure around the wavy cylinder. Anderson and Szewczyk (1997) investigated the effect of wavy splitter plate at the angle of 0ᵒ. Their results showed that there is no significant effect of wavy splitter plate while attack angle is 0ᵒ. 589

145 The aim of this study is to elucidate the effect of the wavy shaped splitter plate on the rear of the circular cylinder in terms of converting 2-dimensionality into 3- dimensionality in flow structure. Additionally, to reveal the effect of attack angle on the flow control via wavy shaped splitter plate, experiments were performed between 0 and 45 with an increment of 3. Therefore, mean lift and drag forces were obtained with and without all splitter plates at different attack angles this al study. II. Experimental Setup Force measurement experiment was performed in the open type wind tunnel. Working section of the tunnel has square cross-section 570 mm x 570 mm. Freestream turbulence intensity is under 1%. Schematic view of the experimental setup is shown in fig.1. The test model consists of a circular cylinder having 30 mm diameter, splitter plate and an end plate having 240 mm diameter. The end plate is used in order to provide two-dimensionality and eliminate the end effect. The distance between two end plates, which is inserted ends of the circular cylinder, has 300 mm. The blockage ratio is 5% and 12% at β = 0 and 45, respectively. The test model was positioned to normal to flow direction. Force measurements for each wavy models were performed by using a six-axis ATI Gamma DAQ F/T load cell. This load cell is assembled with a rotary unit that is ISEL ZD30 model in order to rotate the desired angle of the model. Data collection is carried with the help of NIPCIe-6323 DAQ card with the sampling frequency of 0.5 khz. Free stream velocity, atmospheric pressure, the ambient temperature was measured via ManoAir500 micromanometer. Uncertainties for force measurement experiment was calculated as 6% Fig. 1: Schematic view of the experimental setup As shown in Fig. 2, M1 denotes wavy shaped splitter plate model one. The geometry of the wavy shaped splitter plate is defined as Lx = LN+ asin (2πx/λ), where Lx is the local width of the plate, LN is the node point length of the plate, a is the amplitude of wave, x is the spanwise location and λ is the wavelength of the wavy plate. LM and LS donate the middle point and saddle point of the wavy shape, respectively. Three different models having geometrical details are given in Table 1. Two different straight splitter plate, having LS = 37.5 and 60, were used. These straight splitter plates are named as SSP1 (LS = 37.5) and SSP2 (LS = 60). M1 M2 a λ Middle Point L S L M M3 Fig. 2: Schematic view of the wavy shaped splitter plates Tab. 1: Geometric parameters of the wavy shaped splitter plate Geometric Parameters of M1 M2 M3 Plate (mm) Node point length (LN) Amplitude (a) Wavelength (λ) Total length (LS) Average length (LM.) IV. Results and discussions In order to investigate the effect of amplitude of the wavy splitter plate on the mean drag and lift coefficient, force measurement experiment was performed angle of incidence between 0 and 45 with an increment of 3 for Re = The variation of the mean drag coefficient acting on the circular cylinder with wavy and straight splitter plates is shown in Fig. 3. At β = 0, CD for BC is measured as 1.2. On the other hand, the values of CD are obtained 0.8 for M1, 0.78 for M2 and SSP2, 0.77 for M3 and 0.73 for SSP1. These drag reduction revealed that these splitter plates significantly prevents and delays the interaction of separated shear layers on flow around this model. For M1, SSP1, and SSP2, maximum drag reduction is approximately obtained 52% at β = 9, 12 and 6, respectively. M1, having the lowest amplitude, shows similar trend like straight splitter plate (SSP2) because the geometric structure of its come close to the SSP2 when decreasing the amplitude of its. This situation also is closely related to reattachment of the separated shear layer at these angles. The values of CD of the M2 and M3 start to increase after β = 12 and 18, respectively. CD for M2 and M3 is approximately constant from β = 17 to 33. The mean drag coefficients of M1, M2, M3, SSP1, and SSP2 are respectively smaller than those of BC (bare cylinder) up to β = 23.8, 30, 30.6, 25.5 and 19.7, respectively. As expected, these results indicated that these critical angles significantly depend on cross section area of the plates. M2 and M3 have smaller drag coefficient value between 18 and 45 when it is compared with M1, SSP1, and SSP2. A sudden decrease in CD for M1 and SSP2 is seen after β = 36 and 33. L N Node Point Saddle Point 590
146 C D 2,5 2,0 1,5 1,0 0,5 Re=20000 M1(L N =45) M2(L N =30) M3(L N =15) SSP1(L S =37,5) SSP2(L S =60) BC 0, [ ] Fig. 3: Comparison of the mean drag coefficient of the test models for β=0 and 46 at Re = The variation of the mean lift coefficient is plotted in Fig. 4 as a function of the angle of attack between 0 and 45. The maximum lift coefficient is obtained 1.55 for SSP2 at β = 6, 1.32 for M1 at β = 9, 1.22 for SSP1 at β = 12, 0.83 for M2 at β = 9, 0.37 for M3 at β = 12. As it was in drag coefficient plot, these results indicated that variations of lift coefficient depend on cross section area of the plates. In addition to this, M2 and M3, having a higher amplitude of the plate, shows lower CL when compared with other plate configurations. C L 2,0 1,5 1,0 0,5 0,0 U U F L F L F D F D β β decrease fluctuating forces acting on the cylinder. On the other hand, M1, SSP1, and SSP2 shows maximum drag reduction (approximately 52%) at β = 9, 12 and 6, respectively. Nomenclature CD LDU 2 : Drag coefficient based on D, F D/0.5 CL : Lift coefficient based on D, F L/0.5 2 LDU D : Diameter of the circular cylinder (m) FD : Drag Force (N) FL : Lift Force (N) L : Length of the plate (m) LM : Middle point of wavy shaped splitter plate LN : Node point of wavy shaped splitter plate LS : Saddle point of wavy shaped splitter plate Lx : Local length of the splitter plate Re : Reynolds number based on D, U D/ U : Freestream velocity (m / s) a : Amplitude of wave β : Attack angle x : Spanwise location λ : Wavelength of wave : Density of air (kg / m 3 ) : Viscosity (Pa.s) Subscripts BC : Bare cylinder M : Wavy splitter plate SSP : Straight splitter plate References Akansu, Y.E., Karakaya, F., Şanlısoy, A., Active Control of Flow around NACA 0015 Airfoil by Using DBD Plasma Actuator, in: EPJ Web of Conferences, EDP Sciences, p (2013). -0,5-1,0-1,5-2,0 M1(L N =45) M2(L N =30) M3(L N =15) SSP1(L S =37,5) SSP2(L S =60) BC -2, [ ] Fig. 4: Comparison of the mean lift coefficient of the test models for β=0 and 46 at Re = V. Conclusions In this study, the effect of the amplitude of wavy splitter plate attached to the rear of the circular cylinder was investigated in terms of aerodynamic forces reduction such as drag and lift at the range of attack angle between 0 and 45 for Re = The mean drag coefficient results revealed that M2 and M3 splitter plates, having higher amplitude, significantly reduced drag coefficient except for attack angle range between 0 and 18 when compared with the other plate models. High amplitude wavy shaped splitter plates significantly suppress vortex shedding by means of 3D flow separation. This will also 591 Akansu, Y.E., Sarioglu, M., Yavuz, T., Flow around a rotatable circular cylinder-plate body at subcritical Reynolds numbers, AIAA journal 42, (2004). Anderson, E. A., Szewczyk, A. A., Effects of a splitter plate on the near wake of a circular cylinder in 2 and 3-dimensional flow configurations, Experiments in Fluids 23, (1997). Apelt, C.J., West, G.S., Szewczyk, A.A., The effects of wake splitter plates on the flow past a circular cylinder in the range 10 4 < Re < 5 x 10 4, Journal of Fluid Mechanics 61, (1973). Darekar, R.M., Sherwin, S.J., Flow past a squaresection cylinder with a wavy stagnation face, Journal of Fluid Mechanics 426, (2001). Feng, L. H., Jukes, T. N., Choi, K. S., Wang, J. J., Flow control over a NACA 0012 airfoil using dielectricbarrier-discharge plasma actuator with a Gurney flap, Experiments in fluids 52, (2012). Fırat, E., Akansu, Y.E., Akilli, H., Flow past a square prism with an upstream control rod at incidence to
147 uniform stream, Ocean Engineering 108, (2015). Forte, M., Jolibois, J., Pons, J., Moreau, E., Touchard, G., Cazalens, M., Optimization of a dielectric barrier discharge actuator by stationary and non-stationary measurements of the induced flow velocity: application to airflow control, Experiments in Fluids 43, (2007). Johari, H., Henoch, C.W., Custodio, D., Levshin, A., Effects of leading-edge protuberances on airfoil performance, AIAA journal 45, (2007). Lam, K., Wang, F.H., So, R.M.C., Three-dimensional nature of vortices in the near wake of a wavy cylinder, Journal of Fluids and Structures 19, (2004). Roshko, On the drag and shedding frequency of twodimensional bluff bodies, NACA Technical Note (1954). Roshko, A., Experiments on the flow past a circular cylinder at very high Reynolds number, Journal of Fluid Mechanics 10, (1961). Sarioglu, M., Akansu, Y.E., Yavuz, T., Flow Around a Rotatable Square Cylinder-Plate Body, AIAA Journal 44, (2006). Sarioglu, M., Akansu, Y.E., Yavuz, T., Control of the flow around square cylinders at incidence by using a rod, AIAA journal 43, (2005). Shukla, S., Govardhan, R.N., Arakeri, J.H., Flow over a cylinder with a hinged-splitter plate, Journal of Fluids and Structures 25, (2009). Yucel, S.B., Cetiner, O., Unal, M.F., Interaction of circular cylinder wake with a short asymmetrically located downstream plate, Experiments in Fluids 49, (2010). 592
148 Investigation of the Effect of the Plasma Actuators Vertically Placed On the Spanwise of NACA0015 Airfoil Hurrem Akbiyik 1*, Hakan Yavuz 1, Yahya Erkan Akansu 2 1 Çukurova University, Engineering and Architecture Faculty, Mechanical Engineering Department, Adana, 01380, Turkey 2 Niğde University, Engineering Faculty, Mechanical Engineering Department, Niğde, 51240, Turkey Abstract * [email protected] An experimental study about effect of the plasma actuators on lift and drag forces acting on NACA0015 airfoil is performed. The experiments are carried out at an open-suction type wind tunnel at Re= The linear dielectric barrier discharge (DBD) plasma actuators are mounted in the same direction with airfoil chord length. The experimental parameters are considered the different electrode lengths and the electrodes located on the airfoil at y/s= 0.14, 0.24, 0.34, 0.44, 0.54, 0.64, 0.74, 0.84, and 0.94 where y and S denotes direction and span length, respectively. The dimensionless actuator lengths are chosen as L/C= 1.1, 1.05, 1, 0.95, and The plasma excitation frequency is set to 3.5 khz and the applied voltage is arranged at 6kVpp value. The flow structure around NACA0015 airfoil is visualized for attack angles chosen as 0º, 5º, 10º, 15º with the help of smoke-wire flow visualization method. The effect of the actuator on the drag and lift forces of the NACA0015 airfoil is obtained for the geometrical parameters. The experimental results show that the usage of the vertically placed plasma actuators reduce the drag for ratio of L/C=1.1. In this case, the maximum reduction of the drag coefficient was approximately 25% at the attack angle of 10. The maximum improvement in the lift coefficient was approximately 110% for the attack angle of 12 at L/C=1.1. There is no significant effect for increase in lift when the dimensionless actuator length was L/C=0.9 and less values of this actuator length. Keywords: DBD plasma actuator, NACA0015 airfoil, drag force, lift force, flow visualization I. Introduction Increase in lift force and decrease in drag force acting on wings of an airplane have a crucial importance with respect to energy efficiency of the flight. Therefore, control of flow around an airfoil performance with regards to the lift and drag coefficient is widely studied subject of the airfoil aerodynamics. A Dielectric Barrier Discharge (DBD) plasma actuator is newly used and an active flow control device that aims at improving the performance of the airfoils. Due to the advantages of the DBD plasma actuators, there has been a great deal attention by many researchers for last decades in this field. The plasma actuators can be used for different applications. The enhancement in lift and the reduction in drag are studied by Jukes and Choi (2009), Benard et al. (2009), Jukes et al. (2013) and Bouremel et al. (2013). The experiments about the investigation of the wake region of the aerodynamic models were made by Jukes and Choi (2009), Benard et al. (2009), Jukes et al. (2013), Bouremel et al. (2013), Sosa et al (2007), and Sosa and Artana (2006). Also, the plasma actuators were used to suppress the vortex shedding by Benard et al. (2009) and the control of the stall was examined by Jukes et al. (2013) and Sosa et al. (2007). The DBD plasma actuator consists of two electrodes and a dielectric material is placed between them. One electrode is covered by the dielectric material while the other electrode is exposed to air. The embedded electrode is grounded and the exposed electrode is connected to high voltage. The DBD plasma actuators can be placed at the different positions on the airfoils depending on the benefits to the application. A DBD plasma actuator placed along the spanwise direction used in order to improve the lift and to reduce the drag in the experiments of Benard et al. (2009). In their experiment, the actuators were activated steadily and unsteadily in order to improve aerodynamic performance of a NACA0015 airfoil at Re=2.6x10 5. They reported that an increase in applied voltage amplitude give rise to the enhancement in lift and the reduction in drag. Also, the frequency of the sinusoidal waveform changed the aerodynamic performance of the airfoil. Aono and Okada (2014) studied that a momentum coefficient of the single DBD actuator on control of stall of the NACA0015 airfoil at Reynolds number of 2.6x10 5. Their experimental results indicated that the increase in momentum coefficient enhanced the aerodynamic performance and the usage of burst frequency gave rise to suppression of the leading-edge separation via small momentum coefficients. Asada et al. (2009) showed the effect of plasma actuators via duty cycle for the NACA0015 airfoil at a wind tunnel in the range of Reynolds number between 4.4x10 4 and 1.0x10 5. Their results revealed that the increase in applied voltage led to effective stall control. The smaller burst ratio need more input energy, but it has more separation control capability. A DC corona surface plasma actuator was placed on the leading edge of the NACA0015 airfoil by Magnier et al. (2007). They reported that he induced flow added the velocity to the boundary layer. Thus, the induced flow prevented the separation of 593
 studied that the unsteady actuation design was performed in order to see the influencing factors and regularity effects in the flow hysteresis on the NACA0015 airfoil by the help of DBD plasma")


149 the flow around the airfoil. Sun et al. (2012) studied that the unsteady actuation design was performed in order to see the influencing factors and regularity effects in the flow hysteresis on the NACA0015 airfoil by the help of DBD plasma actuator. The investigated parameters were free-stream velocity, attack angle, and the duration of the actuator. It was seen that the increased duration of flow hysteresis effect gave rise to reduction in power consumption by non-steady plasma actuation. An experimental study of Jukes et al. (2013) revealed that the usage of spanwise plasma actuators can help the managing the fluctuating loads on the airfoils. Furthermore, the increase in lift was obtained at low Reynold numbers and low attack angles. Jukes and Choi (2009) reported that the performance of the plasma actuators in case the control of the flow has a dependence of their location. an exposed electrode. The dielectric material which is Kapton dielectric tape with thicknesses of 0.07 mm is placed between them. A custom-made power amplifier is used in order to produce the plasma. The applied plasma voltage and frequency are obtained set as 6 kvpp and 3.5 khz, respectively. The sinusoidal signal waveform was measured by using Tektronix TDS2012B model oscilloscope. The applied voltage was monitored by the help of Tektronix P6015A model voltage probe connected to the oscilloscope. λ The aim in this study is the improvement of the aerodynamic performance of an airfoil at low Reynolds number (Re=36000) by the help of the vertically placed plasma actuators along the span. The lift and drag forces were obtained for the different length of the electrodes. The flow structure and the wake region were visualized by the help of the smokewire method. II. Experimental Setup Experiments are conducted on a wind tunnel with a test section of 570 mm x 570 mm x 1000 mm. As seen in Fig. 1., the test model and schematic of the experimental setup are illustrated. The NACA0015 airfoil is used as a test model in the experiments. The chord length and spanwise length of the airfoil are 150 mm and 540 mm, respectively. Fig. 2: Arrangement of the plasma actuator positions for span direction Fig. 1: Schematic view of the experimental setup As it is seen in Fig. 2., the plasma actuators were mounted vertically on the NACA0015 airfoil at y/s= 0.14, 0.24, 0.34, 0.44, 0.54, 0.64, 0.74, 0.84, and 0.94 where y and S denotes direction and span length, respectively. Fig. 3. shows that the actuator lengths are varied as 135mm, 142.5mm, 150mm, 157.5mm, and 165mm. Each plasma actuator consists of an embedded and Fig. 3: Arrangement of the plasma actuator lengths for chord direction In order to measure drag and lift forces, ATI Gamma model six axes load cell is used. Test model mounted on a rotary unit to arrange attack angle of the model. Measurements are taken at 10 Hz sampling frequency and 100 values were averaged during 10 second. Therefore, 100 values were taken for each measurement and it has been repeated twice. 594


150 Fig. 4: The schematic view of the smoke-wire flow visualization technique To visualize the flow structure around the NACA0015 airfoil, the smoke-wire method was used. Fig. 4. shows the schematic of the smoke-wire flow visualization method. A DC power supply was used to produce white smoke from liquid paraffin. IV. Results and discussions Effects of the vertically placed plasma actuators along the span of the NACA0015 airfoil are investigated. Five different length plasma actuators were obtained for the experiments and they were activated at 3.5kHz applied frequency and 6kV peak to peak applied voltage. The length of the vertical placed plasma actuators helped to achieve flow control around the airfoil. The dimensionless actuator length is varied as L/C=1.1, 1.05, 1, 0.95, and As it is seen from Fig. 5., the stall angle was shifted from 8 to 10 compared with the no plasma condition on the airfoil at Re=36000 in case the dimensionless actuator length was L/C=1.05, 1, and In the case of L/C=1.1, the shifted stall angle reached up to 12. There is no change about the stall angle for the L/C values that is 0.9 or less. For the attack angle of 12, the lift coefficient value is observed to be increasing from 0.45 to 0.65 (approximately 45% increase) at L/C=0.95. Also, the lift coefficient was improved approximately 66% and 77% at the L/C ratio of 1.05 and 1, respectively. Moreover, the maximum improvement in the lift coefficient is obtained to be approximately 110% relative to its value for base airfoil, where its value increased from 0.45 to 0.95 at L/C ratio of 1.1. There is no significant effect in lift coefficient for the dimensionless actuator length value of 0.9 or less. For the attack angle of 10, the lift coefficient has nearly the same enhancement (110%) performance for the dimensionless actuator length (L/C) ratios of 1.1, 1.05, 1, and However, lift coefficient is observed to be increased approximately 45% when the dimensionless actuator length ratio (L/C) is set to 0.9. At this smallest length case, the actuator location was stayed behind the separation point of the airfoil and plasma actuator could not manipulate sufficiently the shear layers near the leading edge. Fig. 5: Effect of the electrode length on lift coefficient of the NACA0015 airfoil The reduction in drag coefficient was observed by using vertically placed plasma actuators. Therefore, the plasma actuator length was varied and examined in order to obtain the limit of the effect of the vertically placed plasma actuator in drag coefficient of the airfoil. As can be seen from Fig. 6., the vertically placed plasma actuators did not effectively changed the drag coefficient of the airfoil for the L/D=0.9. The reduction in drag coefficient was observed for the maximum actuator length of 1.1. Drag Coefficient, C D Electrode Length Plasma Off x/c = 0.9 x/c = 1.1 Re = 3.6x Attack Angle, Fig. 6: Effect of the electrode length on drag coefficient of the NACA0015 airfoil The maximum reduction in drag was 25% in the attack angle 10. Mueller (2002) showed that the lift and drag coefficient of the smooth airfoils can be considerably changed in the range of the Reynolds number between10 3 and He described that, the free shear layer after laminar separation normally does not transition to turbulent flow in time to reattach at below chord Reynolds numbers of about 5.0 x 10⁴. Near the upper end of this range, the critical Reynolds number can be decreased by using boundary layer trips. In our study, the induced flow generated by the vertically placed actuators may affect as trips and the transition in the boundary layer causes to decrease in drag and increase in lift force. The smoke-wire method was used in order to visualize the flow around the NACA0015 airfoil at Re=20000 and L/C=1.1. The attack angle was varied from 0 to 15 with the increment of 5. The applied 595


151 voltage and applied frequency of the plasma actuator were set as 6 kvpp and 3.5 khz, respectively. angle of 10. The wake region width of the airfoil via plasma actuators was narrower than the airfoil without plasma actuators at this attack angle. The effect of vertically placed plasma actuators was not sufficient for the flow control around the airfoil when the attack angle increased to α=15 at the applied voltage of 6kVpp and applied frequency of 3.5kHz. Plasma Off α=0 Plasma On α=0 Plasma Off α=5 Plasma On α=5 Fig. 7: Visualized flow around the NACA0015 airfoil with applied flow control method for V=6kVpp and f=3.5khz at Re=20000 As it can be seen from Fig. 7., the separated flow was reattached from leading edge to trailing edge of the airfoil by the vertically placed actuator at α = 5. The reattachment of the flow on the surface of the airfoil leads to a higher lift coefficient. Also, the growing boundary layer on trailing edge of the airfoil was reattached on the surface by the help of plasma actuators. The results for the separated shear layer was nearly the same for the case of the plasma on and the plasma off when the attack angle was α=0. Plasma Off α=10 Plasma On α=10 Plasma Off α=15 Plasma On α=15 Fig. 8: Visualized flow around the NACA0015 airfoil for V=6kVpp and f=3.5khz at Re=20000 In Fig. 8., it is shown that the flow separation occurred from the leading edge of the airfoil while the attack angle was increased. The separated flow became closer to the surface of the airfoil by the activation of the vertically placed plasma actuators at the attack 596 V. Conclusions In this study, the effect of the vertically placed plasma actuators on flow control around the NACA0015 airfoil was investigated at Re= For the experiments, five dimensionless electrode lengths were used as an active flow control device and they were varied as L/C=1.1, 1.05, 1.0, 0.95, and The lift and drag coefficient of the airfoil were examined by varying the attack angle. The flow structure and the wake region were visualized by the help of the smoke-wire method. The attack angle was varied from 0 to 15 with the increment of 5. The attack angle is shifted by the plasma actuators from 8 to 12 at the dimensionless actuator length of L/C=1.1. For the attack angle of 12, the maximum improvement in the lift coefficient was approximately 110%, where its value increased from 0.45 to 0.95 at L/C=1.1. There is no significant effect for increase in lift when the dimensionless actuator length was L/C=0.9. The drag coefficient of the airfoil was reduced for the all attack angles while the dimensionless electrode length was L/C=1.1. The maximum reduction in drag was 25% at the attack angle of 10. The separated flow was reattached from leading edge to trailing edge of the airfoil by the vertically placed actuator at α = 5. Due to the reattachment of the flow on the surface of the airfoil, it led to a higher lift. The separated flow became closer to the surface of the airfoil by the activation of the vertically placed plasma actuators at the attack angle of 10. The wake region width of the airfoil via plasma actuators was narrower than that of the airfoil without plasma actuators at this attack angle. Nomenclature CD : Drag coefficient based on D, F D/0.5 2 LDU CL : Lift coefficient based on D, F L/0.5 LDU 2 U : Freestream velocity (m / s) S : Span length (mm) Re : Reynolds number based on D, U D/ α : Attack angle L/C : Dimensionless electrode length Vpp : Peak to peak applied voltage Subscripts DBD : Dielectric Barrier Discharge DC : Direct Current References Asada, K., Nomomiya, Y., Oyama, A., Fujii, K., Airfoil flow experiment on the duty cycle of DBD plasma
152 actuator, 47 th AIAA Aerospace Sciences Meeting Including The New Horizons Forum and Aerospace Exposition, 5-8 January, Orlando, Florida (2009). Aono, H., Okada, K., Effects of burst frequency and momentum coefficient of DBD actuator on control of deep-stall flow around NACA0015 at Rec = 2.6x10 5, AIAA SciTech, 52 nd Aerospace Sciences Meeting, January, National Harbor, Maryland 42, (2014). Benard, N., Jolibois, J., Moreau, E., Lift and drag performancesof an axisymmetric airfoil controlled by plasma actuator,, Journal of Electrostatics, 67, p (2009). Bouremel, Y., Li, J.M., Zhao, Z., Debiasi, M., Effects of AC Dielectric Barrier Discharge plasma actuator location on flow separation and airfoil performance, Procedia Engineering-7 th Asian-Pacific Conference on Aerospace Technology and Science, 67, p (2013). Jukes, T.N., Segawa, T., Furutani H., Flow control on a NACA4418 using Dielectric-Barrier-Discharge vortex generators, AIAA Journal, 51, (2013). Jukes, T.N., Choi K.S., Flow control around a circular cylinder using pulsed dielectric barrier discharge surface plasma, Physics of Fluids, 21, p (1994). Jukes, T.N., Choi K.S., Control of unsteady flow separation over a circular cylinder using dielectricbarrier-discharge surface plasma,, Physics of Fluids, 21, p , no.9 (2009). Sosa, R., Artana, G., Moreau, E., Touchard, G., Stall control at high angle of attack with plasma sheet actuators, Experimental Fluids 42, (2007). Sosa, R., Artana, G., Steady control of laminar separation over airfoils with plasma sheet actuators, Journal of Electrostatics, 64, (2006). Magnier, P., Hong, D., Leroy-Chesneau, A., Bauchire, J.M., Hureau, J., Control of separated flows with the ionic wind generated by a DC corona discharge, Experimental Fluids 42, (2007). Mueller, T.J., Fixed and flapping wing aerodynamics for micro air vehicle applications, Chapter an overview of Micro Air Vehicle Aerodynamics-AIAA Journal, 195, no.5, (2002). Sun, M., Yang, B., Zhang, Z.T., Lei, M.K., Experimental study on flow hysteresis effect on NACA0015 airfoil using DBD plasma actuator, Surface & Coating Technology, (2012). 597
153 Second Law Analysis of Coupled Heat and Mass Transfer through Combined Non Gray Gas Radiation within a Cylindrical Annulus Sakly Abir 1*, Mazgar Akram 2, and Ben Nejma Faycal 1 1 Unit of Ionized and Reactive media study, Preparatory Institute for Engineering Studies of Monastir, University of Monastir, Avenue Ibn Eljazar Monastir 5019, Tunisia 2 Institute of Applied Sciences and Technology, Mahdia, Monastir University, Sidi Messaoud, 5111, Mahdia, Tunisia * [email protected] Abstract A numerical computation is performed to analyse entropy production due to heat and mass transfer through a cylindrical annulus. The inner cylinder, covered by a thin water film, is assumed to be adiabatic, while the outer is considered to be isothermal and dry. A special attention has been given to the effect of the radiative heat transfer and its dependence on entropy generation. The radiative part of this study was solved using the Ray Tracing method through S4 directions, associated with the statistical narrow band correlated-k (SNBCK) model. The temperature and the mass evaporated fields were used to calculate the distributions of volumetrique and global entropy production. The impact of the dry wall temperature and channel thickness are presented in this paper. Keywords: Entropy production, heat and mass transfer, Ray tracing, SNBCK model, thermal radiation. I. Introduction Entropy production is a particularly interesting filed of the thermal sciences. It has been used as a reference for evaluating the significance of irreversibility related to friction, heat and mass transfer. Recently, many researchers have analysed the second law of thermodynamics in thermal engineering systems. Bejan (1979) has introduced the concept of irreversibility distribution ratio and entropy generation number. He has presented spatial distribution profiles of entropy production. On other study, Bejan (1987) has proposed different analytical expressions for entropy generation in a circular duct also for several engineering processes. Moreover, San et al. (1987) have studied the irreversibility generated by heat and mass transfer during coupled conduction-convection transfer in a channel. Their results have shown that entropy creation is related to the gradients of velocity, temperature, concentration, and physical properties of the fluid. Later, entropy generation due to mass transfer has been studied by some investigators who focused on the effect of mass transfer on the analytic expression of the entropy generation, Carrington and Sun (1991, 1992). Besides, Yilbas (2001) has shown that increasing Brinkman s number causes an increase in the temperature of the adjacent fluid of the rotating cylinder wall. Tasnim and Mahmud (2002) have focused on studying entropy production in a vertical annular space. They have determined irreversibility characteristic analyses in terms of entropy generation in the case of laminar mixed convection. Simultaneously, Mahmud and Fraser (2002, 2003) have examined the second law of thermodynamics characterizing fluid flow and heat transfer. They have found that entropy generation rate shows an asymptotic behavior when the rotation of the inner cylinder is greater than the outer one. Haddad et al. (2004) have investigated the entropy creation due to laminar forced convection in the entrance region of concentric annulus. They have found that rising the Eckert number causes an increase in entropy production. However, the evaluation of entropy generation due to radiative heat transfer in participating media has been examined by Arpaci (1986, 1991) and Arpaci and Selamet (1986, 1991) have investigated the radiative entropy production by analogy to that due to conduction, which is true in the case of an optically thick medium. In their study of entropy generation due to interaction of the radiative field with solid boundaries, Wright et al. (2001) extended and generalized this formalism for grey and non-participating media. Lately, Caldas and Semiao (2005, 2007) and Liu and Chu (2007) have adapted this approach for non-grey and participating media. Ben Nejma et al. (2008) have established a numerical study of entropy generation due to the radiation of a non-gray gas confined between two parallel plates. They have paid a special attention to entropy production and its dependence on geometric and thermodynamic parameters. Later, Ben Nejma et al. (2011) have proposed a numerical computation of entropy generation due to radiative heat transfer through an absorbing-emitting non-grey gas, confined in a spherical enclosure. Mazgar et al. (2009, 2013) have extended this last work to develop entropy production in the entrance region of a circular duct. Furthermore, Elazhary and Soliman (2014) have studied the entropy creation during a fully devepoped forced convection between two parallel plates with an imposed pressure gradient and a uniform wall heat flux. They have found that the entropy production due to heat transfer and fluid 598
154 friction increased with Brinkman number. Shojaeian and Kosar (2014) have analysed convective heat transfer and entropry production for a Newtonian and non-newtonian fluid flow between two parallel plates. They deduced that the increase in the slip coefficient leads to an increase in both Bejan number and Nusselt number, whereas a decrease in global entropy generation rate was also deduced. In the past, a number of experiments and numerical computations have been presented for describing the coupled heat and mass transfer in the liquid film. Seban and co-workers (1971, 1976) have investigated experimentally and theoretically the evaporation from a liquid water film to pure water vapour. They have focused in the theoretical work on the transport processes in the film. However, for their early study, they have aimed on heat and mass transfer in gas stream by supposing that liquid film to be thin. The effects of the liquid film temperature and the relative humidity of the moist air in heat and mass transfer has been investigated by Lin et al. (1988). They have deduced that the Heat transfer in the flow is dominated by the transport of latent heat in association with the vaporization of the liquid film. Tsay et al. (1990) have observed that the cooling of the film is mainly caused by the latent heat transfer connected with the vaporization of the liquid film. They conclude from the experience that a high temperature drop for a rise in the inlet temperature of the film. Effects of film evaporation on laminar convection heat and mas transfer in a vertical channel has been analysed by Yan (1992). He has demonstrated that the heat transfer between the gas stream and the interface is dominated by the transport of latent heat associated with the liquid film evaporation. He has concluded also that the assumption of extremely thin film is only valid for low liquid mass flow rate. Aubert and Solliec (2009) have developed a numerical study of falling films in order to protect a wall from a radiative heat source. Their work is based on a 2D unsteady numerical modeling of the phenomena, as well as an experimental study. The numerical results allow to highlight the weakness of mass transfer by evaporation in comparison with the convective heat transfer induced by the falling film. Their experimental results demonstrate that the water film is sufficiently effective in terms of protection against a radiative heat source. A numerical study has been carried out by Chiu and Yan (2008) to develop the radiation effect on the characteristics of mixed convection fluid flow and heat transfer in inclined ducts. Their results indicate that radiation effects have a considerable impact on heat transfer and tend to reduce thermal buoyancy effects. More recent, a numerical study on the effect of gas radiation and laminar forced convection on evaporation within a vertical channel formed by two parallel vertical plates has been analysed by Ben Nejma and Slimi (2011). They have exhibited that the existence of water vapor, even in small quantities, enhances heat transfer rate and rises the evacuated flow rate considerably. The performance of a falling water film as a thermal protection for composite walls 599 exposed to a radiant flux has been analysed by Aubert et al. (2013) who have found that the wall can be maintened at a low temeperature (around 303 K) when exposed to heat fluxes. Recently, Sakly et al. (2015) have studied forced convection and thermal radiation in a cylindrical annulus formed by a wet adiabatic wall covered by a thin water film and an isothermal dry one. They have accorded a special attention to gas radiation contribution on the humidification process. They have deduced that the presence of gas radiation reduces the wet wall temperature and contributes to its surface protection. Dispite the numerous investigation cencerning entropy production and evaporation in a liquid film within differente geometries, the second law analysis of coupled heat and mass transfer through combined non gray gas radiation still not been adequately studied. The present paper reports a numerical determination of thermal and geometrie conditions on entropy production due to heat and mass transfer within a cylindrical annulus formed by a dry isothermal wall and an adiabatic wall covered by a thin water film. II. The Hybrid SNBCK Model The method of Statistical Narrow Band Correlated-K (SNBCK) is based on a particular model developed by Goutière et al. (1999) for non-grey gas radiation transfer. The application of this method has demonstrate that this model is an efficient narrow-band for radiative transfer calculation as well as for low-resolution spectral intensity prediction. However, the SNBCK method using the 4 point gauss quadrature known as the SNBCK4 model where the proprieties of gas radiation are repressented by four grey gases at each non-overlapping band as used by Lui et al. (2000). The SNBCK model used by Ben Nejma et al. (2010, 2011) can overcome the difficulties of the SNB model by extracting the gas absorption coefficients from the gas transmissivity given by Malkmus (1967): τ ν = exp [ πb 2 4AL { 1 + 1}] (1) πb The analytical expression (Eq. 2) of the cumulative function has been derived by Lacis and Oinas (1991): g(κ) = 1 2 [1 erf ( a κ b κ)] [1 erf ( a κ + b κ)] e πb (2) Where;a = 1 πab b = πb 1 and erf is the error A function. Using the cumulative function g, the narrow-band average of any radiative variable φν can be calculated as: φ ν = w i φ(g i ) 4 i=1 (3)
 model, to solve the radiative transfer equation (eq. (5)) as well to deduce the radiative properties of the gas and its spectral nature.")
 dl = κ ν i I ν i (r, Ω ) + κ ν i I ν b (T) (5) div(q r ) = w i κ ν i [I ν b I ν i (Ω )]dω ν III. Analysis 4 bands 4π i=1")
155 The estimation of the various monochromatic absorption coefficients is thus lead to the resolution of the system: g(κ ν i ) = g i (4) The Ray Tracing method through S4 directions is associated with the statistical narrow band correlated-k (SNBCK) model, to solve the radiative transfer equation (eq. (5)) as well to deduce the radiative properties of the gas and its spectral nature. We have chosen the 1-D radiative analysis (slab problem), supposing that, the temperature and the mass fraction depend only on the radial direction. di ν i (r,ω ) dl = κ ν i I ν i (r, Ω ) + κ ν i I ν b (T) (5) div(q r ) = w i κ ν i [I ν b I ν i (Ω )]dω ν III. Analysis 4 bands 4π i=1 (10) III.1. Physical model and assumptions This paper deals with a numerical investigation of combined heat and mass transfers by a steady air forced flow within a duct which is formed by two coaxial and cylinders.the duct s inner wwall is assumed to be adiabatic and wet, while the outer one is supposed to be grey, impermeable and maintained at a constant temperature. The inner cylinder, covered by a thin liquid water film, is considered a black body, since water absorbs radiation in the infrared. Where I ν i (r, Ω ) represents the solution of the following recurrent relation: I k = exp[ κ ν i l jk+1 k (Ω )]l k+1 (r, Ω ) + [1 exp[ κ ν i l jk+1 k (Ω )]] I ν b (6) l and is the optical path shown in fig. 2 and calculated with: l jk+1 k (Ω ) = (1 η²)r 2 k+1 r 2 j ξ² (1 η²)rk 2 rj 2 ξ² (7) 1 η 2 Fig. 2: Physical description of the system Fig. 1: Optical path We note that the scattering effect is neglected since the medium contains no particles. The surfaces are assumed to be diffusely reflective. The radiative boundary conditions are given as: I ν i (r = R 1, Ω ) = I ν b (T(r = R 1 )) { I i ν (r = R 2, Ω ) = 1 ε 2 π I ν i (r = R 2, Ω )ξ(ω )dω + ε 2 I b ν (T w ) Ω Ω.n >0 (8) The expression of the radiative flux is given as follows: 4 bands 4π i=1 (9) q r = w i I ν i (Ω )ξ(ω )dω ν The radiative source term given in Eq. (10): 600 For the mathematical formulation of the problem, some simplifying assumptions are taking into consideration: The liquid film is assumed to be extremely thin. The air flowing across the channel is assumed a perfect gas in a boundary layer approached laminar flow. The viscous dissipation and the pressure work are negligible. The buoyancy forces, the Soret and Dufour effects are neglected III.2. Mathematical formulation Based on the previous assumption, the mass, the momentum, species diffusion as well as the energy conservation equations are simplified as follows: (ρrv) r + (ρrv) z ρu u u + ρv = dp z r ρu c c + ρv z = 0 (11) = 1 r r r + 1 dx r r (rμ u r ) (12) (rρd c r ) (13)
156 ρc p u T + ρc z pv T 1 r = 1 r r r T (rk ) div(q r r) + r (r(c pv C pa )ρdt c r ) (14) The relevent boundery conditions associated with the investigation under coinsideration can be summarized as fllows: Inlet condition: Nu r (z) = 2(R 2 R 1 ) R2 div[q r (z,r)]rdr R1 R 2 [T w T B ]k(t w ) (21) The average radiative Nusselt number is defined as: Nu rm (0 z) = 1 z Nu z 0 r(z) dz (22) Where the bulk temperature is given by Eq. (23): v(z = 0, r) = 0 { { c(z = 0, r) = C 0 (15) u(z = 0, r) = U 0 T(z = 0, r) = T 0 T B (z) = R2 R1 ρ(r,z)c p (r,z)u(r,z)t(r,z)rdr R2 ρ(r,z) C R1 p (r,z)rdr (23) Wet wall condition: { v(z, r = R D c 1) = 1 c(z, r = R 1 ) r r=r 1 u(z, r = R 1 ) = 0 M v Ma c(z, r = R 1 ) = P Pvs + M v Ma 1 k T { r + ρl v v(z, r = R 1 ) + q r (r = R 1 ) = 0 r=r 1 Dry wall condition: { v(z, r = R 2) = 0 u(z, r = R 2 ) = 0 c { r = 0 r=r 2 T(z, r = R 2 ) = T w (16) (17) The saturated vapour pressure is given by Valcon (1979) as follows: log 10 (P vs ) = log 10 (T) T T (18) These equations are added to the mass flow rate conservation equation useful to calculate the pressure gradient: R m (z) = 2π 2 2 ρu(z, r)rdr = ρ 0 U 0 π(r R 1 2 R 2 1 ) + m(0 z) (19) where the average evaporating flow rate is calculated by: z m(0 z) = 2πR 1 ρv(z, r = R 1 ) dz (20) 0 The other physical properties are considered as dependent on temperature and composition as given by Sakly et al. (2015). We define the local radiative Nusselt numbers as follows: 601 III.3. Grid and validation The finite volume method is applied to solve numerically the set of governing conservation eqations (10-14). The utilization of a sinusoidal grid helped enormously to ensure the convergence of the iterative process (Table 1). A uniform 50-nodes grid according to the radial direction and a Tchebychev s sinusoidal 300-nodes grid according to the axial direction are used (Table 2). i 1 z i = L z [cos ( π ) cos ( π )] 1 i N 2 N z 2 N z (24) z Where, r = R 2 R 1 N z This grid is chosen as a tradeoff between the computational time and the accuracy as shown in Table 3. The validation of the SNBCK implementation is done by selecting a configuration previously investigated by Liu et al. (2000). The numerical predictions of heat flux density at the wall are also compared to those given by Liu et al., where water vapor kept at 1atm and 1000K is introduced between two black plates maintained at 0K and separated by a thickness e. To be in a geometrical situation comparable to that of Liu et al. (2000), we consider the case of an annular enclosure with infinite radii. The results are very close as shown in Table 3 where the S4 quadrature, adopted as the numerical method to solve the radiative coupling problem, can be seen to have reasonable accuracy. Table 1. Effect of axial grid natural with R1=0.1 m, R2=0.15 m, z=4 m, Tw=350 K, T0=300 K, P0=1 atm, U0=1 m/s, C0=0.01, 1=2=1. Maillage Sinusoïdale Uniforme (r,z) S 0-z Without radiation Tab. 2: Effect of grid with R1=0.1 m, R2=0.15 m, z=4 m, Tw=350 K, T0=300 K, P0=1 atm, U0=1 m/s, C0=0.01, 1=2=1. Maillage (r,z) S0-z Without radiation S0-z with gas radiation i
157 Tab. 3: Validation of the radiative model Liu et al. (2000) Present work (SNBCK4 ) SNB SNBCK 4 S4 S6 S8 e= 0.1m e = 1m III.4. Entropy production Our objective is to estimate the volumetric local and the global entropy generation through non-grey gas radiation and forced convection within a cylindrical annulus. At a given location, the volumetric local entropy generation rate is given as: s(r, z) = s c (r, z) + s m (r, z) + s r (r, z) (25) Where s c (r, z)is the local entropy production due to heat conduction used by Ko (2007) as: s c (r, z) = k(t) T 2 ( T)² k(t) T ( T r )2 (26) The local entropy generation due to mass diffusion s m (r, z) can be written as: s m (r, z) = ρ2 RD C 1 1 M A M B c A c B ( x a )² (27) The total wall radiative entropy generation is obtained by: z S w (z) = 2πR 1 S w1 (z )dz + 0 2πR 2 S (z )dz (32) w2 Therefore, the global entropy production will be written as: z 0 S 0 z = 2π [ R 2 R 1 z 0 s(r, z)rdr] dz + S w (z) IV. Results and discussions (33) We select a set of graphical results (fig. 3-9) to provide the influence of thermal and geometrical parametres on entropy production profiles. In figure 3, the variations of mass fraction and temperature are given for different annular sections. Examining the mass fraction fields (fig. 3(a)) displays profiles with high gradients approximately the inner surface and stable profiles close to the outer wall. These gradients are less pronounced as well as we advance through the duct. (a) s m (r, z) = CRD x A x B ( x a )² (28) Where C is the molar concentration written as: C = ρ c k k = ρ M k k x k M k and R is the specific gas constant., D is the diffusion coefficient Applying the SNBCK4 method, the local radiative entropy production for non-grey gases is: 4 i=1 s r (z) = [w i κ ν i [I ν b I ν i (Ω )] ( 1 T 1 T ν i (Ω ) bands 4π )] dω ν (29) where T ν (Ω ) = hν (K Ln (2hν 3 c 2I ν(ω ) 1)) is the directional and spectral radiative temperature. (b) In order to estimate the spectral and directional wall entropy production of thermal radiation, we considered the folloing expression used by Lui co-workers (2007, 2009), and Mazgar et al. (2009): 4 S w1 (r, z) = w i [ I ν i (r=r 1,Ω ) bands i=1 L T ν (I i ν (r = 4π w R 1, Ω ))] μ(ω )dω ν (30) 4 S w2 (r, z) = w i [ I ν i (r=r 2,Ω ) bands i=1 L T ν (I i ν (r = 4π w R 2, Ω ))] μ(ω )dω ν (31) 602 Fig. 3: mass friction (a) and temperature (cb) profiles with R1=0.1 m, R2=0.15 m, z=4 m, Tw=350 K, T0=300 K, P0=1 atm, U0=1 m/s, C0=0.01, 1=2=1 Furthermore, we can note an increasing in the temperature of the internal cylinder. The inner wall temperature is significantly lower compared to the outer one because of the energy consumed to ensure water evaporation. In the first axial zone of the flow, we distinguish the appearance of two fluid behaviors. In fact, in vicinity of the inner wall, where the vapor migration has forced the media to contribute to radiative exchanges, the fluid temperatures are

158 greater when gas radiation is taken into consideration. Close to the dry surface, temperature profiles are confounded because of gas transparency. It can also be signaled that the minimum temperature value migrates from the central zone of the flow to be stabilized at the inner surface, a revealing sign of reaching the conductive effect. IV.1. Dry wall temperature effect Started with the effect of the dry cylinder temperature on the average relative Nusselt number, the inner wall temperature and the evaporated mass, which illustrates in fig. 4. We can note from fig. 4(a) that the greater the dry cylinder temperature is, the higher local radiative Nusselt number is. Indeed raising Tw will enhance the radiative exchanges with the vapor, which leads to an increase on wall radiative entropy generation as shown in fig.6 (a). Otherwise, it can be signaled also for a given annular section and for a constant difference in the outer wall temperature, the difference between the radiative Nusselt numbers is more important for high dry wall temperature. It can be concluded from fig.4 (b) and (c), that when the radiative transfer is neglegted, the humid wall temperature and the evaporating flow are quite small with the influence of dry wall temperature. This can be explained by the fact that the conduction phenomenon is not accentuated for these conditions. Furthermore, when the radiative transfer is taken in consideration, the temperature of the humid surface increases considerably with the dry one. As the same way as the evaporating flow rate shown in Fig 4. (c). The evolution of the volumetric local entropy generation as a function of axial position for different dry cylinder temperature illustrates in fig. 5. As seen in this figure, increasing dry wall temperature leads to increase the volumetric entropy generation. For advanced section, it is clear the presence of two behaviors in the proximity of both cylinders. Near to the wet cylinder, the local entropy production due to mass diffusion dominates which conditioned by the existence of concentration gradients as is indicated in fig. 3 (b). While, close to the dry surface we can see, the existence of an extremum tending to be reduced and migrating to the central zone. This extremum results in high temperature gradient (fig. 3(c)). Fig.6 (b) shows that the global entropy generation is considerably affected by the dry cylinder temperature. When the radiative exchanges are taken account, the entropy production is higher. Is important to note that the gap between globale entropy generation increases with the dry wall temperature. Fig. 4: Effect of hot temperature on the average radiative nusselt number, humid wall temperature and evaporating flow rate profiles; R1=0.1 m, R2=0.15 m, T0=300 K, P0=1 atm, U0=1 m/s, C0=0.01, z=4 m, 1=2=1 Fig. 5: Variation of volumetric entropy production; R1=0.1 m, R2=0.15 m, T0=300 K, P0=1 atm, U0=1 m/s, C0=0.01, z=4 m, 1=2=1 (a) (b) (c) 603
159 (a) When the radiative contribution is not taken into account, the velocity of particles near the boundaries is weaker as the width of channel is important, which makes retreading the particles near the boundaries a slow process (fig. 9(b)). This leads to a decrease in global entropy creation. With radiation, the heat transfer increase is high enough to compensate this phenomenon, increasing the total entropy production with the medium thickness. Thus, according to these figures, the use of smaller spacing between cylinders, results in a lower radiative entropy creation. When radiation is present, the profiles of total entropy production are also seen to be greater. (b) (a) Fig. 6: Variation of (a) wall radiative entropy production, (b) global entropy generation; R1=0.1 m, R2=0.15 m, T0=300 K, P0=1 atm, U0=1 m/s, C0=0.01, z=4 m, 1=2=1 IV.2. Channel thickness effect Fig.7 shows the variations of average radiative Nusselt number, wet surface temperature and evaporating flow rate, with channel thickness. The choise of low channel thickness is considered in order to avoid problems related to ray and shadowing effects. It can be noted an increase in average radiative Nusselt profiles with the channel width, which may be explained through the relative expression of Nusselt number, presented in equation (21). In fact, the radiative energy exchanged with the medium, is getting more intense when the annular space is larger. The gas surface exchanges are accentuated (fig. 7(a)). When the termal radiation is presente, it can be remarked from fig.7 (b) a slight enhancement of the inner wall temperature and a decrease in the evaporation flow rate when the channel thickness rise. In fact, as the whole domain is transparent to radiation, the channel s width has no significant influence on the evaporation flow rate also the temperature of the humid wall. The effect of the thickness of annular space on volumetric local entropy production is shown in fig.8. Numerical results shows that increasing the outer radius leads to decrease the local entropy generation. We can remark also that the extremums located near to the humid wall are dominated. In fact, the entropy production due to mass diffusion is accentuated in this zone. Fig. 7: Effect of duct width on the average radiative nusselt number, humid wall temperature and evaporating flow rate profiles; R1=0.1 m, Tw=300 K, T0=300 K, P0=1 atm, U0=1 m/s, C0=0.01, z=4 m, 1=2=1 (b) (c) Fig. 9(a) illustrates the profiles of the wall radiative entropy production. According this graph, the use of smaller spacing between cylinders, results in a significantly lower wall radiative entropy creation. 604
160 Nomenclature Fig. 8: Variation of volumetric entropy production; R1=0.1 m, Tw=300 K, T0=300 K, P0=1 atm, U0=1 m/s, C0=0.01, z=4 m, 1=2=1 (a) C : mass fraction of water vapor Cp : specific heat (J.kg -1.K -1 ) Cpa : specific heat for air (J.kg -1.K -1 ) Cpv : specific heat for water vapor (J.kg -1.K -1 ) D : diffusion coefficient (m²s -1 ) e : channel width (R2- R1) (m) I : radiation intensity (W.m -2.sr -1 ) k : thermal conductivity (W.m -1.K -1 ) K : Boltzmann s constant (K= JK -1 ) Lv : latent heat of evaporation (J.kg -1 ) m : evaporating flow rate (g/s) Ma : molar mass of air (kg.mol -1 ) Mv : molar mass of water vapor (kg.mol -1 ) P : pressure (Pa) q : heat flux (W.m -2 ) R : gas constant (J.mol -1.K -1 ) R1 : internal radius (m) R2 : external radius (m) sv : local entropy generation (W.K -1.m -3 ) S : global entropy production (W. K - 1.m -1 ) T : temperature (K) u : axial velocity (m.s -1 ) v : radial velocity (m.s -1 ) w : weight parameter x : mass fraction r,z : cylindrical coordinates Greek letters Fig. 9: Variation of (a) wall, (b) global entropy generation with the duct width; R1=0.1 m, Tw=300 K, T0=300 K, P0=1 atm, U0=1 m/s, C0=0.01, z=4 m, 1=2=1 V. Conclusions (b) A numerical analysis has been carried out to investigate the entropy production related to heat and mass transfer for a combined laminar forced flow and radiation in humid air confined between two cylindres one being adiabatic and humid and the other one being isothermal and dry. The major results are briefly summarized as following: The radiative contribution enhances heat and mass transfer and permets to accelerate the evaporation flow rate. The creation of volumetric and globale entropy is definitely higher for important dry wall temperature Increasing the dry temperature cylinder enhances the wall radiative entropy production as well as the glopal entropy production. Diminishing the channel thickness leads to decrease in the volumetric entropy generation as well as the global entropy production ν : wave number (cm -1 ) ε : emissivity κ : absorption coefficient (m- 1 ) 1 Δν : spectral resolution ( 100cm ) dω : elementary solid angle μ : dynamic viscosity (N.s.m -2 ) ρ : density of the fluid (Kg.m -3 ),, : director cosines Subscripts c : conductif m : mass diffusion r : radiative exchange 0 : ambient ν : spectral w : wall Superscripts b i References : black body : grey gas associated Arpaci V.S., Radiative entropy production. AIAA J, 24, (1986). Arpaci V.S., Radiative entropy production-heat lost to entropy. Adv Heat Transfer, 21, (1991). 605
161 Arpaci V.S., Selamet A. Entropy production in boundary layers. J Thermophys Heat Transfer, 4, (1990). Arpaci V.S., Selamet A. Entropy production in flames. Combust Flame, 73, (1988). Arpaci V.S., Selamet A., Radiative entropy production, 8 th international heat transfer conference, 2, (1986). Aubert A., Candelier F., Solliec C., Exprerimental study of heat transfert in a water film exposed to radiant flux. Application to thermal protection of composit walls, Experiental Thermal and Fuild Sciences, 51, (2013). Aubert A., Solliec C., Etude d un film d eau ruisselant appliqué à la protection thermique d une paroi, 19ème Congrès Français de Mécanique (2009). Bejan A., A study of entropy generation in fundamental convective heat transfer, Journal of Heat Transfer, 101, (1979) Bejan A., The thermodynamic design of heat and mass transfer processes and devices, International Journal of Heat and fluid flow, 8, (1987). Ben Nejma F., Slimi K., Effect of gas radiation and laminar forced convection on evaporation, Computational Thermal sciences, 3, (2011). Ben Nejma F., Mazgar A., Charrada K., Application of the statistical narrow-band correlated-k model to entropy generation through non-grey gas radiation inside a spherical enclosure, Exergy, 8, (2011). Ben Nejma F., Mazgar A., Abdallah N., Charrada K., Entropy generation through combined non-grey gas radiation and forced convection between two parallel plates, Energy, 33, (2008). external flows, International Journal of Heat and Fluid Flow, 13, 65-70, (1992). Chiu H.C., Yan W.M., Mixed convection heat transfer in inclined rectangular ducts with radiation effects, International Journal of Heat and Mass Transfer, 51, (2008). Chu S.X., Liu L.H., Entropy generation analysis of two-dimentional high-temperature confined jet, International Journal of Thermal Sciences, 48, (2009). Chun K. R., Seban R. A., Heat transfer to evaporating liquid film, International Journal of Heat Transfer, 93, (1971). Elazhary A. M., Soliman H. M., Entropy generation during fully-devepoped forced convection in parallel-plate micro-channels at high zeta-potentials, International Journal of Heat and Mass Transfer, 70, (2014). Haddad O.M., Alkam M.K., Khasawneh M.T., Entropy generation due to laminar forced convection in the entrance region of a concentric annulus, Energy, 29, (2004). Ko T.H., A numerical study on developing laminar forced convection and entropy generation in half- and double-sine ducts, International Journal of Thermal Sciences, 46, (2007) Lacis A.A., Oinas V., A description of the correlated k distribution method for modelling nongray gaseous absorption, thermal emission, and multiple scattering in vertically inhomogeneous atmospheres, J. Geophys. Res., 96, (1991). Lin T. F., Chang C. J. and Yan W. M., Analysis of combined buoyancy effects of thermal and mass transfer in a vertical tube, Journal of Heat Transfer, 110, (1988). Ben Nejma F., Mazgar A., Charrada K., Volumetric and wall nongrey gas entropy creation in a cylindrical enclosure, WSEAS Transactions on Heat and Mass Transfer, 5, (2010). Caldas M, Semiao V. The effect of turbulence radiation interaction on radiative entropy generation and heat transfer, JQSRT, 104, (2007). Caldas M, Semiao V., Entropy generation through radiative transfer in participating media: analysis and numerical computation, JQSRT, 96, 23-37(2005) Carrington C. G., Sun Z. F., Second law analysis of combined heat and mass transfer phenomena, International Journal Heat Mass Transfer, 34, (1991). Carrington C. G., Sun Z. F., Second law analysis of combined heat and mass transfer in internal and 606 Liu F., Smallwood G.J., Gulder Ö.L., Application of the statistical narrow-band correlated method to low-resolution spectral intensity and radiative heat transfer calculations-effects of the quadrature scheme, Int. J. Heat and Mass Transfer, 43, (2000). Liu L.H., Chu S.X., Verification of numerical simulation method for entropy generation of radiative heat transfer in semitransparent medium, JQSRT, 103, (2007) Mahmud S., Fraser R.A., Analysis of entropy generation inside concentric cylindrical annuli with relative rotation, International Journal of Thermal Sciences, 42, (2003). Mahmud S., Fraser R.A., Second law analysis of heat transfer and fluid flow inside a cylindrical annular space, Exergy, (2002).
162 Malkmus W., Random Lorentz band model with exponential-tailed S-1 line-intensity distribution function, J. Opt. Soc. Am. 57, (1967). Mazgar A., Ben Nejma F., Charrada K., Entropy generation through combined non-grey gas radiation and natural convection in vertical pipe, Progress in Computational Fluid Dynamics, 9, (2009). Mazgar A., Ben Nejma F., Charrada K., Second law analysis of coupled mixed convection and non-grey gas radiation within a cylindrical annulus, International Journal of Mathematical Models and Methods in Applied Sciences, 7, (2013). Sakly A., Mazgar A., Ben Nejma F., Thermal radiation contribution on humidification process in a cylindrical annular duct, High Temperatures high Pressures, 44, (2015). San J. Y., Worek W. M. and Lavan Z., (1987a), Entropy generation in combined heat and mass transfer, International Journal of Heat and Mass Transfer, Vol. 30, No. 7, pp Seban R. A., Faghri A., Evaporation and heating with turbulent falling liquid films, International Journal of Heat Transfer, 98, (1976). Shojaeian M., Koşar A., Convective heat transfer and entropy generation analysis on Newtonian and non-newtonian fluid flows between parallel-plates under slip boundary conditions, International Journal of Heat and Mass Transfer, 70, (2014). Tasnim S. H., Mahmud S., Entropy generation in a vertical concentric channel with temperature dependent viscosity, International Communications Heat and Mass Transfer, Vol. 29, No. 7, pp (2002). Tsay Y. L., Lin T. F., Yan W. M., Cooling of a falling liquid film trough interfacial heat and mass transfer, International Journal of Multiphase Flow, 16, (1990). Valcon M., Etude de l évaporation en convection naturelle, P.H.D. thesis, Poitiers university-france (1979). Wright S.E., Scott D.S., Haddow J.B., Rosen M.A., On the entropy of radiative heat transfer in engineering thermodynamics. Int J Eng Sci, 39, (2001). Yan W. M., Effects of film evaporation on laminar mixed convection heat and mas transfer in a vertical channel, International Journal of Heat and Mass Transfer, 35, (1992). Yilbas B. S., Entropy analysis of concentric annuli with rotating outer cylinder, International Journal of Exergy, 1, (2001). 607
163 A Numerical Study on Phase Change inside a Spherical Capsule Ersin Alptekin, Muhammet Ozer, Murat Top, Nuriye Bozkurt, Muruvvet Zenginoglu, Fazil Erinc Yavuz, Mehmet Akif Ezan * Dokuz Eylul University, Department of Mechanical Engineering, Izmir, Turkey * [email protected] Abstract In this study, the transient thermal behavior of a phase change material inside a spherical capsule has been investigated under various working conditions. A two-dimensional axisymmetric model is considered in ANSYS-FLUENT software. An enhanced thermal conductivity definition is used to incorporate the effect of natural convection in the mathematical model. The validation of the code is proven by comparing the prediction with the results that are obtained from the literature. As a result, it is found that increasing the free stream temperature and convective heat transfer coefficient improves the heat transfer inside the sphere and decreases the time for complete melting. The required time for complete melting reduces almost by one-half for T m + 30 C and T m + 20 C when the enhanced thermal conductivity is implemented. It is clear that neglecting the effects of convection causes significant underestimations regarding the liquid fraction even for the lower free-stream temperature values, i.e. T m + 10 C. On the other hand, enhanced thermal conductivity definition becomes effective when the liquid fraction reaches to 0.4. The slope of the liquid fraction improves as defining the improved thermal conductivity. As a conclusion, the implementation of the enhanced thermal conductivity reduces the complete time of melting almost by one-fourth. Keywords: Spherical Capsule, Paraffin, ANSYS-FLUENT, Enhanced thermal conductivity I. Introduction The intensity of the solar radiation varies throughout the day-time, and it is unavailable during the night-time. Transient nature of the renewable energy resources, such as wind and sun, makes it impossible to build up a continuous power generation system without an additional storage unit. Thermal energy storage (TES) systems could be integrated to the systems, such as solar heating, cooling or power generation, to store (charge) the excessive energy while the energy input is available, and then release (discharge) the stored energy when the energy resource is not accessible. Implementation of the TES units into the solar systems maintains continuous heat supply, so that the problem that may arise from the intermittent nature renewable energy resources could be solved. However, as stated by Pintaldi et al. (2015), thermochemical energy storage materials are currently under research and development phase. Among the others, the sensible heat and latent heat TES applications are widely used and relatively mature technologies. TES simply stands for storing (or releasing) the thermal energy into (or from) a medium. As it is well-known fact from the thermodynamics, the energy storage in a medium is directly related to the internal energy variation of the material. Internal energy consist of sensible, latent, chemical and nuclear forms of energy (Cengel & Boles, 2015). Figure 1 compares the required volume of materials to store 10 MJ of thermal energy within a sensible heat, latent heat, thermochemical sorption, thermochemical reaction TES units (Pintaldi et al., 2015). It is clear that the highest amount of storage medium is used in the case of sensible heat TES. The most attractive TES method, on the other hand, regarding the involved space, is the thermochemical reaction. 608 Figure 1. Comparison of different TES methods regarding the required volume (Reproduced from Pintaldi et al. (2015)) From Figure 1, it is clear that, in a latent heat TES (LHTES) system, a higher amount of thermal energy could be stored in a small-medium in comparison with the sensible heat TES. The underlying reason is that the energy storage in an LHTES is provided by the phase change of the storage medium. The storage materials that are used in the LHTES system are known as phase-change material (PCM) since they change its phase in the process. Liquid-gas
164 phase change is not a practical application since it requires a reinforced storage tanks which can resist high-pressure variations. Instead, solid to liquid phase change is widen to store or release thermal energy in a medium with a small volume change. There are two main challenges in the field of LHTES systems. The first one is on the designing a suitable heat exchanger that can provide a higher heat transfer rate between the heat transfer fluid (HTF) and the PCM. The second one is on developing a proper PCM, which has enhanced thermal properties, to reduce the required cycle durations for charging or discharging. Numerous studies have been conducted in the literature related to the design of heat exchangers, investigating the influence of working conditions of HTF and developing/characterization of PCMs. For the last ten years, Erek and his colleagues have been working on LHTES systems and development/characterization of PCM candidates. In his early work, in 2005, Erek et al. (2005), developed a numerical model to predict the solidification process of water around bare and finned tubes. They have validated their code with the results of experimental findings. The further parametric study has been carried out to discover the effect of working parameters and the spacing between fins on the phase change process. Erek & Ezan (2007) considered a real-size LHTES system in which water is used as PCM. They have developed a numerical code in FORTRAN language and validated their predictions regarding the experimental measurements. Erek & Dincer (2008) and Erek & Dincer (2009) proposed a new numerical approach for entropy and exergy based analyses for LHTES systems. Ezan et al. (2010), on the other hand, represented the experimental findings of a shell-and-tube type LHTES system, regarding the energetic and exergetic aspects. Ekren et al. (2011) built up an experimental unit which includes a water tank and a chiller as a real-size LHTES system. They have investigated the effect of control schemes on the thermal stability and the performance (COP) of the unit. Ezan & Erek (2012) experimentally studied solidification and melting periods in a real-size LHTES system. Internal and external melting scenarios have been compared under various heating load conditions. Ezan et al. (2011a) developed a numerical code to simulate the transient heat transfer including phase change in a real-size LHTES system. They have validated the code by comparing the predictions against their experiments. Further numerical analyses have been conducted to reveal the energetic and exergetic aspects of the LHTES system. Ezan et al. (2011b) proposed a numerical scheme in ANSYS-FLUENT software to predict the natural convection driven phase change inside a rectangular cavity. They have concluded that the effect of natural convection becomes dominant in the early stages of the process. Ezan et al. (2013) extended their previous model and applied in cylindrical geometry. They have simulated the natural 609 convection driven solidification of water around a tube. The predicted results are compared against the experimental measurements. The time-wise variations of the interface position, local and average Nusselt numbers are represented for various boundary conditions. Recently, researchers also focus on the enhancement of the thermal properties of PCMs. Seki et al. (2015a) developed a new eutectic PCM, which consists of Adipic Acid and Sebacic Acid. The melting temperature of the proposed PCM is 116 C. The thermal conductivity of the eutectic mixture is improved by loading graphene nanoplatelets (GNP). Seki et al. (2015b) and İnce et al. (2015), on the other hand, prepared nano-enhanced PCMs using Arachidic Acid (AA) and Myristic Acid (MA), respectively. Results reveal that the thermal conductivity of AA is increased by 45% by incorporating 2% of GNP. The thermal conductivity of MA is improved by 38% with loading 2% of GNP. PCMs are placed into reservoirs which have Cartesian, cylindrical or spherical geometries. Bedecarrats et al. (1996) claim that the spherical capsulation has the best performance among the other geometries since it is easy to use and has a greater effective surface area between the PCM and the HTF. Bédécarrats et al. (2009) experimentally investigated the performance of an encapsulated energy storage unit during the solidification and melting periods, under varying working conditions. Tan et al. (2009) developed a numerical model in ANSYS-FLUENT software to simulate the natural convection driven phase change. The formation of the conduction and convection dominated zones are discussed and the predicted temperature variations are compared with the experimental findings. Although solving the coupled governing equations, continuity, momentum, and energy, give a better understanding and more realistic outcomes, it is very time-consuming procedure. Ismail et al. (2003) developed a numerical code in which they have included the effect of natural convection as an enhanced thermal conductivity. It is proven that, with the definition of effective thermal conductivity, the total computational time reduces significantly without losing the accuracy, regarding the total time for complete solidification. Veerappan et al. (2009) developed a one-dimensional numerical model to simulate phase change inside a spherical capsule. They showed that the definition of enhanced thermal conductivity increases the accuracy of the model, and the predictions become closer to the experimental ones. Recently, Ezan et al. (2014) developed a correlation for the enhanced thermal conductivity of water inside a spherical capsule regarding the temperature difference and the interface position. They have implemented the relationship into a one-dimensional numerical model and compared the simulation results with the experimental measurements. It is found that the accuracy of the one-dimensional model is improved with using enhanced thermal conductivity. This paper primarily aims to implement the enhanced


 to determine the melting temperature and the heat of fusion (latent heat) of the material Perkin")

165 thermal conductivity definition into the commercial CFD solver ANSYS-FLUENT. Moreover, a numerical survey is conducted to discuss the influence of free stream temperature and convective heat transfer coefficient value on the time-wise variation of melting inside a spherical capsule with and without considering the enhanced thermal conductivity definition. For this purpose, a two-dimensional model is considered, and the numerical approach is validated by comparing the predictions against the results from the literature. II. Material & Method II.1. Characterization of the PCM In the numerical analyses, a commercial paraffin wax is considered as PCM. Thermal characterization analysis of the PCM is conducted with Differential Scanning Calorimeter (DSC) to determine the melting temperature and the heat of fusion (latent heat) of the material Perkin Elmer Diamond DSC is used with Pyris 7.0 software. 6 mg of paraffin sample is encapsulated in an aluminum pan and placed in the furnace. Experiments are conducted in a nitrogen atmosphere. The sample is heated from 0 C to 100 C with a heating rate of 10 C/min and held at 100 C for 1 minutes. The sample is then cooled down to 0 C with a cooling rate of 10 C/min. The results for heating and cooling cycles are given in Figure 2(a) and (b), respectively. the impurities in the commercial material. The latter one, on the other hand, corresponds the melting range of the material. The area underneath the peak is calculated to evaluate the heat of fusion. Similarly, two exothermic peaks occur during the solidification process. The solidification range is obtained to be C C. The heat of fusion values for the melting and solidification processes are evaluated as kj/kg and kj/kg, respectively. The remaining properties of the material, which are necessary for the numerical model, are obtained from the literature and given in Table 1. Table1. Thermophysical Properties of Paraffin Property Value ρ (kg/m 3 ) 772 k (W/mK) c (J/kgK) 2160 h sf (J/kg) kj/kg II.2. Definition of the Problem In the current problem, solar thermal energy storage inside a spherical container is considered. During the daytime, the heat transfer fluid passes around the spheres at a temperature which is higher than the melting temperature of the PCM, thus inward melting process takes place. During the nighttime, on the other hand, relatively cold HTF, at a temperature lower than the phase change temperature, passes around the spheres and causes inward solidification. The schematic of the system is given in Figure 3. The working and design parameters of the process should be specified in such a way that the charge and discharge durations met the requirements. (a) Heating cycle (b) Cooling cycle Figure 2. Thermograms for paraffin sample Two endothermic peaks are observed during the melting process, between 24.8 C C, and between C C. The former one is relatively small and probably observed because of 610 Figure 3. Schematic of a solar thermal energy storage unit Only a single spherical capsule is considered to understand the transient heat transfer phenomena inside the latent heat thermal energy storage unit. The problem is reduced into an axisymmetric two-dimensional geometry, as given in Figure 4. On the outer wall, convective heat transfer boundary condition is defined. The mathematical expressions of the boundary conditions are as below, T r = 0 k 0 (1) r r 0 T r = ro k ht T (2) r rr o In the current model, the inner radius of the sphere is

 of the PCM (Table 1). The enthalpy-porosity method of Voller & Swaminathan (1991), is used to incorporate phase change effect in the energy equation.")
166 0.03 m with a wall thickness of 2 mm. The wall material is defined as Pyrex glass. Figure 4. Two-dimensional mathematical model II.3. Solution Method It is assumed that the natural convection inside the sphere is neglected. The effect of natural convection is implemented into the model using the enhanced thermal conductivity. ANSYS-FLUENT software solves the following energy equation for a spherical domain, 1 2 T 1 T ct kr k sin 2 2 t r r r r sin (3) The thermo-physical properties of the PCM are defined to be identical in each phase (solid and liquid) of the PCM (Table 1). The enthalpy-porosity method of Voller & Swaminathan (1991), is used to incorporate phase change effect in the energy equation. The two-dimensional and axisymmetric computational domain is divided into quadrilateral cells. After a preliminary survey on the time-step size sensitivity analysis, the optimum time step is obtained to be 1 s. The convergence criterion is defined as 1E-8. Neglecting the natural convection inside the sphere may cause unrealistic results. Enhanced thermal conductivity approach is an easy way to include the effect of natural convection in a conduction based analysis. Two different approaches are followed in this study: (i) conduction based studies and (ii) enhanced thermal conductivity studies. In the conduction based studies, the thermal conductivity is assumed to be constant during the process. In the enhanced thermal conductivity approach, the thermal conductivity is defined as k eff r Ra r Pr (4) kl ro where k l is the thermal conductivity of the liquid phase without convection and k eff is the enhanced (effective) thermal conductivity. Rayleigh number (Ra) is defined regarding the liquid spacing (Δr) and the temperature difference between the interface and 611 the inner wall as 3 Tr Ra r g (5) v The liquid spacing (Δr) is the difference between the inner radius and the equavelent interface position (r eq). Three subroutines are coded in C++ language and interpreted into the ANSYS-FLUENT software to calculate the enhanced thermal conductivity. At the end of each time step, the volume averaged liquid fraction is computed to obtain the spacing that is filled with the liquid PCM (Δr). An additional function calculates the area weighted average of the inner wall temperature. Two subroutines share the related information to the property function in which the enhanced thermal conductivity is evaluated according to the Eq. (4). Since the Rayleigh number varies over the time the thermal conductivity of the liquid phase can vary with time. II.4. Validation of the Model The work of Bilir & İlken (2005) is reproduced to validate the numerical solution method. In that model, a spherical capsule with a diameter of 0.06 m is filled with water which is initially at 25 C. The capsule is then dropped into a cold liquid bath, and an inward solidification is observed. It is assumed that the liquid temperature and the convective heat transfer coefficient between the liquid and the outer wall of the sphere are both constant. The liquid temperature is at -10 C and convective heat transfer coefficient is W/m 2 K. The properties of water are defined according to the data that is given in Bilir (2003). In Figure 5, current predictions are compared with the results that is given in Bilir & İlken (2005). The solid red curve represents the results of the reference work, and the dashed line is the current predictions. The current results match with the reference work. In the reference work, there are some temperature fluctuations at the initial period, which may arise because of the mesh size, and disappear in proceeding time. In the case of the current model, almost smooth temperature variation is obtained. Figure 5. Comparison of the current results with the reference work
167 III. Results & Discussion A total of twelve parametric analyses has been conducted to discuss the influence of free stream temperature, convective heat transfer coefficient and the definition of enhanced thermal conductivity of the PCM on the transient heat transfer inside the spherical capsule. III.1. Effect of Free-Stream Temperature Figure 6 shows the influence of free stream temperature on the time-wise variations of the surface temperature and the liquid fraction inside the PCM domain. In the current analyses the convective heat transfer coefficient is defined as 100 W/m 2 K. h = 100 W/m 2 K that increasing the free stream temperature improves the heat transfer and reduces the time for complete melting, as it is expected. Figure 6(a) shows that the wall temperature of the sphere has a decreasing tendency for the conduction dominated analyzes. In contrast, it is clear that the definition of k eff enhances the heat transfer and the curves have positive slopes. The enhanced thermal conductivity is directly proportional to the temperature difference between the wall and the interface. That is, the slope of the curves increases as increasing the temperature difference. It is interesting to note that the difference between the constant and enhanced conductivity definitions becomes clear when the temperature difference between the free stream and melting temperatures is increased. It is evident that for higher free stream temperatures the error that may arise by neglecting the convection effects inside the sphere become significant. In Figure 6(b), on the other hand, the time-wise variation of the liquid fraction values are given. The required time for complete melting reduces almost by one-half for T m + 30 C and T m + 20 C when the enhanced thermal conductivity is implemented. It is clear that neglecting the convection effects causes significant underestimations regarding the liquid fraction even for the T m + 10 C. III.2. Effect of Heat Transfer Coefficient (a) Surface temperature h = 100 W/m 2 K Figure 7 represents the effect of convective heat transfer coefficient on the surface temperature of the sphere and the liquid fraction of the PCM. Increasing the heat transfer coefficient reduces the thermal resistance between the outer wall and the free stream, so that the heat transfer enhances. Figure 7(a) shows the variations of surface temperature for constant and enhanced thermal conduction definitions. Raising the convection from h = 10 W/m 2 K to 50 W/m 2 K, by five times, the surface temperature increases from 55 C to 66 C at 50 min. However, at relatively higher values, i.e. 100 W/m 2 K, the change in convective heat transfer coefficient slightly affects the surface temperature. At lower convection coefficients, the slope of the curves become smaller. Definition of enhanced thermal conductivity enhances the heat transfer and it increases the slope of the curves significantly. At the early periods of the process the definition of enhanced thermal coefficient reduces the surface temperature. In advancing time the wall temperature increases rapidly and reaches the free stream temperature in a short period. (c) Liquid fraction Figure 6. Effect of free-stream temperature on the phase change inside the sphere In the Figures the solid curves represent the conduction mode and the dashed ones correspond the analyses in which effective (enhanced) thermal conductivity approach is implemented. One can infer 612 Figure 7(b) represents the time-wise variation of the liquid fraction values. The required time for complete melting reduces significantly when the convection coefficient is increased from h = 10 W/m 2 K to 50 W/m 2 K. Beyond this values, increment does not cause any significant change regarding the liquid fraction. As an instance, at t = 100 min, the liquid fraction values are 0.45, 0.83, 0.87 and 0.90 for h = 10, 50, 100 and 400 W/m 2 K, respectively. On the

168 other hand, enhanced thermal conductivity definition becomes effective when the liquid fraction reaches to 0.4. The slope of the liquid fraction is improved by defining improved thermal conductivity. The implementation of the enhanced thermal conductivity is reduced the complete time of melting almost by one-fourth. convective heat transfer coefficient improves the heat transfer inside the sphere and decreases the time required for complete melting. The effective thermal conductivity definition significantly affects the phase change process and enhances the rate of heat transfer. References Bédécarrats, J. P., Castaing-Lasvignottes, J., Strub, F., & Dumas, J. P. (2009). Study of a phase change energy storage using spherical capsules. Part I: Experimental results. Energy Conversion and Management, 50(10), Bedecarrats, J. P., Strub, F., Falcon, B., & Dumas, J. P. (1996). Phase-change thermal energy storage using spherical capsules: performance of a test plant.international Journal of Refrigeration, 19(3), (a) Surface temperature Bilir L., (2003) Estimation of the total solidification time of a liquid phase change material enclosed in cylindrical and spherical containers, Thesis (Master), İzmir Institute of Technology, Mechanical Engineering, İzmir. (b) Liquid fraction Figure 7. Effect of convective heat transfer coefficient on the phase change inside the sphere IV. Conclusions Current work is focused on investigating the effect of enhanced thermal conductivity on the melting process of PCM inside a spherical capsule. Two-dimensional axisymmetric mathematical model is developed in ANSYS-FLUENT software and enhanced thermal conductivity is incorporated into the software by user-defined-functions. The main outcomes of the current work can be listed as below: Increasing the free stream temperature and 613 Bilir, L., & Ilken, Z. (2005). Total solidification time of a liquid phase change material enclosed in cylindrical/spherical containers. Applied thermal engineering, 25(10), Çengel, Y. A., & Boles, M. A. (2015). Thermodynamics: an engineering approach. M. Kanoğlu (Ed.). McGraw-Hill Education. Ekren, O., Ezan, M. A., & Erek, A. (2011). Experimental assessment of energy storage via variable speed compressor. International journal of refrigeration,34(6), Erek, A., & Dincer, I. (2008). An approach to entropy analysis of a latent heat storage module. International Journal of Thermal Sciences, 47(8), Erek, A., & Dincer, I. (2009). A new approach to energy and exergy analyses of latent heat storage unit. Heat Transfer Engineering, 30(6), Erek, A., & Ezan, M. A. (2007). Experimental and numerical study on charging processes of an ice on coil thermal energy storage system. International journal of energy research, 31(2), Erek, A., Ilken, Z., & Acar, M. A. (2005). Experimental and numerical investigation of thermal energy storage with a finned tube. International journal of energy research, 29(4), Ezan, M. A., & Erek, A. (2012). Solidification and Melting Periods of an Ice-on-Coil Latent Heat
169 Thermal Energy Storage System. Journal of Heat Transfer, 134 (6), Ezan, M. A., Erek, A., & Dincer, I. (2011a). Energy and exergy analyses of an ice-on-coil thermal energy storage system. Energy, 36(11), Ezan, M. A., Erek, A., & Dincer, I. (2011b). A Study on the Importance of Natural Convection During Solidification in Rectangular Geometry. Journal of Heat Transfer, 133(10), (2009). Phase change characteristic study of spherical PCMs in solar energy storage. Solar Energy,83(8), Voller, V. R., & Swaminathan, C. R. (1991). ERAL Source-based method for solidification phase change. Numerical Heat Transfer, Part B Fundamentals, 19(2), Ezan, M. A., Erek, A., & Dincer, I. (2013). Numerical study on solidification process inside annulus in presence of natural convection. International Journal of Exergy, 12(4), Ezan, M. A., Ozdogan, M., Gunerhan, H., Erek, A., & Hepbasli, A. (2010). Energetic and exergetic analysis and assessment of a thermal energy storage (TES) unit for building applications. Energy and Buildings, 42(10), Ezan, M. A., Uzun, M., & Erek, A. (2014). A study on evaluation of effective thermal conductivity for spherical capsules. International Conference on Heat Transfer, Fluid Mechanics and Thermodynamics. Ismail, K.A.R., Henríquez, J.R., and da Silva, T.M., A parametric study on ice formation inside a spherical capsule, International Journal of Thermal Sciences, Vol. 42, 2003, İnce, Ş., Seki, Y., Ezan, M. A., Turgut, A., & Erek, A. (2015). Thermal properties of myristic acid/graphite nanoplates composite phase change materials. Renewable Energy, 75, Pintaldi, S., Perfumo, C., Sethuvenkatraman, S., White, S., & Rosengarten, G. (2015). A review of thermal energy storage technologies and control approaches for solar cooling. Renewable and Sustainable Energy Reviews, 41, Seki, Y., İnce, Ş., Ezan, M. A., Turgut, A., & Erek, A. (2015a). Graphite nanoplates loading into eutectic mixture of Adipic acid and Sebacic acid as phase change material. Solar Energy Materials and Solar Cells, 140, Seki, Y., Ince, S., Ezan, M. A., Turgut, A., & Erek, A. (2015b). Development and evaluation of graphite nanoplate (GNP) based phase change material for energy storage applications. International Journal of Energy Research, 39(5), Tan, F. L., Hosseinizadeh, S. F., Khodadadi, J. M., & Fan, L. (2009). Experimental and computational study of constrained melting of phase change materials (PCM) inside a spherical capsule. International Journal of Heat and Mass Transfer, 52(15), Veerappan, M., Kalaiselvam, S., Iniyan, S., & Goic, R. 614
170 Phase Change Materials in Textile Fabrics: A Numerical Survey Mehmet Akif Ezan *, Berkant Murat Gul, Hüseyin Kurt, Atif Canberk Ezan, Ersin Alptekin Dokuz Eylul University, Department of Mechanical Engineering, Izmir, Turkey * [email protected] Abstract Phase change materials (PCMs) are widely used in heating and cooling applications to reduce the mismatch between the energy production and consumption. PCMs can also be incorporated into the thermal system to maintain temperature stability and increase the thermal comfort. Unlike any man-made thermal system, the thermal comfort of the human body is more crucial since a possible damage may not be recovered. In this study, PCM layers are incorporated into the textile fabric to increase the thermal comfort of a firefighter. A transient onedimensional numerical model is developed in the ANSYS-FLUENT package. The effect of blood perfusion in skin layers are simulated as a source term and defined as user-defined-function (UDF) into the software. In the preliminary model, the time-wise variation of the temperature of the body layers are compared with the results which are taken from the literature. After the validating the model, the usage of PCM inside a firefighter cloth is numerically investigated by varying the thermal boundary conditions acting on the coating. Results depict that, for the longest fire exposure duration while the 1 st -degree burn is effective for a depth of 5.29 mm, the 3 rd -degree burn is observed for a depth of 2.57 mm. Implementing PCM into the clothing blocks the temperature rise in skin layers and improves the heat storage capacity of the fabric. Results reveal that 1 mm PCM thickness prevents the skin burn, even for the longest fire exposure scenario. Keywords: Textile, phase change materials, numerical model, thermal protection, thermal burn I. Introduction ASHRAE defines the human thermal comfort as the state of mind that expresses satisfaction with the surrounding conditions (ASHRAE, 2013). Thermal comfort of the human body is related to the heat and mass transfer mechanisms between the skin and the environment. The heat can be moved through (or to) the surroundings by heat conduction, convection, radiation and also evaporation. The thermal comfort could be maintained when the generated heat by the human metabolism is rejected through the surroundings. If there is a heat gain or loss beyond this thermal equilibrium, the person will feel discomfort. The internal temperature of the body is almost constant even though the surrounding temperature varies significantly. Body temperature is controlled by blood flow inside the skin or the evaporating mechanism. Heat-related illnesses (hypothermia or hyperthermia) may arise when the body temperature exposed extremely hot or cold environments. Excessive heat or contact with chemical substances may cause thermal burns (or injuries) that result in the destruction of the human tissues on the outer layer of the skin. The threshold temperature for the thermal burn is 317 K (Hu et al., 2013). At relatively low temperatures, such as 317 K, the thermal injury may occur for a long-term exposure (5 to 6 hours), but at higher temperatures, i.e. 327 K, destruction begins within seconds. In a recent work of the fire protection research foundation (NFPA, 2008), it is stated that a significant number of thermal injuries occur when the energy stored within the protective clothing of firefighter and suddenly transferred to the firefighter and cause thermal burns. Storing the excessive heat 615 inside the protective clothing and then release the stored heat without causing any damage to the firefighter is crucial to prevent the heat injury. Energy can be stored in a medium in two different ways: sensible and latent heat storage. Sensible heat storage is proportional to the heat capacity of the material and the temperature variation. In the case of protective clothing, to avoid the thermal injury, sensible storage is not a good option. Instead, excessive heat should be stored in the medium without causing a temperature increment. Phase change materials (PCMs), on the other hand, can store the extreme heat without causing a temperature increase in a long term usage. PCMs store the thermal energy during the solid to liquid phase change (melting) and release the thermal energy during the reverse phase change (solidification). The amount of stored energy depends on the phase change enthalpy of the (latent heat) of the material. The materials that are proposed as PCMs have higher latent heat and constant phase temperature (melting or solidification) without sub-cooling effect. PCMs are commonly used in heating (Kenisarin & Mahkamov, 2007) and cooling applications (Ezan & Erek, 2012) as a storage medium to reduce mismatch the energy supply and demand. As an instance, in a solar power plant, to provide a continuous (24 h) electricity generation, heat can be stored in a PCM tank during the day time, in the form of latent heat, and the stored thermal energy can be re-used at night hours. Recently, PCMs are also utilized as a thermal buffer to keep a system temperature within a pre-defined range. In buildings (Tyagi et al., 2016) or electronic devices (Alshaer et al., 2015), PCM layers are used to absorb the
171 excessive heat so that the sudden variations are avoided. As a thermal buffer, PCMs are also incorporated in textile fabrics. PCM can be applied to textile material as layers or inside microcapsules to provide thermal regulation (Sarier & Onder, 2012). Mondal (2008) states that the microencapsulated PCM technology in the textile structure was firstly used by NASA researchers in the early 1980s to provide an improved thermal protection in the fabrics of astronauts against sudden temperature changes in outer space. Shin et al. (2005) developed a thermos-regulating textile material by incorporating microencapsulated eicosane. Eicosane is covered by melamine - formaldehyde microcapsules which are prepared by in situ polymerization. The energy storage capacity is obtained in the range of 0.91 to 4.44 J/g depending on the concentration of the PCM. However, it is also indicated that only 40% of the storage capacity of the treated fabric can be retained after five launderings. Tong & Tong (2015) developed a novel textile fabric for outdoor wear in cold weather absorbs solar energy during the daytime. It is proposed that the developed material can be used in life-saving military uniforms and performance sportswear. Li & Zhu (2004) numerically investigated the heat and moisture transfer in a porous textile fabric. PCM is embedded inside the textile material to improve the energy storage capability. Numerical predictions are compared with the experimental measurements to validate the developed scheme. Shaid et al. (2015) developed a firefighter garment which can provide improved thermal protection to prevent heat loss. They claimed that as a standard approach aerogel is used in high heat protection. Aerogel not only blocks the incoming heat flux through the body but also restricts the heat loss from the body surface. Consequently, the wearer suffers from an increase in body temperature (Shaid et al., 2015). The embedded PCM layer improves the thermal protection and comfort. Hu et al. (2013) incorporated PCM in a firefighter protective clothing. The influence of PCM position in the fabric is revealed under constant heat flux condition. The timewise variation of thermal damage is also obtained. The results depict that placing the PCM between the waterproof layer and the inner layer is the most appropriate design. In the current study, a one-dimensional numerical model is developed to predict combined heat transfer inside textile fabric and tissue layers. 1 mm PCM layer is placed inside to the fabric to examine the influence of amount PCM on the thermal comfort of the firefighter. Unlike the previous papers in the literature, thermal boundary condition on the protective cloth is defined as a function of time. A cyclic boundary condition is defined in such a way that the firefighter clothing is exposed to the flame for a certain duration of Δt exposure and then be far from the fire for Δt protection. II. Material & method II.1. Definition of the Problem Coupled transient heat transfer inside multi-layer firefighter protective clothing (FPC) and skin layers are numerically simulated. Figure 1 shows the layers of the fabric and the skin. There is a total of five layers in the FPC and skin consist of three layers. From left to right the layers of FPC are outer shell (L os = 0.7 mm), waterproof (L wp = 1.12 mm), PCM (L PCM = 1 mm), inner layer (L il = 0.95 mm) and air gap (L ag = 6.35 mm). The skin layers, on the other hand, are epidermis (L ed = 0.08 mm), dermis (L ed = 2.0 mm) and the subcutaneous (L sub = 10.0 mm). Figure 1. One dimensional mathematical model On the outer layer of the FPC, there is a timedependent and coupled boundary conditions. The mathematical expression of the boundary condition on outer surface is given as follows, T k q T T h T T x x fire x surr x (1) where q fire is the average heat flux of a flame. T x=0, T surr and T are the outer surface temperature, surrounding temperature and the ambient temperature, respectively. In the current analysis q fire is assumed to be 2.5 kw per unit area (Back et al. 1994). To simulate the variable boundary condition on the external surface of the FPC, q fire, T surr and T are defined as time-dependent. On the inner face of the tissue (x = L total), on the other hand, constant temperature is set, T x L T (2) core where T core is the internal core temperature of the body and set to be 310 K (Hu et al. 2013). Inside the skin layers, the heat transfer is quite complicated. In the current model, Pennes approach (Pennes, 1948) 616
172 is followed to simulate the heat transfer between the flowing blood and the surrounding tissue (Bergman et al. 2011). Pennes defined the rate of heat transfer from the blood as a volumetric heat source (or sink) term, q c T T (3) P blood blood core ω is the volumetric blood flow rate per unit volume of tissue and known as perfusion rate. ρ blood (= 1060 kg/m 3 ) and c blood (= 3770 J/kgK) are the density and specific heat of the blood, respectively. Blood perfusion ω = (m 3 /s)/m 3 is defined only in the dermis and subcutaneous layers. II.2. Solution Method One dimensional mathematical model is developed in ANSYS-FLUENT software. The governing equation which represents the heat diffusion inside the FPC is as follows, T ct k t x x (4) For each layer the density (ρ), specific heat (c) and the thermal conductivity (k) of the materials are defined according to the properties that are given in Table 1. For the PCM layer, apparent heat capacity approach of Morgan & Lewis (1978) is used. In this method, the phase change is assumed to take place in a small temperature range, rather than a sudden change at a single temperature. The narrow temperature band bounded by the solidus temperature (T m - δt m) and liquidus temperature (T m + δt m). The solid/liquid phase change region is mostly called mushy zone (Voller & Swaminathan, 1991). The latent (heat of fusion) of the material is defined regarding the heat capacity of mushy zone, c mushy h c c 2T 2 sf l s m (5) where h sf is the latent heat of fusion. 2δT m designates the mushy zone temperature range. Besides, c l and c s are the specific heat values of liquid and solid phases, respectively. In the current analyses to improve the accuracy of numerical prediction, a narrow mushy region is defined with 2δT m = 1 K. The melting temperature and heat of fusion of the PCM is T m = 351 K and h sf = 267 kj/kg, respectively. For epidermis and subcutaneous layers, an additional volumetric source (or sink) term should be defined to take into account the heat transfer with perfusion flow, T ct k q t x x P (6) The ANSYS-FLUENT software is used to resolve transient heat transfer inside the computational domain. A subroutine (User-Defined-Function - UDF) 617 is coded in C++ language to implement the perfusion flow term (Eq. 3) into the energy balance equation (Eq. 6). An external profile file is also imported into the software to define a cyclic boundary condition on the outer surface of the FPC. The computational domain is divided into control volumes and the time step size is selected to be 0.01 s. For each time step the absolute residual of the energy equation is reduced below 1E-8 to minimize the numerical errors. Table 1. Thermo-physical properties of layers (Hu et al., 2013) Layer ρ c k (kg/m 3 ) (J/kgK) (W/mK) Outer Shell Waterproof PCM Inner Layer Air gap Epidermis Dermis Subcutaneous II.3. Validation of the Method To assess the validity of the current method, the numerical work of Jiang et al. (2002) is reproduced. They have considered one-dimensional transient heat transfer inside skin layers. Initially, there is a linear temperature variation inside the domain between 34 C and 35 C. The outer surface of the skin raised to 90 C. Figure 2 compares the lengthwise temperature distributions and time-wise variation of threshold/3 rd -degree burn. In Figure 2(a) the dashed lines represent the results of reference paper and the solid ones are the current predictions. It is clear that there is a small discrepancy between the current results and the reference within the range of 3 mm to 5 mm. As mentioned before, in the reference work, Jiang et al. (2002) assumed that initially there is linear temperature profile inside the domain. However, since the details of the initial pattern did not provide in the reference work, in the current analysis, the initial temperature variation is assumed to be uniform. The small discrepancy may arise owing to the difference between the initial conditions. In Figure 2(b), the variations of threshold (1 st -degree burn) and 3 rd -degree burns are compared with the reference work. The thermal injury of skin starts when the temperature reaches above 44 C. The impact of the thermal burns, on the other hand, are classified regarding the dimensionless damage function, Ω(x, t). Takata (1974) states that a first-degree burn (threshold), second-degree burn and third-degree burn corresponds to Ω = 0.53, 1.0 and 10 4, respectively. Henriques and Moritz (1947) defines the burn damage as t, exp, x t P E RT x t dt (7) 0 where ΔE is the activation energy (J/kmol), P is the frequency factor (1/s), and R is the ideal gas constant

173 (J/kmol.K). In the reference work, authors did not indicate the numerical values for ΔE and P. There are several models to evaluate the activation energy and the frequency factor of the skin layers. In the current work, the burn damage is calculated with using four different models. For each model, the values of ΔE and P are given in Table 2. An additional MATLAB function is developed to compute the thermal damage function (Ω) for each computational node. At the end of each time step the temperature distribution is transferred from ANSYS-FLUENT to MATLAB code. Table 2. Thermal damage parameters for different models Temperature ΔE P Model Range (J/kmol) (1/s) ( C) #1 Henriques (1947) All T 6.27E8 3.1E98 T E8 3.1E98 #2 Fugitt (1955) T > E8 5.0E45 T E E124 #3 Stoll & Greene (1959) #4 Takata (1974) T > 50 T 50 T > E8 4.18E8 6.69E E E E104 of the material significantly alters the evaluation of thermal burn. Since the precise values are not provided in the reference work, it is not possible to perform a proper comparison regarding the thermal injury. However, it seems that the results obtained from Model #1 (Henriques, 1947) are the closest one to the reference paper. III. Results & discussion In the current analyses, a cyclic boundary condition is defined in such a way that the firefighter clothing is exposed to the flame for the duration of Δt exposure and then be far from the fire for Δt protection. To simulate the cyclic boundary condition on the surface of the fabric, the first terms in Eq. (1), q fire is defined to be 2.5 kw/m 2, during the exposure duration. On the other hand, q fire is set to be zero during the protection time. That is, the stored energy inside the fabric or skin is released through the ambient in the protection period. The parameters that have been considered in the current numerical survey are listed in Table 3. Five fire exposure cases are examined by varying the ratio of exposure time to protection time as 1, 2, 3, 6 and 12. The current paper is motivated to investigate the merits of the implementation of PCM layer in protective clothing. Two sets of scenarios have been considered. In the first scenario, the reference clothing in which there is no PCM layer is simulated. In the second one, on the other hand, a model is generated which includes 1 mm PCM between the waterproof and inner layer, as illustrated in Figure 1. Table 3. Cyclic boundary conditions on the protective clothing Protection Exposure Case Ratio (s) (s) # (a) Temperature distribution (b) The evaluation of thermal burn Figure 2. Comparative results with Jiang et al. (2002) The time-wise variations of the thermal damage that are obtained from four different injury models are compared with the reference work in Figure 2(b). One can see that the activation energy and frequency factor 618 # # # # In Figures 3 and 4, the thermal response of a firefighter clothing, which does not include, under varying boundary conditions, as listed in Table 3, are represented. Figure 3 shows the time-wise variation of the average skin layer, epidermis, dermis and subcutaneous, temperatures. Here epidermis, dermis, and subcutaneous layers are represented by solid, dashed and dotted lines, respectively. Increasing the exposure time, as expected, raises the average skin temperature. The influence of cyclic boundary condition becomes significant for higher exposure / protection durations, such as Cases 3, 4 and 5. When the boundary condition is switched from exposure to the protection mode, the curves become flat, so that step-like curves are observed. At the end of 900 s, the mean temperature of the epidermis layer reaches almost 80 C for Case 5. The average temperature of dermis layer, on the other hand, reaches nearly 75 C, at t = 900 s. The subcutaneous

174 layer temperature reaches to 45 C, which is higher than the critical temperature for thermal injury, at t = 675 s. For Case 4, in which the exposure to protectiontime ratio is 6, the maximum temperatures for epidermis, dermis and subcutaneous layers are observed to be 73 C, 69 C and 46 C, respectively. Decreasing the exposure period, i.e. Case 3 and 2, the maximum temperatures reduce significantly. In Case 3, the mean temperature of epidermis layer remains below 60 C. The dermis layer temperature is close to the epidermis layer, which is 57 C. For Case 2, the mean temperatures epidermis and dermis layers are 54 C and 52 C, respectively. In Case 1, the average temperatures of epidermis layer just reach to 45.6 C and 44.6 C at the end of 900 s, respectively. One can infer that the temperature gap between epidermis and dermis layers reduces as the protection time increases. Figure 3. Time-wise variation of skin-layer temperatures without PCM Figure 4 illustrates the progress of the thermal burn. Here the solid lines represent the 1 st -degree burn and dashed ones denote the 3 rd -degree burn. 1 st degree and 3 rd -degree burns are defined regarding the damage function, Ω(x, t). For Case 1, which corresponds to 10 s exposure and protection durations, there is no thermal damage. Doubling the exposure time to 20 s, Case 2, causes thermal burn after 700 s. In Case 2, only 1 st -degree burn is observed, and the depth of burn reaches to 1.23 mm. In Case 3, on the other hand, the thermal burn starts earlier, at t = 500 s and becomes effective in a depth of 2.93 mm. 1 st - degree burn penetrates into deeper in Case 4. The starting time of thermal burn are 375 s, and the maximum depth is 4.46 mm. 3 rd -degree burn is observed in Case 4 when the damage function (Ω) reaches up to rd -degree burn starts at t = 786 s, and at the end, it affects 1.22 mm. For the longest exposure duration, Case 5, on the other hand, the 1 st - degree burn appears at t = 330 s and penetrates into 5.29 mm. 3 rd -degree damage also occurs quite earlier, at t = 600 s and becomes effective on 2.57 mm. Figure 4. Evaluation of thermal burn without PCM Figure 5 represents the time-wise variations of skin layers for firefighter clothing which includes 1 mm of PCM between the inner layer and waterproof. It is interesting to note that, the skin layers vary with time almost identically until t = 600 s. PCM inhibits temperature rise on the skin surface and maintains nearly constant temperature for 600 s for all cases. At the end of 600 s, for Case 5, which corresponds the highest fire exposure duration, the mean maximum temperature values for epidermis and dermis layers starts to increase and reaches up to 47 C and 45 C at the end of 900 s, respectively. Since the skin layer temperature remains below the critical temperature, 44 C, the thermal burn is not observed in the scenario in which PCM is used inside the firefighter clothing. Figure 5. Time-wise variation of skin-layer temperatures 1 mm PCM layer In Table 4 the results of two scenarios, the regular firefighter clothing and the one which includes PCM, are briefly compared. Here since there is no thermal burn is observed for the scenario in which PCM is used, the related column is removed from the table. For even the worst case, Case 5, the PCM provides an improved protection to the firefighter and reduces the maximum skin temperature almost by 30 C. More importantly, implementing the PCM blocks the thermal deteriorations. 619
175 Table 4. Comparative results for scenarios without PCM and with PCM Case Max. Temp. ( C) w/o PCM Depth of 1 st Degree Burn (mm) Depth of 3 rd Degree Burn (mm) with PCM Max. Temp. ( C) # # # # # IV. Conclusion This study focused on the development of a numerical model in a commercial CFD code, ANSYS-FLUENT, to simulate the bio-heat problem for a firefighter clothing. Following results can be concluded: CFD model predicts the time-wise temperature variations and the progress of thermal damage are in accordance with the reference work, Increasing the duration of fire exposure for a firefighter causes deeper thermal deteriorations. The time of protection should be increased to provide excessive heat removal from the fabric. It is clear that PCM provides an improved protection. The maximum temperature of the skin layer remained close to the critical value for thermal burn so that no injury is observed in PCM usage. Further studies should be done to optimize the thickness, position and type of the PCM. The melting temperature of the PCM should be selected according to the maximum temperature values within the clothing. References Alshaer, W. G., Nada, S. A., Rady, M. A., Le Bot, C., & Del Barrio, E. P. (2015). Numerical investigations of using carbon foam/pcm/nano carbon tubes composites in thermal management of electronic equipment. Energy Conversion and Management, 89, Back, G., Beyler, C. L., DiNenno, P., & Tatem, P. (1994). Wall incident heat flux distributions resulting from an adjacent fire. Fire Safety Science, 4, Bergman, T. L., Incropera, F. P., & Lavine, A. S. (2011). Fundamentals of heat and mass transfer. John Wiley & Sons. Ezan, M. A., & Erek, A. (2012). Solidification and Melting Periods of an Ice-on-Coil Latent Heat Thermal Energy Storage System. Journal of Heat Transfer, 134 (6), Fugitt, C. E. A rate process of thermal injury. Armed Forces Special Weapons Project, 1955, AFSWP Henriques, F. C. Studies of thermal injury. V. The predictability and the significance of thermally induced rate processes leading to irreversible epidermal injury. Arch. Pathol., 1947, 43, Henriques Jr, F. C., & Moritz, A. R. (1947). Studies of thermal injury: I. The conduction of heat to and through skin and the temperatures attained therein. A theoretical and an experimental investigation*. The American journal of pathology, 23(4), 530. Hu, Y., Huang, D., Qi, Z., He, S., Yang, H., & Zhang, H. (2013). Modeling thermal insulation of firefighting protective clothing embedded with phase change material. Heat and Mass Transfer, 49(4), Jiang, S. C., Ma, N., Li, H. J., & Zhang, X. X. (2002). Effects of thermal properties and geometrical dimensions on skin burn injuries. Burns, 28(8), Kenisarin, M., & Mahkamov, K. (2007). Solar energy storage using phase change materials. Renewable and Sustainable Energy Reviews, 11(9), Li, Y., & Zhu, Q. (2004). A model of heat and moisture transfer in porous textiles with phase change materials. Textile Research Journal, 74(5), Mondal S (2008) Phase change materials for smart textiles An overview..applied Thermal Engineering, 28: Morgan, K., R. W. Lewis, and O. C. Zienkiewicz. An improved algrorithm for heat conduction problems with phase change. International Journal for Numerical Methods in Engineering 12, no. 7 (1978): NFPA (2008) Thermal Capacity of Fire Fighter Protective Clothing, Fire Protection Research Foundation. Pennes, Harry H. "Analysis of tissue and arterial blood temperatures in the resting human forearm." Journal of applied physiology 1, no. 2 (1948): Sarier N., & Onder E. Organic phase change materials and their textile applications: an overview. Thermochimica Acta 540 (2012): Shaid, A., Wang, L., & Padhye, R. (2015). The thermal protection and comfort properties of aerogel and PCM-coated fabric for firefighter garment. Journal of Industrial Textiles, Shin, Y., Yoo, D. I., & Son, K. (2005). Development of thermoregulating textile materials with microencapsulated phase change materials (PCM). II. Preparation and application of PCM microcapsules. Journal of Applied Polymer Science, 96(6). Stoll, A. M. and Greene, L. C. Relationship between pain and tissue damage due to thermal radiation. J.
176 Appl. Phys., 1959, 14(3), Takata, A. N. Development of criterion for skin burns. Aerospace Medicine, 1974, 45, Tian, Y., & Zhao, C. Y. (2013). A review of solar collectors and thermal energy storage in solar thermal applications. Applied Energy, 104, Tong W, Tong A (2015) Thermal Modelling on Solar- Absorbing Metamaterial Microencapsulation of Phase Change Materials for Smart Textiles. J Textile Sci Eng 5: 190. Tyagi, V. V., Pandey, A. K., Buddhi, D., & Kothari, R. (2016). Thermal performance assessment of encapsulated PCM based thermal management system to reduce peak energy demand in buildings. Energy and Buildings, 117, Voller, V. R., & Swaminathan, C. R. (1991). ERAL Source-based method for solidification phase change. Numerical Heat Transfer, Part B Fundamentals, 19(2),
177 Experimental Investigation of a Panel Radiator with Latent Heat Storage Guvenc Umur Alpaydin *, Serhan Kucuka, Dokuz Eylul University, Department of Mechanical Engineering, Izmir, Turkey * [email protected] Abstract In this study, the PCM-filled custom production radiator and standard radiator are compared in terms of heat capacity, heating and cooling time, energy efficiency. Double Panel & Double Convector (Type 22) radiator with an area of 600 x1000 mm, is used. Front panel divided into two equal parts by a thin sheet. One of these parts filled with phase change material (PCM). Paraffin-like materials which have a melting temperature of 45 o C 50 o C is used as the PCM. 2 types radiators were tested in laboratory of ELBA Inc. Lt. The first of them was designed as PCM-filled radiator, the other was a standard radiator which have the same features as designed radiator. First, the flow rates and heat capacities are calculated of radiators with Delta 30 o C, Delta 50 o C and Delta 60 o C. After that, heating-cooling tests made with the help of flow rate of Delta 50 o C. Then water circulate was cut and cooling rates were found in cooling tests. Temperature measurements were made from the PCM-filled part with the help of four probes. Probes were placed on the front surface. Thus temperature variation was observed. In heating time, amount of heat transfer from the water and energy efficiency of the system are obtained with the variation of ambient temperature. Radiator is photographed by using thermal camera during the experiments. Keywords: Panel radiator, Thermal energy storage, Phase change material I. Introduction Thermal Energy Storage (TES) has gained more and more importance, because of rising environmental concern, in last 20 years. Phase change materials (PCMs) store a huge amount of energy as latent heat. They are using as thermal energy storage materials because of the high storage capacity. PCMs can be divided into organic and inorganic. Most organic PCMs are suitable for building applications. Because they are non-corrosive and compatible with most building materials. Futhermore organic PCMs are chemically stable and recyclable. However, they have a few disadvantages such as low thermal conductivity and flammability. Inorganic PCMs are nonflammable and less cost than organic PCMs. But they are corrosive and their phase change properties can be effected some factors such as supercooling (Bruno, 2004). The use of PCMs for thermal energy storage has received a great interest in space heating and cooling application of thermal energy in recent years. Some of the building applications is aimed to reduce electricity consumption with the stroge off peak electricity. Brandstetter et al. (1990) are studied the thermal energy storage by using salt hydrates. They suggest that if TES is used for off-peak space heating and solar greenhouse climate control, electricity consumption could be reduced. Another study, Farid et al. (2001), are used active floor system for off-peak storage of thermal energy in buildings. They placed 30-mm layer paraffin wax (melting point, 40 o C) between the heating surfaces. It was calculated that heat output increasing from 30 W/m 2 to 75 W/m 2 when PCM was used as storage material. TES also is used the storage renewable energy for using in building. Different applications have been made to store renewable energy. For instance, PCMs could be integrated with building wall. Stritih et al. (2004), are studied that solar wall with Paraffin wax (melting point, o C) that choose as PCM. Solar energy was stored in PCM and it was used for heating the air for the ventilation of the house. It was calculated that the efficiency of the absorption was 79%. Knowler (1983) aimed to increase the overall conductivity and efficiency in the Trombe wall and used paraffin wax with metallic additives. Cabeza et al. (2007) are studied a concrete wall that included a PCM for increase thermal inertia of wall. PCM which has low melting temperature was chosen considering to the ambient temperature. Another type of TES using in building application was presented by Erkek et al. (2013). They used a 600x1000 panel radiator and assembled a storage unit that had 17 mm thickness, on the front of heat surface. They compared and monitored with thermal camera two different quantity (9-13 kg) of stearic acid during both charcing and discharging periods. It is estimated that 9 kg stearic acid showed better performance. In this study, Double Panel&Double Convector radiator is used for heating application of building. Front panel of the radiator was divided into two equal parts with a thin sheet and one of them was filled with PCM. Paraffin wax was used as PCM because of applicationable on buildings and suitable for using in radiator. PCM-filled radiator and a standard radiator were tested at three different excess temperatures 622

178 (30 o C 50 o C - 60 o C). After these tests, two radiators were observed with thermal camera and temperature measurements of front panel obtained with the help of probes during heating and cooling periods. II. Experimental Facility In experimental setup, paraffin wax is chosen as a PCM because it is easily accessible and suitable for radiator applications. When to decided which paraffin will be used, it was considered that the temperature of the radiator reaches and tricosane is preffered by reason of its melting range (45 o C 50 o C). Differential Scanning Calorimetry (DSC) analyse is used to precise measurement melting temperature, heat of fusion, latent heat of melting, and heat capacity of Tricosane. Result of DSC analyse is given in Fig.1. outer surface of the test chamber is insulated. Water is passed through inside of the collectors that are in panels expect a panel which is connected to radiator. Inner temperature of chamber is controlled with temperature of water flow. Chamber s dimensions are 4x4x3 m. Temperature measurement is made in the middle of the room and 75 cm high from the floor. Test room and test methods stated in standard of TS EN442-2 / March After that, heating and cooling test were conducted respectively. Firstly, room temperature was stable (20 o C) and water flow is given at specific temperature during heat capacity test. Excess temperature was calculated with inlet, outlet and room temperature according to Eq.1, T = (T in+t out ) T 2 room (1) When oulet temperature reached to an excess temperature test would be made. Inlet and outlet temperatures are shown in Table 1 according to excess temperature. Fig. 1: DSC result for Tricosane Fig. 1 show that the melting has been started and ended at C C respectively and also the enthalpy of this range was found to be 130 J/g. During the radiator design intended to change the appearance of ordinary radiators. Therefore, front panel of the radiator was divided in two parts by placing a sheet. Thickness of sheet was 1.1 mm. Except for the holes that is used for paraffin was put inside, indistinguishable from classic appereance. Half of the front panel was used as the water circulation, the other half is used a paraffin reservoir. Each of these parts had 1.3 liter volume approximately. It would be decreased the amount of water to pass through the radiator, and heat capacity of the radiator would be reduced. So a Double Panel&Double Convector (1000x600mm) radiator was selected in order to prevent decreasing in heat capacity. Tab. 1: Inlet and outlet temperatures according to excees temperature Excess Temp( T) ( C) Inlet Temp.(T in) ( C) Outlet Temp.(T out) ( C) Room Temp.(T room) ( C) When all temperatures were stable, test was started. In heating (charcing) period is started with constant inlet temperature and water flow. Charcing period continues until the outlet temperature fixed. Then charcing period was over and to moved to the discharcing periods. In cooling (discharcing) period, inlet and outlet flow is closed and the variation with time of the radiator temperature was monitored. During in charcing and discharcing periods, radiator surface was monitored with thermal camera. Each 15 seconds, surface temperature was recorded through the instrument of four probes. It was shown that location of the probe is shown on radiator in the test room in Figure o C water is circulated through radiator when paraffin fillling in order to solidify to not reach every part of the reservoir. For thermal tests, radiator is connected to a test chamber that is in the laboratory of ELBA. Wall of the chamber is made from sandwich panels and the 623


179 1 2 second until temperatures were fixed. This variation with time of outlet temperatures of radiators is shown in Figure Fig 2. The locations of probes on the radiator The probes are spaced apart 100 mm from the right and left sides and adjacent to the upper and lower sides. III. Results and Discussions III.1.Heat Capacity Test Water flow is calculated and inlet, oulet, room temperatures are recorded for heat capacity test. Each excess test was repeated minimum 12 times. The results are averaged heat capacities are calculated. Thermal capacities measured for different excess temperatures are given in Table 2 and Figure 3. Fig. 4: Variation of outlet temperature at constant inlet temperature Outlet temperature of standard radiator higher than PCM-filled radiator at the beginning of the heating period since stored thermal energy by PCM. About 20 minutes later, outer temperatures are fixed at 65 o C. Temperature of PCM reservoir is measured by probes in this period. Temperatures difference between the top and the bottom sides close to each other. Because of that, among themselves, the average of the upper and lower probes was taken. This average temperature values are showed in Figure 5. Tab. 2: Heat capacity of radiators for three excess temperatures Excess Temp ( T) ( C) Q std Q PCM T=30 C W 790 W T=50 C 1647 W W T=60 C W W Fig.5: Front panel temperatures at heating period Fig. 3: Comparing of heat capacity of radiators for three excess temperatures As it is seen, depending on excess temperature ( T), PCM filled radiators radiator heat capacities are lower than seems to be lower than standard radiator, % 5.5, % 4 and % 3.5 respectively. III.2. Heating Test In heating period, inlet temperature was constant and 75 o C and outlet temperatures was recorded each 15 Because of storing heat in PCM, temperature of the PCM-filled radiator rose more slowly than standard radiator as shown as Figure 5. On the other hand, when heating period completed and the system reached a steady state, front surface temperature of the PCM-filled radiator is lower than standard radiator because of thermal resistance of PCM. As a result of the front surface temperature measurement, thermal capacity of PCM-filled radiator is lower than the standard radiator. III.3. Cooling Test Thermal behaviours in cooling period of standart and PCM-filled radiator, compared with cooling tests. Therefore water inlet was cut to when the temperatures of radiators accessed steady state situation. Time-wise surface temperature variation of radiators were observed. Temperature variation of 624


180 PCM reservoir obtained with probs and it is given in Figure 6. heat storage capability of the phase change material seconds is accepted as the time to reach steady state. The amount of heat release from water to two types of radiators is equal to stored heat in PCM. It can be calculated by using following equation w,pcm w, std * (3) 0 Q q q dt kj storage Fig.6: Temperature of PCM reservoir at cooling period After the water circulation is stopped, surface temperatures of standard and PCM-filled radiators are reduced to 72 C and 65 C, respectively. As espected, the cooling rate of PCM-filled radiator is lower than standard radiator. Surface temperatures of radiators are closed to each other after 4000 seconds. It may be stored latent heat by PCM in this time range. Moreover, PCM-filled radiator was hotter than standart radiator, about during 3600 seconds. After 500 seconds, front surface temperature of PCM-filled radiator was higher the temperature range of 3-8 C from standard radiator during cooling period. III.4. Heat Storage of PCM In heating period, a portion of the heat release by water transferred to room from radiator surface. Other portion stored by radiator and PCM. The rate of heat release by water calculated from following equation; PCM in solid phase in beginning of the heating period and after 900 seconds it completely melted. Enthalpy exchange between the initial and final state can be calculated by the following equation;,i,f h C * T T h C * T T (4) PCM s sl i sl l f sl Specific heat of solid tricosane is 2.5 kj/kgk, liquid tricosane s is 2.75 kj/kgk. Heating period took place between 20 o C and 61.2 o C. In this period, enthalpy change is calculated as; ( h PCM ) = 225 kj/kg. In the reservoir, the mass of PCM is 1.03 kg. According to Eq.5, PCM is stored kj heat. Q m * h (5) PCM PCM PCM III.5. Thermal Camera The results obtained with the probes are supported with thermal camera views during in heating and cooling periods. Termal images are given for 20 minutes after the start of each period. q m * C * T T (2) w w w wi wo Variation of heat release rate for two radiators is given in Figure 7. Fig. 7: Amount of heat which transferred from water to radiator In Figure 7, it is seen that PCM-filled radiator became steady state later than standard radiator. An important part of the heat transfer difference is due to the latent 625 (a) Standard radiator (b) PCM-filled radiator Fig.10: Thermal images at 20 minute of heating period It is shown that, a portion of PCM was already solid or mushy phase in heating period. The reason of this, temperature of PCM-filled radiator is increased slowly than standard radiator. At this time, average temperatures of standard radiator and PCM-filled radiator were 64.9 o C and 59.8 o C respectively. Due to the slowness at heating period, time to the reach steady state condition of PCM filled radiator more slowly than standard radiator. Thermal images of steady state period are given at Figure 11.

 q w m w : Heat rate of water (W) : Flow rate (kg/s) C w : Specific Heat of Water (J/kgK) T wi : Water inlet temperature (")
181 their supports. This research was carried out the heat capacity laboratory of ELBA INC. Nomenclature (a) Standard radiator (b) PCM-filled radiator Fig. 11: Thermal images at state steady condition In steady state condition, PCM completely melted. Average temperatures of standard radiator and PCM-filled radiator were 65.1 o C and 61.2 o C respectively. PCM-filled radiator is colder than standard radiator in steady state situation. (a) Standard radiator (b) PCM-filled radiator Fig. 12: Thermal images at 20 minute of heating period T : Excess temperature ( C) q w m w : Heat rate of water (W) : Flow rate (kg/s) C w : Specific Heat of Water (J/kgK) T wi : Water inlet temperature ( C) T wo : Water outlet temperature ( C) Qstorage : Heat storage at PCM (KJ) : Heat rate of water at PCM-filled (W) q w,pcm q w,std h FDM h sl C s C l Tm T m Tm T m T i T f : Heat rate of water at standard (W) : Enthalpy Change (J/kg) : Latent Heat (J/kg) : Specific heat in Solid Phase (J/kgK) : Specific heat in Liquid Phase (J/kgK) : The start of the melting temp ( C) : The end of the melting temp ( C) : Initial Temperature ( C) : Final Temperature ( C) PCM filled radiator was cooling more slowly than standard radiator during cooling period as seen in Figure 12. PCM still is not in completely solid phase after 20 minutes of starting cooling period. In this time, temperature of PCM-filled radiator was 47.2 o C and difference of average temperatures between two radiators was 10 o C approximately. IV. Conclusions In this study, front surface of a standart panel radiator is divided into two equal parts. One of them, filled with PCM. Thermal behaviour of this radiator is compare with standart panel radiator. Results are showed that, heat capacity of PCM-filled radiator % lower than the other one for the reason of thermal resistance of PCM. When started the hot water circulation, PCM-filled radiator is more slowly accessed steady state than the other one. This was about 15 minutes and also, in state steady condition, for averages of the top and down probes, standart radiator s surface temperature 7 o C higher than the other. When inlet cut off and starting cooling periods, surface temperature of PCM-filled radiator 3-8 o C higher than surface temperature of standart radiator. Acknowledgements The authors are gratefully thanks to ELBA INC for 626 References Brandstetter A., Kaneff S., Materials and systems for phase change thermal storage, Proceedings Ist world renewable energy congress, , (1990). Bruno F., Using phase change materials (PCMs) for space heating and cooling in buildings, Australian Institute of Refrigeration, Airconditioning and Heating, 27-31, (2004). Cabeza L.F., Castello n C., Nogue s M., Medrano M., Leppers R., Zubillaga O., Use of microencapsulated PCM in concrete walls for energy savings, Energy Build., 39, , (2007). Erkek U.T., Gungor A., Experimental performance evaluation of PCM thermal storage in a panel radiator, Mediterranean Congress of Climatization, , (2013). Farid M. and Kong W., Underfloor heating with latent heat storage, Proceedings British Institute of Mechanical Engineering, vol. 214, Part A, , (2001). Knowler T., Proportioning composites for efficient-tsws., Solar Energy, 31(3), , (1983). Stritih U., An experimental study of enhanced heat transfer in rectangular PCM thermalstorage,
182 International Journal of Heat and MassTransfer, 47, , (2004). TS EN 45001, General criteria for the operation of testing laboratories. TS EN 442-2, Radiators and Convectors - Part 2: Test methods and rating. 627
183 Energy and Exergy Analyses of a Hybrid Solar-Geothermal Power Plant Duygu Melek Cakici 1, Anil Erdogan 1, Can Ozgur Colpan 2* 1 Dokuz Eylul University, The Graduate School of Natural and Applied Sciences, Mechanical Engineering Department, Tınaztepe Yerleskesi, Buca, Izmir, 35397, Turkey 2 Dokuz Eylul University, Faculty of Engineering, Mechanical Engineering Department, Tınaztepe Yerleskesi, Buca, Izmir, 35397, Turkey * [email protected] Abstract In this paper, the thermodynamic performance of a supercritical organic Rankine cycle (ORC) integrated with parabolic trough solar collectors (PTSC), which uses the energy of geothermal water and solar energy as the heat sources, is investigated. As a case study, an existing geothermal power plant based on a supercritical ORC is analysed using energy and exergy analyses. Control volumes enclosing each component of the ORC and PTSC are taken; and detailed thermal models are developed for the heat exchanger and PTSC; whereas energy balances are applied to the remaining components (turbine, desuperheater, air cooled condenser, and pump). The set of modeling equations is solved by Engineering Equation Solver (EES). The effect of different working fluid on the output parameters of the system is examined. These parameters include the power output of the turbine, the power input of the pump, the net power output, and electrical and exergetic efficiencies of the system. As a result of this study it is found that using R134a as the working fluid yields higher performance for the integrated system than the other working fluid types. Keywords: Organic Rankine cycle, geothermal, solar, hybrid power plant, working fluid, energy analysis, exergy analysis. I. Introduction Renewable energy resources and technologies have increased its importance in the World. Among the different types of renewable energy resources, the utilization of geothermal and solar resources to generate useful energy has increased its popularity. Geothermal energy is defined as heat coming from the core of earth. Temperature close to the centre of the Earth is around 5500 C. Scientists estimate that 42 million megawatts (MW) of power flow through the Earth s interior (Geothermal Energy, 2014). The heat from the Earth's core continuously flows outward. When water is heated by the earth s heat, hot water or steam flows through the earth surface. Geothermal has been used as an energy source for a very long time. Practical uses of geothermal energy for bathing, washing, and cooking purposes date back to ancient times. Since the Eighth century, the Japanese and the Romans used thermal springs for health. In the middle Ages, Arabs and Turks developed the traditional use of thermal baths (Hepbasli and Ozgener, 2004). These uses lead the way to the modern balneological industry. Another important application of geothermal energy is the power production in the form heat and electricity. Geothermal power development is witnessing a rapid growth worldwide (Zarrouk and Moon, 2014). There are different types of geothermal power plants. The single-flash plant is a relatively simple way to convert the geothermal energy into electricity. Geothermal wells produce a mixture of steam-liquid. High pressure geothermal fluid from the well is separated as water and steam in a low pressure separator. Then steam enters the turbine and liquid is sent back to the reinjection wells. The double-flash power plant uses two-stage separation processes, thus energy production is more than the single-flash power plant. Using two separators in the cycle increases the efficiency. In binary power plants, the working principle is as follows: Geothermal fluid (brine) is separated into two phases (liquid and vapor). Vapor enters the heat exchanger and heats up the second working fluid. This working fluid enters the turbine and generates power. Then, this fluid enters the condenser, and pumped back to the heat exchanger. Geothermal liquid exiting the heat exchanger is pumped into the reinjection well. Turkey is one of the countries that has a big potential of geothermal energy due to its geographical position. Turkey is located on the Alpine-Himalayan orogenic belt, which has high geothermal potential. There are high spring temperature fields and enthalpy grabens. Some of these fields are Büyük Menderes Graben, Gediz Graben and Simav Graben (DiPippo, 2012). High temperature fields are suitable for electricity generation applications. The potential for electricity generation from these fields are 1500 MWe in Turkey (Jeotermal enerji kullanım alanları, 2012). Different technologies can be used to generate electricity in solar applications. Concentrated solar power systems are one of them. These systems are suitable to work at moderate and high temperatures. The main disadvantages of these systems are as follows: manual control process, need a sun tracking 628
 and collected in the absorber.")
184 system, and maintenance cost is high. Concentrated collectors contain two main parts: reflector surface and absorber tube. Incident sun beam is reflected by the reflector surface (mirror) and collected in the absorber. Then, temperature of the fluid in the absorber rises and heat energy is transferred into another working fluid with the heat exchangers. Electricity is generated using energy of the working fluid with the help of some equipment such as turbine and generator. Using hybrid system (combination of different energy technologies) to generate power has been considered as a feasible option for a modern electrical grid. Environmental, economical, technological and social factors should be taken into account when designing a hybrid system. Hybrid systems can be grouped according to the following features: the rated power (low, middle, and high), energy storage types, the type of the produced energy, and the number and type of the energy resources (Lazarov et al., 2005). First of all, the potential of the resource to be used in the system must be determined. These chosen resources must complement to each other. In addition, the local resources are an important factor for the system. Hybrid energy systems provide more efficient utilization of energy resources and better thermodynamic performance of the system. In this regard, hybridization of solar and geothermal power plants has taken the attention of the researchers recently. There are some studies about hybrid solar-geothermal power plants. For example, Ghasemi et al. (2014) studied a low temperature solar trough system integrated to an ORC. This study shows that second-law efficiency for the hybrid system is 3.4% higher than the single geothermal and solar systems. Kerme and Orfi (2015) presented the thermodynamic modelling of an ORC driven by PTSCs. The effect of some operating parameters such as the turbine inlet temperature and the working fluid on the system performance parameters such as irreversibility ratio and total exergy destruction were investigated. According to the results of the analyses, o-xylene gave the best energetic and exergetic performance. It is also shown that if the turbine inlet temperature increases, the system net electric efficiency, the net electric power and the exergy efficiency increase. However, it reduces the total exergy destruction rate. Finally, the highest exergy destruction ratio was found as 74.9% for the PTSCs. Zhou et al. (2013) compared the performance of hybrid solar-geothermal systems with stand-alone solar and geothermal plants. They investigated the effect of ambient temperature, solar irradiance, geographical location, and resource quality on the hybrid system under the steady-state and unsteady-state conditions. The result of their study under the steady-state conditions showed that the net power output of the hybrid plant increases with increasing the solar irradiance and geothermal reservoir temperature or reducing the ambient temperature. In another study, Al-Sulaiman (2014) 629 presented a detailed exergy analysis for an integrated PTSC and combined steam and ORC. The effect of seven different working fluids on the system performance was investigated. The following important parameters were examined for the exergy: exergy efficiency, exergy destruction rate, fuel depletion ratio, irreversibility ratio, and improvement potential. As a result of this study, exergy efficiency was found as 26% for R134a, 25% for R152, and 20% for R600a and the overall exergetic improvement potential of the system was calculated as 75%. It was also shown that PTSCs are the main source of the exergy destructions. Literature survey conducted shows that there are limited number of studies on the hybridization of PTSC and ORC systems. In this study, the thermodynamic performance of a supercritical ORC combined with PTSC is investigated. This power plant, which is based on a supercritical ORC, is analyzed using energy and exergy balances. In addition, a detailed thermal model was formed for the shell and tube heat exchanger and PTSC. The effect of different ORC working fluids on the performance of the system is investigated. The performance assessment parameters include the net power output, and electrical and exergetic efficiencies. II. System Description A solar farm consisting of several PTSCs are integrated to an ORC as shown in Fig. 1. The working principle of this system is as follows. Geothermal brine enters the heat exchanger group consisting of several shell and tube type heat exchangers (120.7 kg/s, C and 780 kpa). The geothermal brine transfers its heat to the working fluid circulating in the ORC. Then, the working fluid circulates in the ORC (at a mass flow rate of kg/s). More specifically, it enters the following components of the ORC consecutively: the turbine (at a pressure of 4370 kpa), the desuperheater (at a pressure of 947 kpa), the air cooled condenser, the pump, the desuperheater again, and the heat exchanger group. Geothermal brine leaving the heat exchanger group enters the reinjection wells. Fig. 1: Solar-geothermal hybrid power plants (Modified from US DOE, 2012) III. Theory In this study, energy and exergy balances are applied to the control volumes enclosing each component of the integrated system. These control volumes are as
185 follows: heat exchanger group, PTSC, solar-orc heat exchanger, turbine, desuperheater, pump, and ACC. Using the model developed, the effect of working fluid on the performance of the ORC is studied. The following main assumptions are made in the analyses: Pressure changes in the heat exchangers (the heat exchanger integrating geothermal side and ORC side, solar-orc heat exchanger, desuperheater, and condenser) and the pipes are neglected. Heat transfer from the control volumes enclosing the components of the ORC to the surroundings is neglected. Kinetic and potential energy effects are neglected. The system runs at steady state. III.1 Energy Analysis of the Integrated System III.3 Performance Assessment Parameters Applying energy and exergy analyses presented in Sections 3.1. and 3.2., the total energy and exergy transfer by heat input, net power output, and electrical and exergetic efficiencies of the integrated system can be calculated. The electrical efficiency of the integrated system can be shown as follows. n el = W net Q solar +Q geotermal (8) Three different exergetic efficiencies of the integrated system are defined in this study as shown in Eqs. (9)-(11). These efficiencies differ from each other in terms of the inclusion of the exergy rate from the sun in the equation (Greenhut, 2010). The modelling of the heat exchangers is done according to the ε-ntu method. The modelling equations for this method can be found in the book by Kakaç et al. (2002). Using this method, the heat transfer rate from the hot fluid to the cold fluid in the exchanger can be found using Eq. (1). Q = ε Q max (1) ε x,1 = ε x,2 = ε x,3 = W net E x,solar+e x,hx W net E x,tf,o+e x,hx W net E x,tf,i o+e x,hx (10) (9) (11) In Eq. (1), Q max and ε can be found using Eqs. (2) and (3), respectively. Q max = C min (T h,i T c,i ) = C min ΔT max (2) ε = f (NTU, C min C max ) (3) The PTSC modeling equations are taken from the literature (Duffie and Beckman, 2013; Kalogirou, 2009). The rate of heat transferred from the solar farm to the thermal fluid can be found using Eq. (4). Q u = N PTSC F R [SA a A r U L (T i T a )] (4) For the remaining components of the ORC system, the steady-state energy balance (Eq. (5)) for the control volume enclosing that component is used. de cv dt = m i(h i + 1 i V 2 i 2 + gz i ) m e(h e + 1 e V 2 e 2 + gz e ) + Q cv W cv (5) III.2. Exergy Analysis To conduct the exergy analysis, firstly, specific flow exergy of each state is found using Eq. (6). In this equation, the subscript 0 denote the dead state (i.e. T=T0, p=p0). Then, steady-state exergy balance for a control volume (Eq. (7)) is applied to calculate the exergy destruction rate within that control volume. ex f = h h 0 T 0 (s s 0 ) + V2 + gz (6) (1 T 0 j T j ) Q j W cv + i m iex fi 2 e m eex fe E x d = 0 (7) 630 IV. Results and Discussion In this section, the effect of the selection of working fluid on the performance of the integrated system is investigated. Five different organic fluids (R134a, R124, R142b, R227ea, and Isobutane) are selected as the working fluid in the ORC. The selection of the working fluid is done considering the following requirements: the turbine inlet must be in a supercritical state and the temperature of the geothermal water leaving the heat exchanger must be equal to or greater than 60 C not to cause the precipitation of the silica in the brine. The input parameters that are not altered for this study are as follows: production well temperature, ambient temperature, pressures, mass flow rate of geothermal fluid, organic fluids and air, isentropic efficiencies of the turbine and the pump, geometric data of parabolic solar collectors, number of solar collectors, thermodynamic properties of thermal fluid (Therminol VP1), and design parameters of heat exchanger. Net power output, electrical efficiency, exergetic efficiency (for the three approaches), total energy transfer by heat input and total exergy transfer by heat input are calculated and compared with each other for the different working fluids. The energy transfer by heat input can be defined as the sum of the enthalpy change of the geothermal water between the inlet and exit of the heat exchanger and the heat input to the collectors from the sun. The comparison of total energy transfer by heat input when different working fluids are used is given in Fig. 2. Total energy transfer by heat input for the Isobutane case is found as kw and this


186 result is higher than the other working fluid cases according to this figure. Fig. 2: Total energy transfer by heat input to the integrated PTSC and ORC system according to different working fluid types Total exergy transfer by heat input is defined as the sum of the exergy entering to the system by the heat transfer from the sun (E x,solar) and flow exergy rate change of the geothermal water between the inlet and exit of the heat exchanger ( E x,hx ). The comparison of total exergy transfer by heat input for different working fluids is given in Fig. 3. Exergy transfer by heat input of isobutane, which gives the highest result, is found as kw as shown in this figure. The change of exergy contribution to the total exergy transfer rate from the geothermal water with the working fluid type depends on the thermophysical properties of the working fluid. As the specific heat of isobutane at the given pressure level is higher than the other fluids, it gives the highest total exergy transfer rate by heat input. Fig. 4: Net power output of the integrated PTSC and ORC system according to different working fluid types The electrical efficiency of the integrated system when different working fluids are used is shown in Fig. 5. The electrical efficiency of the system is the ratio between the net power output of the integrated system and total energy transfer by heat input as shown in Eq. (8). Using the results shown in Figs. 2 and 4, the electrical efficiency of the system for different organic fluids is calculated as shown in Fig. 5. This figure shows that the maximum and minimum electrical efficiencies are found as 11.64% and 6.16% for R134a and Isobutane cases, respectively. Fig. 3: Total exergy transfer by heat input to the integrated PTSC and ORC system according to different working fluid types The net power output of the integrated system when different organic fluids are used is given in Fig. 4. The maximum and minimum net power outputs are found as 5654 kw and 3016 kw for the R134a and R227ea, respectively. This result can be explained as follows. As the net power output of the system is the difference between the power output of the turbine, power input of the pump and fan, the highest net power output is found for the case when R134a is used as the working fluid, which can also be seen from this figure. The minimum enthalpy change of turbine inlet and turbine outlet is found as 20.8 kj/kg for R227ea. Due to this reason, the minimum power output of the turbine is found as 4347 kw for R227ea. Thus, the lowest net power output is found for this case when R227ea is used as the working fluid. 631 Fig. 5: Electrical efficiency of the integrated PTSC and ORC system according to different working fluid types. The results for the calculation of the exergetic efficiency of the integrated system for three different approaches are shown in Figs The maximum exergetic efficiency is found for the system operating with R134a for all the approaches. For this working fluid, exergetic efficiency of the integrated system is found as 31.77%, 25.59%, and 42.8%, for Approach-1, Approach-2, and Approach-3, respectively. This finding can be explained as follows. Total exergy transfer by heat input has two components: the change of flow exergy rate between the inlet and exit streams of the brine entering the heat exchanger and the exergy input from the solar side (depends on the different approaches). When different working fluids are used, the contribution from the solar does not change but that from the geothermal side changes. The change of flow exergy rate for the R134a is found to be the second highest (90.2 kj/kg). As the ratio of the net power output of the system to the total exergy transfer by heat input is higher for the system operating with R134a, R134a is determined to be the best option for this system according to the analysis. On the other hand, the


187 minimum exergetic efficiency is found for the system operating with Isobutane for the all approaches. Fig.6: Exergetic efficiency of the integrated PTSC and ORC system for the Approach-1 Fig. 7: Exergetic efficiency of the integrated PTSC and ORC system for the Approach-2. Fig. 8: Exergetic efficiency of the integrated PTSC and ORC system for the Approach-3. V. Conclusions In this study, the thermodynamic performance of a supercritical ORC combined with PTSC was presented. As a case study, an existing geothermal power plant based on a supercritical ORC was analysed using energy and exergy balances. Detailed thermal models of heat exchanger and PTSC were developed. The set of modeling equations were solved using Engineering Equation Solver (EES). The effect of different working fluids on the performance of the system was examined. The results of this study showed that using R134a as the working fluid yields higher performance for the integrated system than the other working fluid types for most of parametric studies conducted. For this reason, R134a is the most suitable working fluid for the integrated ORC and PTSC system studied in this paper. Nomenclature Aa References Aperture area, Ar Receiver area, m 2 Cmin Minimum heat capacity, kw/k Ecv Energy for control volume, kj E x,d Exergy destruction, kw E x Exergy kw ex f Specific flow exergy, kw/kg m Mass flow rate, kg/s FR Heat removal factor g Gravity, m/s 2 h Enthalpy, kj/kg NPTSC Number of collectors Q max Maximum heat transfer rate, kw S Heat absorbed by receiver, W/ m 2 s Entropy, kj/kg K T Temperature difference, K T Temperature, K t Time, s Ta Ambient temperature, K Solar collector overall heat loss coefficient, UL W/m 2 K W Power kw V Velocity, m/s z Elevation m Greek Letters ε Effectiveness, exergetic efficiency η Efficiency Subscript 0 Dead state c Cold cv Control volume el Electric h Hot hx Heat exchanger i Inlet j Boundary max Maximum min Minimum net Net o Out ORC Organic Rankine Cycle PTSC Parabolic Trough Solar Collector tf Thermal fluid Al-Sulaiman, F.A., Exergy Analysis of Parabolic Trough Solar Collectors Integrated with Combined Steam and Organic Rankine Cycles. Energy Conversion and Management 77: , (2014). DiPippo, R. Geothermal Power Plants: Principles, Applications, Case Studies and Environmental Impact. Third Ed. Butterworth-Heinemann, (2012). Duffie, J., and William B., Solar Engineering Of Thermal Processes, Wiley, (2013). 632
188 Geothermal Energy Link: htm (Last Access: April 15, 2016). Ghasemi, H., Sheu, E., Tizzanini, A., Paci, M., Mitsos, A., Hybrid Solar-Geothermal Power Generation: Optimal Retrofitting. Applied Energy 131: , (2014). Greenhut, A.D. Modeling and Analysis of Hybrid Geothermal-Solar Thermal Energy Conversion Systems, MSc. Thesis, Massachusetts Institute of Technology. (2010). Hepbasli, A., Ozgener L. Development of Geothermal Energy Utilization in Turkey: A Review. Renewable and Sustainable Energy Reviews 8(5): , (2004). Kakaç, S., Hongtan, L., Anchasa P., Heat Exchangers: Selection, Rating, and Thermal Design, Second Ed. CRC Press, (2002). Kalogirou, S., Solar Energy Engineering Processes and Systems. Elsevier Inc., (2009). Kerme, E.D., Orfi, J., Exergy-Based Thermodynamic Analysis Of Solar Driven Organic Rankine Cycle, Journal of Thermal Engineering 1(1): , (2015). Lazarov, V.D., Notton, G., Zarkov, Z., Bochev, I. Hybrid Power Systems with Renewable Energy Sources Types, Structures, Trends for Research and Development, In Int. Conf. ELMA2005, Sofia, Bulgaria, , (2005). Enerji ve Tabii Kaynaklar Bakanlığı Jeotermal Enerji Kullanım Alanları, Link: ari.aspx. (Last Accessed: April 15, 2016). US DOE Report "$20 M to Integrate Concentrated Solar Power with Fossil Fuel Plants., (2012). CSP-World. Link: /us-doe-announces-20-m-integrate-concentrated-sol ar-power-fossil-fuels-plants (Last Accessed: April 15, 2016). Zarrouk, S.J., Hyungsul M., Efficiency of Geothermal Power Plants: A Worldwide Review. Geothermics 51: , (2014). Zhou, C., Elham D., Behdad M. An in-depth Assessment of Hybrid Solar-Geothermal Power Generation, Energy Conversion and Management 74: , (2013). 633
189 FUELS AND COMBUSTION TECHNOLOGY 634

190 5MW Hybrid Power Generation in ORC Unit from Co-Incineration of Agricultural, Forestry Biomass Waste and Biogas in Stoker and Through Parabolic Solar Panel (CSP) Yildirim Ismail Tosun 1* 1 Sirnak University, Faculty of Engineering, Department of Mining Engineering, Sirnak, Turkey * [email protected] Abstract In stoker boiler, where the average concentration of solids amounts to t/m 3, i.e. the conditions for residence time are long enough for the thermal combustion of waste and coal and extensive gas mixing with 70-80% excess air so enhancing biomass combustion and heat transfers to the boilers. It is necessary to create conditions of internal circulation without the transported coal and waste in stoker thermal oil boiler, 90-95% combustion yield were observed at the end of combustion. Total heat values of biowastes were of approximately 17.8 kj/ kg for corn stalk and 16.2 kj/ kg for forest wood waste for hybrid ORC power generation. There are various objectives to make the necessary arrangements to increase the use of biomass and solar energy as the other device. Considering the known biomass area of the potential high forest fields in northern Anatolia and located in central and eastern Anatolia it is seen as having low to medium heat resources. As we have seen in our country there is a significant potential for biomass resources will be invested. The 5MW hybrid ORC electricity production for low heat sources with parabolic solar dish CSP will be great source for waste heat and in comparison the electricity production may reach on % thermal performances by co generation. Keywords: ORC, biomass, solar panel station, co-electricity production, CSP; biomass I. Introduction The almost 211TWh total electricity in 2011, Turkey were produced primarily from imported natural gas and domestic coal (TKİ, 2009, TTK, 2009). The total amount of asphaltite resource in reserves and production in Şırnak City are over 82 million tons of available asphaltite reserve and 400 thousand tons per year, respectively (MTA, 1987). The most effective and cost-effective technologies are needed for clean coal products in today's modern technologies (Bell et al, 2011, Shadle et al, 2001, Sharma et al, 2008, Jess et al, 2009, Kajitani et al, 2006). Turkish coal industry needs noble gasification technologies and high gasification performances at lower cost with various types of local sources regarding researches on high capacity biomass of cellulosic wastes. Processing technologies using biomass should be under contribution to the fuel side (Anonymous, 2009, Karakaya, 2008, TAM 2009,TSI 2009). On the nature and characteristics of the medium as base lignite are distinctly determined. In the view producing high value cleaned products, pyrolysis and gasification of lignite are managed for this purpose. liquid and gaseous coal fuels (Çakal et al, 2007). However, raw materials and chemical nature of them requires a variety of adaptation methods. For this purpose, universities and industry needing to work together to provide the basic information required in pilot scale. Thus, the higher performance can be achieved by a certain mixture of solid fuel additives. A preferable advanced design in pyrolysis could produce clean coal fuels in the local site of the country so significant that needs to obtain the highest quality coal fuels. Fig. 1: Primary Energy Production in Turkey, Natural Gas, Coal Biomass II. Agricultural Biomass Waste Potential of Turkey Depending on advanced technological developments in energy production the low quality coals needed the most economical technologies and even in order to make it possible to produce coal-derived products (IEA, 2007, IEA 2012). Compliance with environmental norms of coal pyrolysis or gasification of various types of coals, feasible combustion systems and energy production facilities are needed in today's modern technology, also enable the production of 635 In Turkey, the Ministry of Agriculture and Rural Affairs declared the statistics that the amount of waste generated from annual and perennial crops received from local authorities; the amount of production and acreage of each product is calculated using the data for In our country, agricultural production waste is commonly left in the field. Cereal straw is used for various purposes, for example, used as animal feed, animal litter (Akpınar and Şen,1987).

191 The main waste from the production of agricultural products, industrial plantations is allowed to rest. These kinds of waste cotton stalks, corn stalks, sunflower stalks, hay and tobacco stalks are waste, etc. Total amount of waste products are divided into theoretical and actual values given in the Table 1 (TSI, 2013, TAM, 2014). The total annual production of field crops in Turkey and waste quantities are given in Table 2. Tab. 1: Total amount of Municipal waste products are divided into theoretical and actual values in Turkey in Waste Type Waste Statistics Heat Value,kJ/kg Theoretical, million ton/year Actual, ton/year Plastic ,6 0,3 Cardboard ,4 1,6 Animal Waste Total ,9 Total heat value of approximately 16,8 kj/kg for corn stalk and 20,2 kj/kg for peanut shell waste. According to the total thermal value, basic products are corn 33.4%, wheat 27.6 % and cotton 16.1 %, respectively. In Table 1, the total annual production of horticultural crops waste in Turkey and is given. Its total thermal value is approximately 21,5 kj/kg, respectively. Within the total calorific value of the product with the biggest 56.3% nut shell and olive seed 25.2%. According to the number of animals in Şırnak, the calorific value of the amount of waste and animal waste are as given in Table 2, about 13, 30 and 26,5 million in Turkey for cows, sheep and poultry, and approximately the amount of annual waste capacity are 0.2, 0.1, million tons, respectively. The total annual amount of forest, bush and wood waste, are 6, 0.6 and 0.49 million tones, respectively. The total available 65 % solids content of 3% and 99% values were determined by the availability of forest, bush and wood waste, respectively (TEFM 2007,TEFM 2008). Thus, Şırnak's cows, sheep and poultry waste calorific value of the annual total was found to be of about 48, were 3 and 0.7 MJ, respectively. Tab. 2: The total annual production of field crops waste in Şırnak and waste quantities. Waste Type Waste Statistics Heat Value,kJ/kg Theoretical, 1000ton/year Actual, ton/year Plastic ,1 1,3 Cardboard ,4 1,6 Cow, SheepWaste Forest Waste Total resources and electric power for heating may comprise separate but integrated objectives. These policies and laws only for biomass separate, but can also include an integrated target. All use of renewable sources in the EU target of achieving 12% market share for the biomass should be increased up to 300%. The country, the purpose specified deviation from the guarantees to domestic objectives including, biologically-based fuels, specific to a year, used in transport petrol and diesel fuel market, a certain share to have a target for determining the policies or laws should be removed. Regard to the energy in Turkey appropriate potential market instruments include: biomass -generated electricity, heating and / or used in transport fuels, tax reductions or exemptions, flexible loans, low interest loans, loan guarantees, property first operating subsidies and / or grants and related service for consumers willing to use discounts as well as other financial support mechanisms. A potential market instrument of state support is not required to continue forever. They just won and sustaining investor confidence during development and may be important. III. Combustion Biomass, biowaste, Oil and Coal in Fluidized Bed Considerable research on coal combustion has been conducted over the years, but the waste combustion results are widely dispersed because of the complex chemistry of waste (Bell et al, 2011, Anonymous a,b,c, 2015, Kajitani et al, 2011). Time related coal combustion modeling assumes basically first-order kinetic equations, or less sensitive for heating rate (Anonymous d,e,f, g, 2015). It is basically depend on the coal properties but also cover to some extent, the effect of heat-and-mass transfer phenomena. Fluidized bed combustion is preferred for clean emissions in the unit (Karakaya, 2011, Cherubuni et al, 2011) Pyrolysis and gasification provided much clean beneficiation from coal, wastes and biomass (Kreith and Tchobanoglous, G 2002, Wiktorson, 2000, Wei-Biao et al, 2001, Liu et al, 2002, Kreith and Tchobanoglous, 2002). As seen in Fig 2 the coal and bimass waste is fed into the combustion system as sludge, but evaporation heat is lost as heat in the boiler. This situation of renewable energy sources in order to better compete and market additional policy tools need to emphasize that EU energy policy and law by examining the conclusions drawn from Turkey according to the potential policy instruments include: the country, the purpose specified deviation from the guarantees to domestic targets, including renewable energy sources, given up to one year, domestic gross energy consumption a certain share have to target (about 10%) should be determining policy and legislation. These are obtained from renewable 636 Fig. 2: Fluidized Bed Reaction of Coal and Biomass for combustion


192 IV. Project Work This project approach assumes basically that the process itself, with all specific features, is a decisive factor for the path of the reactions of biomass combustion. Therefore a stoker model of boiler was used in combustion and coal at 10% weight rate was used. Tab. 3: The proximate analysis of the combustible biowastes Weight(%) Wood Waste Trash Cow Waste Poultry Waste Corn Waste Moisture Ash Fixed Carbon Volatile Matter Calorific Value (kcal/kg) This study examined the animal waste types of Southeastern Anatolian region, Şırnak, Siirt Hakkari and Batman. The representative samples were taken from local areas (Tab 4). According to the proposed project studies over coal and municipal waste, it is calculated that at almost 40% thermic performance could be received in the site and oil collected at average near 2,7m3/ton for coal and municipal waste. Coal and municipal waste may reach to m3/yr. Biomass production potential in Şırnak City and close local area is almost 5% of the oil produced from municipal waste. Hence optimized resource usage in co-combustion in optimized boilers can just be managed by high heatoil boiler ORC plant. At projected capacity at tons of coal and municipal waste per year can manage proposed 35MW electricity yield and can produce almost equivalent 50 million kwh/yr electricity. However, all the gaseous products are coburned in internal combusting generator converting thermal heat. As shown in Fig 4 the biomass and biogas and integrated CSP installation were projected for 5 MW power generations in ORC cycle by ammonia/water liguid in a parallel hybrid system. The gas and oil combustion yields for lignite and coal, the biomass resources in stoker should be processed for toxic contents prior to combustion and regarding vapour yield of coal. 10mm Şırnak Municipal Waste, Biomass 5 mm Cow Waste mm Poultry Waste 5 mm Poultry Waste mm Maize Slush 5 mm Maize Slush Tab. 4: The total annual production of animal waste in Şırnak and waste quantities. Waste Type Waste Statistics Heat Value,kJ/kg Theoretical, 1000ton/year Actual, ton/year Cow ,4 12,3 Sheep ,3 1,6 Poultry ,7 0,4 Total ,4 13,3 V. Results and Discussion A stoker bed reactor was used in coal combustion heated till 600 o C with a rate 7-10 o C/min. The process was tested at a scale of 2 3 kg/h; collecting operational and design data to build an industrial installation. Thermal combustion almost observed at temperature above from 350 C to 400 C with a combustion rate of 60-70%/dk at 10mm size and with simultaneous combustion of oil products by in chamber, where the average concentration of solids amounts to ton/m 3, i.e. the conditions for residence time are long enough for the complete thermal combustion of coal and the biowastes with extensive air mixing so enhancing heat transfers. The TGA weight reduction in combustion was determined for the different type of biowastes as shown in Fig 3. Fig. 3: The combustion rates of Biowastes used in stoker combustion process at 900 o C. The proposed enthalpy yields of power generation in moving grate boiler system changed versus regarding combustion temperature is shown below in Fig 4. V.1. Hybrid Power Genaration in ORC Unit 637 Fig. 4: Integrated CSP and mobile Biowaste and biogas combustion units and ORC power generation

193 Laboratory scale fluidized bed installation of coal for gasification was made simply. Porous sand bottom layer was boiled with fine coal with burned pyrolysis oil of biowaste at 0,2 m/s. In order to achieve this, it is necessary to create gaseous conditions of internal circulation without the transported coal and char in the fluidized bed, where the average concentration of solids amounts to m 3 /m 3, i.e. the conditions for residence time are long enough for the thermal decomposition of coal and intensive gas mixing so enhancing mass and heat transfers. Thermal gasification commenced by fuel burning into the fine coal firstly and then CO2 gas evolution followed and circulated into the fluidized bed for three minutes. When it is observed a temperature increase from 100 to 300 C without fuel addition, injected steam at a volume rate of 1,2/1 and air with 1,2lt/min. Gaseous products with simultaneous dilution of oil products by condenser distillate are collected. To achieve this, it is necessary to create conditions of internal circulation without the transported coal and char in heap, 50-60% conversion yield recoveries were observed at the end of gasification. tar/m 3 and 5 10 g /m 3 of benzene, toluene, xylene in unit process gas. Moreover, Figure 5 showed that oil yields was slightly lower than coal char yields 27% weight. Gas yield was containing mainly steam and CO2 in the pyrolizer and the amount of gas was remained between 37 and 40%. Heap gasification tests were carried out for Turkish lignite and Şırnak asphaltite in 30mm size distribution and optimized gas inlet of 3lt/min.kg coal. Char yields of Şırnak asphaltite across to temperature were shown from Figure 6 and even other lignites showed similar trend, the higher char yields at lower gasification temperatures. It is illustrated that higher carbonaceous content to be converted to gas in gasification was managed over 750 o C till 900 o C. That conversion rate remained among 38-56%. Even it was observed that increased the gas's calorific-value by kj and, in total, allow one to obtain a gas of calorific value of up to approximately 5700 kj/m 3 for Şırnak asphaltite. Therefore it was supposed that porous coal layers, especially porous alkali and catalysts exhibit sufficient gas permeability at least for the gases of chemically inactive and sufficiently small in particle size. In the pyrolysis experiments with addition hydrated lime, reactor temperature changed between 400 o C and 650 o C and lignite samples mixed only by %10 lime. Products received from pyrolysis of coal specimens were subjected to analysis for sulfur holdup determination. Test results of pyrolysis by lime and other alkali at 600 o C are seen in Figure 1. From the point of view of gasification experimentation, the resulted chars quality and quantity in the pyrolysis chambers for biomass, lignite and coal samples were determined for different source evaluation and so we may reduce the effect of ash content of coal samples in order to optimize pyrolysis a gasification rates of lignite samples. As given in Figure 3 gas and oil yields for lignite and coal samples were slightly similar, oil yield was lower for coal. In the gasification experiments with different particle size fractions of coal specimens, at reactor temperature changed to 600 o C and lignite samples mixed only by lime at 10% weight rate. Products gasification of coal specimens were subjected to analysis for yield determination. Test results of gasification of Turkish lignite are seen in Figure 4. Comparison of particle size at 3-10mm additions at equal rates into the pyrolysis chamber with finer lignite showed that Gediz lignite was showed higher oil yield at near 26 % weight rate. In the gasification experiments, the experimental condition is calculated on the basis of the gas composition in the ambient state. So neither the contained water vapour nor the condensing hydrocarbons are taken into account. However, these components increased by decrease the particle size to 100 micron and oil yield was remained low 12% weight. Those values provided advantageous higher carbonaceous content to be converted to gas in gasification stage. Pyrolysis liquid and gaseous products of Sırnak asphaltite may equal to 5 20 g 638 Fig. 5: Effect of Combustion Temperature over Thermal Oil Enthalpy Performances in Boiler used Biowaste with Coal. VI. Conclusions In order to reduce the risk of investment projects of the public sector will need to develop appropriate financial support. Suggested potential market instruments included: better utilization of agricultural by-products, which support financial incentives ( eg direct grants, loans and /or subsidies) ; trash the place of agricultural wastes or agricultural waste to be stored in an environmentally friendly way using non- aversive environmental taxes and penalties; electricity produced from biomass sources, heat and / or taxation of biofuels tax exemptions or reduction in the level of recognition; private loans, subsidies first run facility and / or allowances as financial support mechanisms related to energy investments. Suitable for utilization of agricultural waste in the implementation of policies formulated and the role of government is very important. Recommend specific policies and regulations, while the inter-ministerial (agriculture, energy and environment ministries of) the development of coordination and cooperation on these issues and it is also important to ensure efficiency and effectiveness. An important
194 achievement in policy and practice to achieve results, can provide the necessary funds to mobilize private sector has the capacity development of biomass and other renewable energy sources should be encouraged participation. According to the total thermal value, basic products are 33.4% for corn, wheat and cotton 16.1% and 27.6%, respectively. In Table 1, the total annual production of horticultural crops was in Turkey and is given. Its total thermal value is approximately 21.5 kj / kg, respectively. Within the total calorific value of the product with the biggest nut shells and olive seed 56.3% 25.2%. According to the number of animals in Şırnak City Province, the calorific value of the amount of waste and animal waste should be investigated, which is about 13, 30 and 26.5 million in Turkey for cows, sheep and poultry, and approximately in Şırnak City Province these amounts of annual waste capacity are 29, 11, 8 thousand tons, respectively. The total annual amount of forest, bush and wood waste, are 6, 0.6 and 0.49 million tones, respectively. The total actual content of of forest, bush and wood waste are 65%, 3% and 99% as determined by the availability, respectively Benefaction from Şırnak biomass and asphaltites in the mid heat steam generation and low heat pentane ORC generation, many parameters may raise entalpy combustion efficiency in the parallel or serial hybrid systems. In order to receive clean energy from clean combustion gaseous products must be provided in power generated with low heat steam. It is also advised that the high amount of enthalpy receive of combustion will be managed at high combustion temperatures over 900 o C and emissions were more environmental friendly gaseous out puts. Stoker combustion carried out for Şırnak biomass waste and asphaltite below 10mm size distribution showed sufficient combustion yields of 98% and 91% from biomass and the Şırnak asphaltite, respectively between to o C and even other biomass sources showed similar trend, the higher combustion rates of %/min at lower combustion temperatures. In the research works production of clean energy with the design of the addition of high-quality coal biomass waste mixtures are processed and biomass fuels could be an alternative clean fuel sources. Clean energy sources may be supplied in South East Anatolian region in Turkey. Hence, those clean energy production from other renewable alternative resources will further enhance the industrial development in the region. The calorific value of Şırnak asphaltite was significant for combustion. Furthermore, the results exhibited the higher combustion yields in using biogas at the gas inlet 3lt/min.kg coal with the combustion stoker. rates of combustion of different types of biowaste could be obtained from the tests using low flow biogas inlet at 500 o C. It has been clearly determined that CH4 and biogas were much beneficial in gasification of different types of biowaste. Benefaction from biowaste, in order to receive clean energy clean gaseous products must be generated in low temperature combustion. It is also advised that the high amount of formation of flue gas will be managed high combustion temperatures over 700 o C and extracts more environmental friendly gaseous products. Biomass combustion carried out in 30mm size distribution showed sufficient enthalpy yields from corn biowaste between to o C and even other biowastes showed similar trend, the higher enthalpy yields of % at lower combustion temperatures. Today in Şırnak, including biomass in terms of research and development in renewable energy incentive programs are pretty much. In recent times the output of the power of free market laws before energy prices, energy-producing companies buy the energy of the states were determined through interviews. Now renewable energy prices will be forced to comply with market conditions. In the research works production of clean energy with the design of the addition of high-quality coal and biowaste mixtures are processed and biomass fuels could be an alternative clean fuel sources. Clean energy sources may be supplied in South East Anatolian region in Turkey. Hence, those clean alternative resources will further enhance the industrial development in the region. References Akpınar, N, Şen, M,1987, Kentsel katı atıklardan enerji üretimi, Enerji Enstitüsü Anonymous a, 2015, Mobile incinerators, ATİ Şirketi Anonymous b, 2015, Yakma Kazanları, Alfa Kazan ve Makine AŞ,Ankara Anonymous c, 2015, Kalina Cycle, enerji.com.tr, İmparator Enerji, GeoPower, İstanbul Anonymous d, 2015, Akışkan Yataklı Yakma Kazanı, Mimsan A.Ş., İstanbul Anonymous e, 2015, Anonymous f, 2015, Combustion of different types of biowaste was successfully processed in terms of combustion rate and even combustion of volatile matter. At higher 639 Anonymous g, 2015, systems/ mobile_systems.htm
195 Bell D.A. Towler B.F., Fan M., 2011, Coal Gasification and Applications, ISBN: , Elsevier Inc., Oxford Cherubini, F. Bargigli, S. Ulgiati, S. 2009, Life cycle assessment (LCA) of waste management strategies: landfilling, sorting plant and incineration, Energy, 34, pp Çakal, G.Ö. H. Yücel, A.G. Gürüz, 2007, Physical and chemical properties of selected Turkish lignites and their pyrolysis and gasification rates determined by thermogravimetric analysis, Journal of Analytical and Applied Pyrolysis, Volume 80, Issue 1, Donskoi, E.& McElwain, D.L.S., 1999, Approximate modelling of coal pyrolysis, Fuel, 78, pp IEA, 2007, IEA Coal Research Ltd, Clean Coal Technology Report, ( A.J. Minchener and J.T. McMullan) IEA, 2012, World Energy Outlook Jess A, Andresen A-K. Influence of mass transfer on thermogravimetric analysis of combustion and gasification reactivity of coke. Fuel.; doi: /j.fuel Kajitani S, Suzuki N, Ashizawa M, et al. CO2 gasification rate analysis of coal char in entrained flow coal gasifier. Fuel. 2006;85: Kajitani S, Suzuki N, Ashizawa M, et al. CO2 gasification rate analysis of coal char in entrained flow coal gasifier. Fuel. 2006;85: Karakaya, İ.,2008, İstanbul için stratejik kentsel katı atık Yönetimi yaklaşımı, Yüksek LisansTezi, İTÜ FBE Çevre Müh.Böl. Kreith, F and Tchobanoglous, G 2002, Handbook of Solid Waste Management Lentsch D, Schubert A,, 2013 "Risk Assesmment for Geothermal Wells- A probabilistic Approach to Time and Cost Estimation CRC Transactions, Vol 37, p Lin C.T. and Lee, C.S.G., 1996 Neural Fuzzy Systems: A Neuro-Fuzzy Synergism to Intelligent Systems, Prentice Hall Liu, C., 1997 Intelligent system applications to power systems, IEEE Computer Applications in Power, Vol.10, No.4, pp , October. Liu, G., Benyon, P., Benfell, K.E., Bryant, G.W., Tate, A.G., Boyd R.K., 2002, The porous structure of bituminous coal chars and its influence on combustion and gasification under chemically-controlled conditions, Fuel, 79, pp system based on biomass gasifier, ECRES2015, Antalya Richard A. Denison, John Ruston, 1990, Recycling and Incineration: Evaluating the Choices Ron Isaacson, 1990, Methane from Community Wastes (Elsevier Applied Biotechnology Series) Schora F.B., 1967, Fuel Gasification, 152 nd Meeting of American Chemical Society, New York Schurtz R, Fletcher TH. Pyrolysis and gasification of a sub-bituminous coal at high heating rates, 26th Annual Int Pittsburgh Coal Conf, Sept , Shadle LJ, Monazam ER, Swanson ML. Coal gasification in a transport reactor. Ind Eng Chem Res. 2001;40: Sharma A, Saito I, Takanohashi T. Catalytic steam gasification reactivity of hypercoals produced from different rank of coals at o C. Energy & Fuels. 2008;22: TAM, 2014,Tarım ve Köy İşleri Bakanlığı İstatistikleri, TEFM, 2008, Orman biyokütlesinden yakıt ve enerji üretimi, (Kahveci, O) TC. Çevre ve Orman Bakanlığı Orman genel müdürlüğü TEFM, 2009, Orman Genel Müdürlüğü nde Biyoenerji Konusunda Yapılan Çalışmalar, Orman Genel Müdürlüğü, Biyoenerji Çalışma Grubu, Orman ve Enerji, Ankara, TKI, 2009, The Turkish Ministry of Energy, Energy, Dept., Lignite Coal Report Tosun YI, 2012, Semi-fused Salt-Caustic Mixture Leaching of Turkish Lignites - Sorel Cement Use for Desulfurization, Proeedings of XIIIth International Mieral Processing Symposium, Bodrum, Turkey. TSI,2014, Türkiye İstatistik Kurumu Verileri, 2014, TTK, 2009, The Turkish Ministry of Energy, Energy, Dept., Hard Coal Report Wei-Biao F., Quing-Hua, W. 2001, A general relationship between the kinetic parameters for the gasification of coal chars with CO2 and coal type, Fuel Processing Technology, 72, pp Wiktorsson L.P., W. Wanzl, 2000, Kinetic parameters for coal pyrolysis at low and high heating rates a comparison of data from different laboratory equipment, Fuel, 79, pp Mahmoudi, S.. Gholamian, E. Zare V, 2015, Exergy analysis of a new configuration of trigeneration 640
, 5019 Kairouan Street, University of Monastir, Tunisia * Email: Soumaya.hadj.salah@hotmail.")
196 Optimization Methods of Radiative Transfer Calculation Applied to a Cylindrical Sodium Vapor Plasma Soumaya Hadj Salah* 1 1 Research Unit of Ionized Backgrounds and Reagents Studies (UEMIR), Preparatory Institute for Engineering Studies of Monastir (IPEIM), 5019 Kairouan Street, University of Monastir, Tunisia * [email protected] Abstract An optimization method based on a physical analysis of the temperature profile and different terms in the radiative transfer equation is developed to reduce the time computation of the net emission. This method has been applied for the cylindrical discharge in sodium vapor. Numerical results show a relative error of spectral flux density values lower than 5% with an exact solution, whereas the computation time is about 10 orders of magnitude less. This method is followed by a spectral method based on the rearrangement of the lines profile. Results are shown for Lorentzien profile and they demonstrated a relative error lower than 10% with the reference method and gain in computation time about 20 orders of magnitude. Keywords: optimization method, radiative transfer, flux density I. Introduction Discharge lamps have greatly improved since their emergence. Indeed, the physical phenomena that generate radiation (Church, 1974) in discharge lamps have been well known for decades. But the calculation of the net emission, which is a recurrent step in the research and development of this type of bulbs, is an obstacle to the evolution of research regarding its heavy demand in numerical computation times. isotherms which corresponds to points Si. On each d i = d i+1 d i, the temperature is assumed to be constant. So, we can calculate the emission and absorption coefficients in advance. Thus, we store all the values d ij according to the different directions j in a matrix and all the values of T i, i and ki in vectors. Therefore, the spectral radiative flux can be written as follows:. Indeed, the variables of the equation for radiative transfer depend on spectral and geometric (directional, spatial) variables. For this reason, two algorithms, independent of each other, are used for the resolution: -The first is used to solve the radiation problem geometrically. - The second allows its resolution on the whole or a portion of the spectrum. Our goal is to achieve an optimization method of numerical calculation which better conciles between accuracy and computation time. So, we have developed a geometrical optimization method based on a discretization of the cylindrical temperature profile and a spectral method based on the rearrangement of the lines profile. II. The developed geometric methods II.1. Principle of the method Before calculating the integrals, we made a cylindrical mesh of temperature profile. We subdivide the profile section in isothermal circles. And for each direction which makes an angle with the horizontal, we calculate the intersection of with the Fig. 1: Discretization of the cylindrical temperature profile with F ν (P) n m = 4 ε ν (i) G(τ ij ) cos φ j j=1 i=1 G(τ ij ) = ε ν (i) = L ν 0 (i) K ν (i) π/2 θ=0 d ij (1) sin θ exp ( τ ij sin θ ) dθ i τ ij = K ν (p) d pj p=1 641
197 II.2. Results and discussions To validate our optimization model, a comparison with the results of Lowke is carried out. This comparison is performed under the conditions given by the following table: On the other hand, its gain in computation time is 5 times lower. a) x 105 Lowke Optimized method Table 1: Sets of data relative to the sodium resonant D lines. 0=5890 A 0=5896 A Profile radius (cm) Pressure (torr) Oscillator strength f Flux density, watts m The used temperature profile is given by figure b) r/r Temperature ( K) Rs/R Fig. 2: Temperature profile If we trace the density of the radiative flux in these conditions, we obtain Figure 3. Figure 3 clearly shows that the relative error between the result of the optimization method and the Lowke results for the radiative flux density is lower than 5%. The calculation is performed using the numerical calculation software MATLAB on a 32 bit computer. The results show a gain of time equal to 10 orders of magnitude. If we compare our results with those of the F.Simont, we can notice, on the one hand that, its relations are much more complicated and are only valid for some values of the absorption coefficient. And they require the introduction of multiple parameters as they are determined in a semi-empirical way. This makes the implementation of his model, more difficult than ours. Fig. 3: Radiative flux density in a cylindrical discharge profile of sodium vapor and comparison with Lowke results III. The developed spectral methods III.1. Principle of the method The final shape of the spectral radiative flux density shows that the calculation should be performed on a frequency interval with a very low step especially at the large flux variations. This shape is the image of the Lorentzian profile by the function f which is given by: π S max (φ) π 2 f(p(ν, T)) = 4 ε ν (P(ν, s)) exp ( 1 sin θ υ=0 θ=0 φ=0 s=0 s K ν(p(ν, y))dy y=0 ) ds sin θ cos φ dφ dθ dν (2 ) Where K ν (P(ν, T)) = λ 0 2 8π g u g l A ul n l (T)P(ν, T) ε ν (P(ν, T)) = h c A 4π λ ul n u (T)P(ν, T) 0 P(ν, T) = 1 Δν 2π (ν ν 0 ) 2 + ( Δν n i (T) = n 2 )2 g i U(T) exp ( E i k b T ) 642 n = P k b T U(T) = g i exp ( i E i k b T ) So, the idea is to rearrange the shape of the Lorentzian profile to obtain a simpler spectral flux density curve. And then, it can be traced with a minimum of points, which is equivalent to an optimization of the flux calculation in the frequency interval.
198 III.2. Results and discussions The study is conducted on a profile of two sodium lines whose wavelengths and all related data to calculations are presented in the following table (Ben Ahmed, 2005): Tab 2: Data for important Na transitions used for the calculation of the spectral power 0 (nm) gl gu El (ev) Eu(ev) Aul (108 s-1) The partition function of sodium is given by (Ben Ahmed, 2011): U(T) = A + B T C ( T 1000 )2 + D ( T 1000 )3 (3) Where A= ; B= x 10-3 ; C= x 10-3 ; D= x 10-3 We assume that each of the lines has a Lorentzian profile with the equation: P() 14 x (m) x 10-7 Fig. 5: Rearrangement of Lorentzian profile of a line This procedure is repeated for each line. Then, we start the calculation. To validate this method, a comparison by using the exact calculation results, was performed for the calculation of the total flux density and the net emission. For the total flux density, we obtain the results indicated on figure 6. = 1 2π P(ν, T) Δν (ν ν 0 ) 2 + ( Δν 2 ) 2 (4) x 105 Optimized Method Reference Method Where the length at half-height is equal [5] -For the resonance lines Δν = n -For other lines Δν = (λ 0 2π )3 A ul n n: the number density of atoms in the ground state. With n = P k b T The Lorentzian profile for the line wavelength 0 (nm) = , is given on figure x 109 Flux Density, watts m r/r Fig. 6: Radiative flux density in a cylindrical discharge profile of sodium vapor If we trace the curve of the relative error of this optimized method with respect to the exact total flux density calculations, we obtain figure 7. 6 P() Relative error (%) (m) x 10-7 Fig. 4: Lorentzian profile of a line A rearrangement of this profile gives the virtual profile of figure r/r Fig. 7: Relative error of the radiative flux density in a cylindrical discharge profile of sodium vapor with the results of the reference method
199 Figure 8 shows the calculation of the net emission whereas the relative error of this optimized method with respect to the exact calculation of net emission, is shown by figure 9. Net emission, watts m x r/r Fig. 8: Net emission in a cylindrical discharge profile of sodium Reference Method Optimized Method Lorentzian profile to obtain a spectral density flux easier to determine with the minimum number of points. Thus, the association of the spectral method with the geometric optimization method gives us a result with a relative error of 10% compared to the reference method and a gain of time equal to 20 orders of magnitude. References Church, C. H., Schlecht, R. G., Liberman, I. and Swanson, B. W., AIAA, 1966, 4, J. Quant. Spectrosc. Radiat. Transfer. Vol. 9. pp Pergamon Press J. Quant. Spectrosc. Radiat. Transfer. Vol. 61. No. 2. pp , R. Ben Ahmed, S. Kazziz, L. Troudi, K. Charrada, H. Helali, G. Zissis, and R. Said, Phys. Plasmas 12, (2005). R. Ben Ahmed, Z. Araoud, and K. Charrada, Phys. Plasmas 18, (2011). Relative error (%) r/r Fig. 9: Relative error of the net emission in a cylindrical discharge profile of sodium vapour with the results of the reference method The last figure clearly shows that the relative error between the result of the spectral optimized method associated with the geometrical optimization, and the result of the reference method for the radiative flux density is lower than 10%. The results reveal a gain of time equal to 20 orders of magnitude. IV. Conclusions The calculation of the radiative flux density is carried out through five integrals. The exact calculation of this amount requires a heavy numerical calculation time. So, we presented a new method of geometrical optimization which allows an acceleration of the calculation procedure. This method is based on a discretization of the cylindrical profile of temperature, which allows to calculate the absorption and emission coefficients. The comparison of numerical results with those of Lowke shows a gain of time equal to 10 orders of magnitude with a relative error lower than 5%. We have developed also a spectral optimization method based on the rearrangement of the 644
200 Waste to Energy with a Combine Membrane Technology: Biobutanol Production and Purification Filiz Ugur Nigiz 1*, Nilufer Durmaz Hilmioglu 1 1 Kocaeli University, Engineering Faculty, Department of Chemical Engineering, Kocaeli, 41380, TURKEY * [email protected] Abstract Biobutanol is an alternative biofuel produced from a wide range of biosource. The biggest obstacle in the development of this technology is production processes consumed huge energy in separation stage. Hence, academic research focused on determining more efficient and economical biobutanol purification technique. Membrane based production and purification systems serve as alternative hybrid method to produce high purity butanol from waste. When fermentation occurs in fermenter, butanol is selectively removed from broth. In order to enhance the purity of butanol, number of membrane separation unit can be increased. In this study, a hybrid hydrophobic-hydrophilic biobutanol production-purification system was designed and purification experiments were performed at different conditions. In the first stage, poly(dimethyl siloxane) was employed inside a membrane bioreactor and butanol was selectively removed from model solution (included 1-4 wt. butanol) at different temperatures. At the end of the seven hours, 4 wt. % fermentation solution was concentrated to 80 wt % butanol with kg/m 2.h flux at 50 ºC temperature. In the second stage, butanol was purified from 80 wt. % to 93 wt. % with 0.87 kg/m 2.h flux by means of 3A loaded poly(vinylalcohol) membrane within seven hours. Effects of temperature, feed concentration and zeolite loading were investigated as function of flux and separation factor. Keywords: Biobutanol production, butanol purification I. Introduction Increasing fuel demand, depletion of fossil fuel source and government regulations on environmental aspect have motivated the researchers to investigate more efficient bio-based fuel such as biodiesel, bio-ethanol and bio-butanol (Tashiro et al. 2010; Erica et al. 2012). Among them, bio-ethanol becomes an attractive fuel owing to the non-hazardous and easy processability properties. Same as the bio-ethanol, fuel butanol reduces the toxic gas emission that causes a reduction in atmosphere quality. Combustion of this bio based fuels release fewer greenhouse gases. Bio-butanol can be produced by anaerobic fermentation with a broad range of feedstock from agricultural waste to crop. Compared to bioethanol it has high calorific value, higher vapor pressure and low water miscibility. Although the energy density is lower than gasoline, it reduces carbon emissions approximately 85 percentage (He at al. 2010; Durre et al. 2007; Kaminski et al. 2011; Amrita et al. 2012). It is used either fuel additive or blending with petroleum based fuel such as gasoline and diesel in any concentration. It does not need any engine modification when used in automobile (Tashiro et al. 2010). Researchers have claimed that the bio-butanol has a potential to substitute for both ethanol and bio-diesel in the biofuel market by 2020 (Edward, 2011). However, production and purification process more complicated due to the final concentration of compounds. Anaerobic fermentation in which Clostridium type microorganism used is a traditional technique for butanol and it is called as acetone-butanol-ethanol (ABE) fermentation. In the traditional batch system, fermenrtation stops when the concentration of butanol reachs 1-3 wt. % (Chaeyoung et al. 2015). Afterward advanced dehydration technique is required to obtain anhydrous butanol. Moreover, butanol shows toxic effect on bacteria and should be simultaneously removed from broth by in-situ techniques for preserving biological activity. In literature, there are few methods for in-situ removal and continuous biobutanol production such as solvent extraction, adsorption, gas-stripping, perstraction, reverse osmosis and membrane based separation (Chaeyoung et al. 2015, Heitmann et al. 2013). Membrane based production and separation systems have been preferred to obtain pure product in fermentation systems. Recently, some of applied and theoretical studies have been performed by using membrane based process such as membrane bioreactor and pervaporation (PV) (Chaeyoung et al. 2015, Joanna et al. 2012, Taghreed et al. 2015, Liu et al, 2011; Sampa et al. 2012). Pervaporation is a non-porous membrane separation process that is driven by chemical potential gradient. Due to the selective separation capability of PV, separation occurs according to the membrane-solvent interaction. Additionally, diffusivity, solubility and vapor pressures of components play critical role in PV. Membrane is the main constituent of pervaporation. It is mostly considered a proper method to separate a small amount of solvent (Nigiz et al. 2015). Polarities 645
201 of components determine the type of membrane that should be used in PV system. Indeed, there are two types of PV system used in biofuel facilities as utility process commercially. Hydrophobic PV system is used for direct separation of butanol from ABE solution by means of a non-porous hydrophobic membrane such as poly(ether block amide) (PEBA), poly(dimethyl siloxane) (PDMS), Poly(vinylidene fluoride) (PVDF), (Heitmann et al. 2013, Taghreed et al. 2015). Hydrophilic PV unit dehydrates the fermentation broth by removing of the water. Due to the small amount of butanol (maximum 1-5 wt. %) in bulk solution, hydrophobic PV seems more feasible. However, broth solution contains three types of organics at least and polarity and kinetic diameters of these components are closer to each other. Thereby, butanol selectivity of this system is mostly in the range below with a percentage butanol concentration (Chaeyoung et al. 2015). In case of hydrophilic PV separation, water selective membrane is preferred. In literature, relatively superior flux and selectivity values have been observed and 99 percentage of water purity has been achieved accompanied with above than 500 selectivity (Dong et al. 2006). However, hydrophilic membranes polymeric ones- shows high swelling tendency and this plasticization effect shortens the membrane lifetime. Additionally, separation performances of hydrophilic polymeric membranes are not stable at all operation conditions. In order to reinforce the strength of polymeric membrane, inorganic fillers such as zeolite, clay have been incorporated into polymer matrix and mixed matrix membranes have been improved (Malladi et al. 2006; Susheelkumar et al., 2006). polymer solution and stirred for three hours at room temperature. Solution was casted onto a poly(tetrafluoroethylene) (PTFE) plate and allowed to evaporate all solvent from thin film. Dried film was taken to an oven for six hours to complete cross-linking reaction at 180 C. Dehydration of butanol was done by means of a hydrophilic composite zeolite-hydrophilic polyvinyl alcohol membrane. For preparation of pristine membrane, PVA-water solution (7 wt. % PVA-water) was prepared and the solution was stirred for 4 hours at 80 C temperature. After a homogeneous polymer solution was obtained, membrane was casted on a poly (methyl methacrylate) plate. For the preparation of composite membrane, PVA-water solution (7 wt. % PVA-water) was prepared, desired amount of 3A zeolite was added and polymer-zeolite solution was cast onto a poly (methyl methacrylate) plate. Membranes were dried for three days. After membranes had formed, they were kept in a cross-linking bath to stabilize it into aqueous solvent media. The bath consisted of 25 vol. % water, 75 vol. % acetone and 1 vol. % HCl and acetone (according to the total volume of cross-linking solution). II.3. Membrane Characterization Zeolite distributions in the PVA were analyzed by using Nikon eclipse microscope. Sessile drop water contact angles of pristine and loaded membranes were measured by using Attension KVS Instrument. II.4. Pervaporation Experiments In this study, two stage butanol production and deep purification system was designed and purification process was experimented to obtain high purity butanol. For this purpose, a PDMS membrane was fabricated to dehydrate butanol and 3A loaded poly(vinyl alcohol) membrane was prepared to concentrate that dehydrated solution above 90 wt. % butanol. II. Experimental II.1 Materials Poly(vinyl alcohol) (PVA), benzoyl peroxide (BPO) and zeolite 3A were purchased from Aldrich Chemicals. Vinyl terminated PDMS (Silastic New GP30) was kindly supplied by Dow Chemical Company. Glutaraldehyde (GA), hydrochloric acid (HCl), acetone were supplied from Merck Chemicals in Turkey. II.2 Membrane Preparation For preparation of hydrophobic butanol selective membrane, 10 wt. % of PDMS chloroform solution was prepared by stirring for 10 hours at 45 C temperature. Afterward, 4 wt. % benzoyl peroxide respect to the PDMS amount- was added to 646 As it was mentioned before, hydrophobic membranes were used to dehydrate dilute fermentation broth that the butanol concentration was approximately 1-4 wt. %. Because of the varying butanol concentration depending on the fermentation time and conditions, experiments were carried out with different model solutions and temperatures. Firstly, effect of feed temperature (from 30 C to 60 C) on total flux and butanol separation factor were investigated. Then the effect of butanol concentration in feed solution was studied separately. In the second stage, water was selectively removed from concentrated butanol-water solution by means of pristine and composite hydrophilic PVA membrane. In order to obtain the better membrane type, effect of 3A loading (pristine, 5 wt. % and 10 wt. % 3A with respect to the PVA weight) was performed. According to the varying permeate concentration, effect of feed concentration (7, 10, 15, 20 wt. % water in feed solution) on flux and water separation factor was also studied. Additionally, temperature was changed to determine appropriate conditions. Both for hydrophilic and hydrophobic system, upstream was atmospheric pressure and downstream was kept stable at 5 mbar. Effective membrane area was and membrane cell
 Ya / Xa (2) Y / X b b Separation factor (α) was calculated from the GC data of permeate concentration as in Eq. 2.")

202 volume was 100 ml. System performance has been evaluated as function of flux and separation factor. Flux (J) (kg/m 2. h) is calculated from the measured weight of permeate sample as shown in Eq. 1 J W p t. A (1) Ya / Xa (2) Y / X b b Separation factor (α) was calculated from the GC data of permeate concentration as in Eq. 2. Wp is the weight of permeate (kg), t is the time (h), A is the effective membrane area (m 2 ), Ya and Yb are the mass or volume fractions of a and b compounds in the permeate respectively. Xa and Xb are the mass or volume fractions of a and b compounds in the feed respectively. III. Results and Discussions III.1 Membrane Characterization Results Figure 1 shows the structural properties of hydrophobic PDMS membrane. According to the main task of pervaporation, membrane should be non-porous and apolar properties. SEM observation proved the non-porous structure of membrane in Figure 1a. It is well known that the water contact angle gives an idea about the hydrophobicity of membrane under the test conditions. In literature, it was reported that the higher angle than 90 represented the hydrophobic structure and in Figure 1b confirmed the hydrophobicity of PDMS. Fig. 2 Zeolite distribution of 3A loaded PVA membrane under the non-polarized (a) and polarized (b) light III.2. Hydrophobic Pervaporation Results Figure 3 indicates the effect of feed butanol concentration on separation performance at 50 C temperature. After the fermentation step, a very dilute butanol solution is produced so the studies center upon the selective separation of dilute solution between 1-4 wt. % butanol. As can be seen in Figure 3, flux enhanced from 0.02 kg/m 2.h to kg/m 2.h as the concentration of butanol increased from 1 to 4 wt. % butanol. In studied temperature, increasing butanol concentration caused an increase in mobility of flexible polymer chains and it was resulted an enhancement in free volume number and size (Elsayed and Feng 2008). Hence, flux increased as expected. Contrary to flux, butanol separation factor decreased from 63 to 24 with butanol concentration. Fig. 1 Surface SEM micrograph (a) and water contact angle result (b) of PDMS membrane. Figure 2a and 2b show the microscope images of 3A loaded PVA composite membrane under non-polarized and polarized lights respectively. In Figure 2a, zeolites are clearly seen that are homogeneously distributed to the surface. There are no contact free regions between the polymer and zeolite particles that can be responsible for the non-selective separation. Figure 2b represents the crystalline zeolite particle. Homogeneous distribution is also seen in this figure. Fig. 3 Effect of feed butanol concentration on separation performance of PDMS (50 C) Pervaporation is a selective non-porous membrane separation system. When polymer structure changes, selective separation ability suffers caused by chain enlargement. This trade-off trend between the separation factor and flux are well known circumstance in pervaporation experiments without discriminating the hydrophobicity of membrane (Eun et al. 2012; Liu et al. 2011; Naixin et al, 2014). Figure 4 shows the relationship between the temperature and separation performance of PDMS 647
203 for 1 wt. % butanol water model solution. When temperature changed from 30 C to 50 C, flux increased from 0.02 kg/m 2.h to kg/m 2.h. These results were attributed to enhancement in the thermal mobility of rubbery polymer chains. Increasing chain mobility caused an enlargement in free volume in the polymer matrix and permeation rates increased as expected (Taghreed et al. 2015). Additionally, diffusion and solution coefficient of solvent increased resulted by temperature, and flux increased. The reason enhanced the flux showed negative affect on separation factor. priming (Nigiz et al. 2012). In this study, 3A loaded PVA was prepared by priming method and very high flux and water separation factors were obtained. Highest values were obtained with 10 wt. % 3A loaded membrane as 1.33 kg/m 2.h flux and 93 water separation factor. Fig. 5 Effect of zeolite loading on separation performance of PVA (15 wt. % water, 50 C) Fig. 4 Effect of temperature on separation performance of PDMS (1 wt. % butanol) III.3. Hydrophilic Pervaporation Results After the first hydrophobic stage, concentrated mixture was circulated to hydrophilic pervaporation system and allowed to dehydrate high purity butanol. After the hydrophobic separation, approximately wt. % butanol was obtained and the concentration of second stage was determined by considering nearby concentration. Separation factors changes depended on the temperature were seen in Figure 6. Same as the PDMS membrane, composite PVA also showed an flux increment - separation factor decrement trend. When temperature increased from 30 C to 60 C, flux enhanced from 0.87 kg/m 2 to 1.43 kg/m 2 and water separation factor changed from 278 to 89. As it was mentioned before, temperature was directly related to structure of polymer and thermodynamic properties of solutions. Solubility of component on membrane surface and diffusivity throught the membrane enhanced with temperature. Moreover, vapor pressure of components increased and driving force was risen. In figure 5, effect of zeolite loading at constant temperature and feed solution was represented. Both flux and separation factors were improved by zeolite incorporation due to the unique selective permeability of crystalline zeolite structure. Zeolite 3A is a hydrophilic zeolites that has smallest cage size between the K type zeolites (0.3 nm) and it is appropriate to separate water from organic compounds that has bigger kinetic diameters. Additianolly structural damages are prevented by zeolite loading. Just an example, excess polymer mobility and swelling degree are restricted by zeolite addition. Thereby, selective separation capability is improved associated with very high flux. However, there are some points to take into account for composite membrane preparation. One and important of these points are to achieve good adhesion between the inorganic particle and organic polymer. If an undesirable contact free region occurs between them, organic molecules may pass through the membrane and separation factor decreases. In literature, there are some suggested method to prepare a selective composite membrane such as 648 Fig. 6 Effect of temperature on separation performance of PVA (15 wt. % water, 10 wt. % 3A) Beside of these varying properties, polymer plasticisation was accelerated the solvent passage through the membrane. Therefore, flux increased but water separation factor decreased. The other possible reasons to enhance flux and decrease separation factors were the changing hydrogen bonding capability of water with membrane and changing coupling effect of solvent with temperature.
204 Figure 7 shows the water concentration depended separation performance of 10 wt. % 3A loaded PVA membrane. When water concentration increased from 7 to 20 wt. % slightly, flux raised from 0.98 kg/m 2 to 1.43 kg/m 2 and separation factor decreased from 430 to 58. These results were attributed to plasticisation effect of membrane and increasing concentration gradient between the sides of the membrane. Same as the present study, pervaporation experiments for separation of ABE fermentation broth or model solution are classified into two main categories as hydrophobic and hydrophilic. It is important to achieve high separation factor associated with desirable flux value. While flux determines the productivity of the system, separation factor defines the selective separation capability of membrane. In order to simply evaluate the overall performance of the PV, pervaporation separation index (PSI)(Equation 3) has been defined by researchers. PSI= J (α-1) (3) Fig. 7 Effect of feed water concentration on separation performance of PVA (50 C, 10 wt. % 3A) This value should be separately evaluated for hydrophilic and hydrophobic system. As it was mentioned before, hydrophilic membranes had higher flux and separation factor than that of hydrophobic ones due to the swelling tendency of membrane in aqueous media. Table 1 confirmed these results as shown below. Between the literature results, very good and admirable flux and separation factors were achieved by using 3A loaded PVA membranes in pervaporation system. III.3. Comparison with Literature Data Table 1. Comparison the results of present study IV. Conclusions Acknowledgements This study focused on the selective separation of butanol from model fermentation solution. Concentration/ dehydration experiments were done by means of a hybrid hydrophilic-hydrophilic membrane separation technology. In the first stage, better flux and butanol separation factor was achieved at 50 C and butanol was concentrated from 4 wt. % butanol to 80 wt. %. When this solution was circulated to second stage, 93 wt. % butanol was obtained within seven hours. Compared to literature, this result was excellent and this study proved the hybrid separation system was applicable to purify bio butanol efficiently. 649 This research was supported by the Scientific Research Project Center of Kocaeli University. Nomenclature ABE : Acetone-butanol-ethanol PV : Pervaporation PVA : Poly(vinyl alcohol) PDMS : Poly(dimethyl siloxane) J : Flux (kg/m 2.h) α : Separation factor X: Sodium montmorillonite Y : Pervaporation
205 PSI : Pervaporation separation index W : Weight (kg) A : Effective membrane area (m2) PTFE : Poly(tetrafluoroethylene) References Amrita R., Vijayanand S. M., Biobutanol: science, engineering, and economics, Int. J. Energy Res., 36, , (2012). Chaeyoung S., Zachary C. B., Chelsea C. A. Evren O., Douglas S.C., Nitash P. B., Block copolymer pervaporation membrane for in situ product removal during acetone butanol ethanol fermentation, Journal of Membrane Science, 484, 57 63, (2015). Dong Y.Q., Zhang L., Shen J.N., Song M.Y., Chen H.L., Preparation of poly(vinyl alcohol)-sodium alginate hollow-fiber composite membranes and pervaporation dehydration characterization of aqueous alcohol mixtures, Desalination, 193, , (2006). Durre J P., Biobutanol: An attractive biofuel, Biotechnol. J., 2, , (2007). Edward M. G., Fermentative production of butanol the industrial perspective, Current Opinion in Biotechnology 22, 1 7, (2011). Elsayed A. F., Xianshe F., Use of pervaporation to separate butanol from dilute aqueous solutions: Effects of operating conditions and concentration polarization, Journal of Membrane Science, 323, (2008). Membrane, Chinese Journal of Chemical Engineering, 19, (2011). Malladi S., Mallikarjunagouda B. P., Ravindra S. V., Sangamesh A. P., Tejraj M. A., Novel dense poly(vinyl alcohol) TiO2 mixed matrix membranes for pervaporation separation of water isopropanol mixtures at 30 C, Journal of Membrane Science 281, , (2006). Naixin W., Shulan J., Jie L.,Rong Z., Guojun Z., Poly(vinylalcohol) grapheme oxide nanohybrid pore-filling Membrane for pervaporation of toluene/n-heptane mixtures, Journal of Membrane Science 455, , (2014). Nigiz F.U., Dogan H., Durmaz Hilmioglu N, Pervaporation of Ethanol/Water Mixtures Using Clinoptilolite and 4A Filled Sodium Alginate Membranes, Desalination, 300, 24-31, (2012). Nigiz F.U., Ozkoc G., Durmaz Hilmioglu N., A study on the separation performance of zeolite filled thin film composite poly(dimethyl siloxane) membrane, Materials and Design, 88, , (2015). Sampa M., Gorka G., Satinder K. B., Yann L., Gerardo B., Patrick D., Mausam V., Quest for sustainable bio-production and recovery of butanol as a promising solution to fossil fuel, 40, , (2016). Sekulic J., Elshof J.E., Blank D.H.A., Separation mechanism in dehydration of water/organic binary liquids by pervaporation through microporous silica, Journal of Membrane Science, 254, , (2005). Erica G. C., Patricia P. D. S., Governance of the emerging biofuel markets in European Union: the Portuguese context, International Journal of Global Warming,.12, , (2010). He H., Lui H., Gan Y.-Ru. Genetic Modification of Critical Enzymes and Involved Genes in Butanol Biosynthesis from Biomass, Biotechnology Advances, 28, , (2010). Heitmann S., Krüger V., Welz D., Lutze P., Experimental Investigation of Pervaporation Membranes for Biobutanol Separation, Journal of Membrane and Separation Technology, 2, , (2013). Joanna M., Władysław K., Concentration of butanol-ethanol-acetone-water using pervaporation, Proceedings of ECOpole, 6, (2012). Kaminski W., Tomczak E., Gorak A., Biobutanol - Production And Purification Methods, Ecological Chemistry And Engineering, 18, 31-37, (2011). Liu G., Hou D., Wei W., Xiangli F., Jin W., Pervaporation Separation of Butanol-Water Mixtures Using Poly dimethylsiloxane/ceramic Composite 650 Sridhar S., Dhanuja G., Smitha B., Ramakrishna M., Dehydration of 2-Butanol by Pervaporation Through Blend Membranes of Chitosan and Hydroxy Ethyl Cellulose, Separation Science and Technology, 40, , (2005). Susheelkumar G. A,, Malladi S,, Lata S. M,, K.V.S.N. Rajub, Tejraj M. A., Sodium montmorillonite clay loaded novel mixed matrix membranes of poly(vinyl alcohol) for pervaporation dehydration of aqueous mixtures of isopropanol and 1,4-dioxane, Journal of Membrane Science 285, , (2006). Taghreed A. J., Srivatsa B. N. M., Ngoc L. L., Suzana P. N., Hydrophobic Hyflon AD/Poly(vinylidene fluoride) Membranes for Butanol Dehydration via Pervaporation, Ind. Eng. Chem. Res. 54, , (2015). Tashiro Y., Sonomoto K., Advances in butanol production by clostridia, Current Research, Technology and Education Topics in Applied Microbiology and Microbial Biotechnology (Microbiology Book Series, Volume 2), Antonio Mendez Vilas (ed.), ISBN (13): , Formatex Research Center (Badajoz, Spain), p (2010).
206 Biodiesel Production from High Acid Value Sunflower Oil By Using Zirconium Sulfate as a Heterogeneous Acid Catalyst Melike Imge Senoymak 1*, Oguzhan Ilgen 1 1 Kocaeli University, Engineering Faculty, Chemical Engineering Department, Umuttepe Campus, Kocaeli, 41380, TURKEY * [email protected] Abstract In biodiesel production process, many studies have been done for eliminating high cost of feedstock oils. For this reason, cheaper feedstocks such as non-edible oils, animal oils or waste cooking oils have been used. In this study, waste oil was prepared by adding 6 wt.% of oleic acid as free fatty acids into sunflower oil. The main reasons of choosing zirconium sulfate catalyst are some features as high catalytic activity, high atom efficiency, low toxicity, low cost and easy handling. In this study, effects of various parameters such as methanol/oil molar ratio, catalyst amount and reusability of the catalyst were investigated. The highest fatty acid methyl ester (FAME) yield of 90 % was obtained under reaction conditions of 100 C reaction temperature, 4h reaction time, 9:1 methanol/oil molar ratio and 6 wt.% catalyst amount. Keywords: biodiesel production, heterogeneous acid catalyst, waste oil, zirconium sulphate. I. Introduction In recent years, the search for alternative fuels have gained importance because of increasing greenhouse gas concentrations, decreasing petroleum resources and correspondingly increase of world energy consumption. Biodiesel is one such an alternative that defined as mono alkyl esters of long chain fatty acids which are produced from renewable resources like vegetable oils and animal fats (Mall, 2015). Several kinds of vegetable oils such as sunflower, canola, palm, palm kernel and coconut oil have been used for biodiesel production as raw material. However, the most important handicap for biodiesel production is high production cost arising from raw materials and type of catalyst (Borges and Diaz, 2012). Therefore, waste oil as a raw material is one of the most cost-effective feedstock for the biodiesel production (Rosa et al., 2015). Neverthless, using waste oil for production of biodiesel causes saponification because of high free fatty acid (FFA) content in case of using alkaline catalysts. Homogeneous acid catalysts are not affected by high FFA content but they are not suitable for use because of the difficulties of recycling and operating process at high temperatures and causing serious environmental and corrosion problems (Lou et al., 2008; Veljkovic et al., 2006). For these reasons, heterogeneous acid catalysts like ZrO2, TiO2, SnO2, zeolites, sulfonic ion-exchange resin, sulfonic modified mesostructure silica, sulfonated carbon-based catalyst and heteropolyacids are usually being preferred instead of homogeneous acid catalysts (Shu et al., 2007; Lam et al., 2010). In this study, zirconium sulphate (ZS) was preferred as a heterogeneous catalyst for biodiesel production due to its high catalytic activity. Besides having high catalytic activity, ZS is a green catalyst that has features like low toxicity, low cost and easy handling (Juan et al., 2008). In spite of all these advantages of ZS, there is limited availability of studies about ZS as a catalyst for biodiesel production process. For example, Juan et al. (2008) was used ZS as a catalyst in the study of the esterification reaction of fatty acids with alcohols under solvent free condition. Catalytic activities of ZS and other metal sulphate catalysts were compared in the esterification reaction of oleic acid with n-butanol under same reaction conditions. In consequence of the investigation, ZS catalyst was found the most efficient catalyst relatively for the esterification reaction of fatty acids with alcohols. In another study, Boffito (2012) has performed esterification of commercial rapeseed oil which is acidified with oleic acid up to 5%wt by using zirconium sulphate tetra hydrate catalyst and FFA conversion of 95% was obtained. High acidity, low surface area and high pore volume of zirconium sulphate tetra hydrate catalyst have been shown as reason of high FFA conversion. Model waste oil or, in other words, high acid value oil was also prepared in the literature. For example, Park et al. (2010) investigated the esterification reaction of FFA and modeled different type of oils that contain different FFA values by adding oleic acid to soybean oil. In another study, model waste oil was prepared through adding 50 wt% oleic acid to cottonseed oil by Shu et al. (2010). In this study, high acid value sunflower oil was prepared by adding oleic acid as FFA into sunflower oil. Effects of methanol/oil molar ratio and catalyst amount were investigated in a biodiesel production process from high acid value sunflower oil by using zirconium sulphate catalyst. 651

207 II. Experimental Facility Zirconium sulphate tetra-hydrate was supplied by Alfa Aesar. Methanol and oleic acid were commercially obtained from Merck. Zirconium sulphate was produced by calcining zirconium sulphate tetra-hydrate at 450 C for 5 hours and used as a catalyst. The reactions were carried out in a 250 ml Parr 4560 reactor. High acid value sunflower oil was modelled by adding 6 wt% oleic acid as free fatty acid into sunflower oil based on the weight of oil. 50 g of high acid value sunflower oil, different amounts of methanol and catalyst was charged into the reactor. The required catalyst amount was calculated based on weight percentage of high acid value sunflower oil. Stirring rate was adjusted to 500 rpm. Effects of methanol/oil molar ratio and catalyst amount were investigated. The reaction mixture was separated from the catalyst by filtration and biodiesel layer was obtained after centrifugation and analyzed by a gas chromatography according to European regulated procedure EN III.Results and discussion III.1 Effects of catalyst amount Catalyst amount is an important parameter that affects FAME yield in a biodiesel production process. The effect of catalyst amount (1.5, 3, 4.5, 6, 9 and 12 wt.%) on the yield of FAME during the reaction of methanol with a high acid value sunflower oil which contains 6 wt.% oleic acid. The reaction occurred at 100 C, 4 hours, 9/1 molar ratio of alcohol to oil and a stirrer speed of 500 rpm. The catalyst amount that varies from 1.5 wt.% to 12 wt.% was calculated referred to the starting weight of sunflower oil. Results can be seen from Fig. 1. In consequence of the reactions mentioned above, the FAME yield was increased gradually until 90 % of FAME yield with an increase of catalyst amount from 1.5 to 6 wt. % as shown in Figure 1. When amount of catalyst was not enough, it became difficult for the raw materials to reach the catalyst. Increment of mass fraction of the catalyst was provided good catalytic activity by the increasing the probability of contact between raw materials and catalyst. However with a further increase in the catalyst amount, the FAME yield started to decrease slightly which was probably due to a mixing problem involving reactants, products, and solid catalyst. When the amount of catalyst was increased too much, the mixture of catalyst and reactants became too viscous and required higher power consumption for mixing (Xie et al. 2007), (Noiroj et al. 2009), (Agarwal et al. 2012). As can be observed, the best result of 90 % was reached with a concentration of 6 wt.% but as much as half of this amount, FAME yield of 82 % wasobtained. Fig. 1: Effects of catalyst amount on the FAME yield. Reaction conditions: reaction temperature, 100 C; reaction time, 4h; methanol/oil molar ratio, 9/1. III.2 Effects of molar ratio of methanol/oil Effect of molar ratio of methanol/sunflower oil is one of the important parameter that influences the yield of FAME. Since the transesterification reaction is reversible, excess amount of methanol could shift the reaction towards the products to produce more methyl esters. Furthermore, stoichiometry of transtesterification reaction is 3:1, but in some cases mass transfer can be restricted by mixing problems and gets slower than the reaction rate. Then, in order to increase the FAME yield, molar ratio of methanol/oil can be increased more than the ratio of 3:1 (Xie and Huang, 2006). As presented in Figure 2 the effects of molar ratio of methanol/sunflower was studied for 4 different methanol/sunflower oil molar ratio (6/1, 9/1, 12/1, 15/1) under same reaction conditions of 100 C reaction temperature, 4 hours reaction time and 3 wt.% catalyst amount. It can be seen from the figure that with increasing the loading amount of methanol, the FAME yield increased incrementally. FAME yield of 82 % was obtained with 9/1 methanol/oil molar ratio and beyond a molar ratio of 9/1, increasing the methanol amount exhibited no sufficiency increment on FAME yield. As a consequence, 9/1 methanol/oil molar ratio was found reasonable for this reaction due to using of less methanol makes the process more environmentally and economic. Similar results have been reported in other studies (Felizardo et al. 2006), (Xie and Huang, 2006), (Peng et al. 2008). III. 3.Catalyst reusability The reusability of the catalyst was also investigated during this study. Reusability tests were done under the conditions as 9/1 methanol/oil molar ratio, 6 wt.% catalyst amount 115 C and 4 hours. After the reactions, catalyst was separated from the reaction mixture by filtration and reused directly without any treatment. The results are represented in Figure 3 and showed a decreasing trend in FAME yield and the activity with the repeated use of the zirconium sulphate catalyst. This severe decrease of the catalyst activity might be because of the structural changes. Otherwise, the existence of methanol might 652


208 also cause the loss and leaching of the sulphate groups from the catalyst. Another reason of this deactivation might be losses of some catalyst during the filtration and transferring to the new reaction vessel. Similar results for reusability of zirconium sulphate catalyst were obtained by Boffito (2012). References Agarwal M., Chauhan G., Chaurasia S.P., Singh K., Study of catalytic behavior of KOH as homogeneous and heterogeneous catalyst for biodiesel production, Journal of the Taiwan Institute of Chemical Engineers, 43, 89 94, (2012). Boffito D.C., Biodiesel Production from Non-foodstuff: Chemistry, Catalysis and Engineering, Ph.D. Thesis, University of Milan, (2012). Felizardo P., Correia M.J.N., Raposo I., Mendes J.F., Berkemeier R., Bordado J.M., Production of biodiesel from waste frying oils, Waste Management, 26, , (2006). Fig. 2: Effects of methanol/oil molar ratio on the FAME yield. Reaction conditions: reaction temperature, 100 C; reaction time, 4h; catalyst amount, 3 wt.%. Juan J.C., Zhang J., Yarmo M. A., Efficient Esterification of Fatty Acids with Alcohols Catalyzed by Zr(SO4)2.4H2O Under Solvent-Free Condition, Catal Lett, 126, , (2008). Lam M. K., Lee K. T., Homogeneous, heterogeneous and enzymatic catalysis for transesterification of high free fatty acid oil (waste cooking oil) to biodiesel: A review, Biotechnology Advances, 28, , (2010). Lou W., Zong M., Duan Z., Efficient production of biodiesel from high free fatty acid-containing waste oils using various carbohydrate-derived solid acid catalysts, Bioresource Technology, 99, , (2008). Fig. 3: Reusability of zirconium sulphate catalyst in the reaction of biodiesel production. Reaction conditions: reaction temperature, 115 C; reaction time, 4h; catalyst amount, 6 wt.%; methanol/oil molar ratio, 9/1. IV. Conclusions In this study, zirconium sulphate was used as a heterogeneous acid catalyst for the biodiesel production from high acid value sunflower oil. Effect of catalyst amount, methanol/oil molar ratio and reusability of the the catalyst were investigated.the highest FAME yield was obtained as 90 % under the reaction conditions of 100 C reaction temperature, 4h reaction time, 9:1 methanol/oil molar ratio and 6 wt.% catalyst amount. After the reusability tests of the catalyst, it was found that the catalyst showed a severe deactivation after being used for more than two times. Effect of other reaction parameters and reusability of catalyst is still under research in our laboratory. 653 Mall A.P., Production of Biodiesel from Crude Neem Oil Feedstock and the Effects of Various Parameters on the Yield of Biodiesel, International Journal of Research, 2, , (2015). Noiroj K., Intarapong P., Luengnaruemitchai A., Jai-In S., A comparative study of KOH/Al2O3 and KOH/NaY catalysts for biodiesel production via transesterification from palm oil, Renewable Energy, 34, , (2009). Park J., Kim D., Lee J., Esterification of free fatty acids using water-tolerable Amberlyst as a heterogeneous catalyst, Bioresource Technology, 101, S62 S65, (2010). Peng B., Shu Q., Wang J., Wang G., Wang D., Han M., Biodiesel production from waste oil feedstocks by solid acid catalysis, Process Safety and Environment Protection, 86, , (2008). Rosa H, Tropecelo A.I., Caetano C.S., Castanheiro J.E., Valorization of Waste Cooking Oil into Biodiesel over an Anionic Resin as Catalyst, Energy Sources, Part A: Recovery, Utilization, and Environmental Effects, 37, , (2015). Shu Q., Gao J., Nawaz Z., Liao Y., Wang D., Wang J., Synthesis of biodiesel from waste vegetable oil with large amounts of free fatty acids using a
209 carbon-based solid acid catalyst, Applied Energy, 87, , (2010). Shu Q., Yang B., Yuan H., Qing S., Zhu G., Synthesis of biodiesel from soybean oil and methanol catalyzed by zeolite beta modified with La 3+, Catalysis Communications, 8, , (2007). Veljkovic V.B., Lakicevic S.H., Stamenkovic O.S., Todorovic Z.B., Lazic M.L., Biodiesel production from tobacco (Nicotiana tabacum L.) seed oil with a high content of free fatty acids, Fuel, 85, , (2006). Xie W., Huang x., Synthesis of biodiesel from soybean oil using heterogeneous KF/ZnO catalyst, Catalysis Letters, 107, 53-59, ( 2006). Xie W., Huang X., Li H., Soybean oil methyl esters preparation using NaX zeolites loaded with KOH as a heterogeneous catalyst, Bioresource Technology, 98, , (2007). 654
210 Biodiesel Production over CaMgAl Hydrotalcite like Compounds from Waste Cooking Oil Emine Emel Cakirca 1, 2*, Ayse Nilgün Akın 1, 2 1 Kocaeli University, Engineering Faculty, Chemical Engineering Department, Umuttepe, Kocaeli, 41380, Turkey 2 AYARGEM, Alternative Fuels R&D Center, Kocaeli University, Kocaeli, Turkey * [email protected] Abstract In this work, transesterification reactions of waste cooking oil (WCO) with methanol in presence of CaMgAl hydrotalcite like catalysts were investigated. These catalysts were prepared by using co-precipitation method with Al/(Ca+Mg+Al) molar ratio of 0.33 and calcination temperature was 800 C. The obtained catalysts were characterized by using X-ray diffraction, Fourier transform infrared spectra, Brunauer Emmett Teller and Thermal Gravimetric Analyzer techniques for physical properties. The activitiy of the catalysts were studied in the transesterification reaction of WCO with methanol. CaMgAl2 catalyst showed good catalytic activity, achieved 90% conversion to biodiesel. The reaction conditions were investigated at different molar ratio of methanol to oil (3:1, 6:1, 9:1 and 15:1), catalyst amounts (1%, 3%, 5% and 9% weight of WCO) and reaction time (0.5 7 hours). Optimum reaction conditions were obtained as 65 C for 5 hours, methanol to WCO molar ratio of 6:1 and catalyst amount of 3 wt%. Keywords: Biodiesel, waste cooking oil, hydrotalcite, heterogeneous catalyst, transesterification. I. Introduction Sustainable energy resources have become an important issue in the world due to rapid depletion of fossil resources, growth in population and consequently growing energy demand (Faroog et al., 2015). Biofuels are popular alternative renewable energy resources that can be used as liquid fuels in transportation. Biodiesel has a potential in biofuels as an alternate to petroleum diesel fuel (Priambodo et al., 2015 and Al-Hamamre et al., 2014). Biodiesel properties can sometimes be superior to that of petroleum diesel fuel because the former has better lubricating efficiency, better cetane number, ultra-low sulphur concentration, and higher flash point. Biodiesel is derived from lipid feedstocks by transesterification reaction with short chain alcohols in presence of a catalyst and glycerol is produced as a by product. Although biodiesel is a promising alternative fuel, its commercialization is restricted due to high cost of raw materials (Li et al and Ullah et al. 2015). Ullah et al. (2015) pointed that price of biodiesel is more than the one of petroleum diesel and 70-95% of the price of biodiesel includes cost of oil feedstocks. Biodiesel can be produced from various raw materials such as edible oils (the first generation raw materials,) and non edible oils (the second generation raw materials). The use of edible oils is not convenient in production of biodiesel due to insufficient amount of edible oil feedstocks and demand for food materials in the world. Therefore, waste cooking oils (WCO) have potential feedstocks for biodiesel production. Biodiesel production via heterogeneous catalysts have advantages compare to homogeneous catalysts. Homogeneous process needs steps of glycerol separation, washings, very stringent and extremely low limits of Na, K, glycerides and moisture limits in biodiesel. Development of heterogeneous catalyst could overcome most of the problems associated with homogeneous catalysts. However, they still have some downsides with regarding to processing time and high alcohol to oil ratio. Also, limiting the mass transfer and emulsification problem in the reaction process are needed to explore optimal conditions to complete the reaction (Anuar and Abdullah, 2016). Because of these reasons, investigation on heterogeneous catalysts have still been continuing. In literature, a wide variety of acidic or basic heterogeneous catalysts have been studied in transesterification of WCO with methanol. Li et al. (2014) and Cao et al. (2016) studied with acid catalysts and obtained 90% and 87.5% conversion to FAME respectively. However reaction time was almost 20 hours and methanol to WCO molar ratio rised up to 25:1. If amount of free fatty acids are at low levels in WCO, basic catalysts can be used in transesterification reactions. Basic zeolites, alkaline earth oxide base catalysts such as CaO-MgO-SrO or BaO and hydrotalcite-like compounds are known as solid base catalysts for this catalytic system (Helwani et al., 2009). Hydrotalcite-like compounds (HTLCs) have used in transesterification reaction due to their ability to design of their chemical composition in a board range. Their general formula is M 2+ 1 xm 3+ x(oh)2a n x/n yh2o, where M 2+ and M 3+ are the di- and tri-valent cations, x is equal to the M 3+ / (M 2+ + M 3+ ) molar ratio and 655
211 ranges from 0.1 to 0.5, A n- is an exchangeable interlayer anion and y is the number of water molecules (Gomes et al., 2001). Depending on thermal treatment (calcination process), hydrotalcites decomposes into active, high surface area and well-dispersed mixed metal-oxides. So, they have potential application in catalytic reactions as catalysts (Wang and Jehng, 2011). The main goal of this study is to produce biodiesel from waste cooking oil in the presence of Ca-containing hydrotalcite like compounds as catalyst. Although there are few studies related to produce biodiesel from edible oils in the presence of hydrotalcite like compounds, there is not any study using WCO as feedstock and Ca-containing hydrotalcite like compounds as catalyst. In this study, we focused to develop CaMgAl hydrotalcite like catalysts which are active in the transesterification reaction. The catalysts were synthesized via co-precipitation method and characterized by XRD, TGA, FTIR and BET techniques. The activities of the catalysts were tested in the transesterification reaction of WCO with methanol. The reaction conditions were investigated at different molar ratio of methanol to oil, catalyst amounts and reaction time. The results were discussed in terms of biodiesel yield. II. Experimental Study II.1. Materials Waste cooking oil (WCO) was supplied from TARCIN Catering company in Tuzla, TURKEY. Methanol (99%, Merck), n-hexane (98,5%, Merck) and methyl heptadecanoate (99%, Sigma Aldrich) were used in transesterification reactions and biodiesel analysis. Ca(NO3)24H2O ( 99%, Sigma Aldrich), Mg(NO3)24H2O (99%, Tekkim), Al(NO3)39H2O (95%, Merck), NaOH (97%, Sigma Aldrich) and Na2CO3 ( 99.9 %, Merck) were used in catalyst preparation process. II.2. Catalyst preparation Catalysts were prepared with co-precipitation method and Al +3 /(Al +3 +Mg +2 +Ca +2 ) molar ratio was adjusted to be In this system, the nitrate solution containing Ca, Mg and Al cations (total cation molarite was 1) was slowly dropped to the solution containing certain amount of NaOH and Na2CO3 with 1ml/min and mixed with 750 rpm at room temperature. The obtained solution was left aging for 24 hours at 60ºC, then the precipitate was filtered and washed with distilled water several times. Then it is dried at 100 C during overnight. The obtained powders have calcined at 800 C for 5 hours. The molar ratios of Ca +2 to Mg +2 to Al +3 were 0:1:1.5, 0.5:1:0.74, 1:1:1 and 2:1:1.5. The catalysts were labeled as MgAl, CaMgAl0.5, CaMgAl1 and CaMgAl2 respectively. II.3. Catalytic acitivity test Catalytic activity test of the catalysts were studied in 656 the transesterification reaction of WCO with methanol. Transesterification were carried out in a 100 ml batch reactor consist of a water-cooled condenser, thermostat and mechanical stirrer. 25 gram WCO and certain amounts of methanol and catalyst were added in the reaction system at 65 C. The amounts of the catalyst was determined based on WCO weight. The reaction mixture was stirred at 600 rpm vigorously for 5 hours. After the end of reaction, the catalyst was filtered from the reaction medium. The remaining liquid was centrifuged and biodiesel (FAME) phase was separated as upper layer. II.4. Catalyst characterization Layered double hydroxides patterns were collected at room temperature by using a Rigaku X-Ray Diffraction (XRD) Spectrophotometer with a scanning range of 10 to 80 (2θ). Nitrogen adsorption desorption isotherms were obtained by using Micromeritics ASAP Brunauer Emmett Teller theory was used to determine specific surface area, pore volume and pore width of the catalysts. An infrared (IR) spectrum of all the catalysts was obtained using Perkin Elmer ATR - FTIR spectrophotometer. Mettler Toledo Thermal gravimetric analyzer (TGA) was used to identify of weight changes of sample during temperature increase up to 950 C. II.5. Fatty Acid Methyl Ester (FAME) Analysis FAME yield was determined by using AGILENT 6890N gas chromatography with a flame ionization detector (GC/FID system) and CARBOWAX column 0.32mm - 30m µm. 5 ml solution of methyl heptadecanoate in heptane was added in 250 mg obtained biodiesel sample. The mixture was stirred and injected in the gas chromatography as 1µl. The ester content calculated as a mass fraction in percent according to EN14103 method. III. Results and discussions III.1. Characterization of the catalysts The TGA profiles of calcined and uncalcined CaMgAl2 catalysts are shown in Figure 1. For uncalcined catalyst the first mass loss was seen in the C range with mass losses of 3% and 14% respectively. This is related to elimination of interlayer adsorbed surface water. The other termal events occured at 301 C and 495 C due to dehydroxylation and decomposition of interlayer carbonate anion, which was accompanied by total mass loss of 30%. Between 640 C and 850 C the total mass loss 44.5%. Results exhibited similar curve with work of Sánchez-Cantú et. al. (2015). In these temperature ranges dehydroxylation and anion decomposition took place (Valente et. al and Sánchez-Cantú et. al. 2015). As a result, Ca-Mg mixed oxide forms were composed. From this analysis, it was decided to calcined all catalysts at 800 C to obtaine active phases.
212 Fig. 1: TGA analysis of the CaMgAl2 catalyst (a) uncalcined (b) calcined The TGA curve of calcined CaMgAl2 showed a little decrease in weight loss of 2%. It may be probably due to adsorbed moisture from the atmosphere. Therefore it is concluded that the prepared catalysts are stable at high temperatures after calcination. Fig. 2: FTIR analysis of the catalysts Figure 2 shows FTIR spectrum for the four catalysts. All samples exhibited similar spectra, the bants at 809 and 1100 cm -1 in dicate lattice vibrations (Ca-O or -OH, Mg-O or OH) according to Guzman-Vargas et al. (2015) and Wang and Jehng (2011). The weak band at 3600 referred to hydroxyl groups and interlayer water molecules in the catalysts. The XRD patterns of the catalsyts are shown in Figure 3. Owing to all of the catalysts were calcined at 800 C, dehydration, dehydroxylation and decarbonation processes took place and causing the formation of mixed oxides (Albuquerque et al. 2008). For MgAl catalyst, the characteristic reflections were shown at 2θ=37.35, and These peaks referred to trigonal Al2O3 and priclase MgO respectively (PDF Card no: and ). Most of the other peaks indicated presence of spinel MgAl2O4 phase (PDF Card no: ). In case of Ca containig catalysts, hexagonal Ca(OH)2 (18.78, and ), cubic CaO (37.72, and 64.5 ) and cubic MgO (43.35 and 62.8 ) phases were observed. Al2O3 and MgAl2O4 phase peaks were not seen. These results demostrate that either Al +3 ions are dispersed in the MgO without the formation of spinel structures (Deng et al., 2011) or it may be speculated that mayenite Ca12Al14O33 formation observed. XRD patterns of the catalysts confirm that increasing of the Ca was increased the crystallinity of the Ca-containing phases and formed well crystallized Ca oxides. Fig. 3: XRD patterns of the catalysts From Table 1, BET surface areas of the catalysts are in the range of 9 78 m²/g. MgAl catalyst exhibited the highest surface within all catalysts. CaMgAl mixed oxides demonstrated lower surface area comparing to MgAl as expected. This is due to association of the calcium in the structure of MgAl hydrotalcite. Calcium could have a destructive effect on the surface area (Vargas et al., 2015, Castro et al., 2011). Tab. 1: The results of the BET analysis of the catalysts Catalysts BET Average Pore surface pore volume, area, diameter, (cm³/g) (m²/g) (nm) MgAl CaMgAl CaMgAl CaMgAl Increasing the amount of Ca increased pore diameter of the catalysts as shown in Table 1. All of the prepared catalysts are meso-porous materials. This type of pore structure are suitable for transesterification reactions. Also, the N2 adsorption-desorption isotherms of the catalysts exhibited type III and type IV IUPAC model of hysteresis loop which is characteristic for meso-porous materials (Wang et al., 2011). Fig. 4: N2 adsorption-desorption isotherms of the catalysts 657

213 III.2. Catalytic activity of the catalysts The activity of the catalysts were tested in transesterification reaction of WCO with methanol under 65ᵒC for 5 hours and 3 wt% catalyst weight. As shown in Figure 5, MgAl hydrotalcite exhibited the lowest conversion to FAME. When small amount of Ca was added to MgAl hydrotalcite, the yield increased up to 78.6% dramatically. By increasing the Ca/Mg molar ratio to 2, the conversion to FAME was achieved to 90%. It is clear that Ca content has a significant effect on the biodiesel yield rather than Mg content in the catalyst. In literature, CaMgAl hydrotalcite catalysts were prepared various methods for biodiesel synthesis. But the yield of FAME is quite low. Vargas et al. (2015) and Gao et al. (2010) showed that calcined CaMgAl hydrotalcite catalyst exhibited 28% and 10% conversion respectively in the transesterification reaction. In this work, prepared CaMgAl mixed oxides from drived hydrotalcite exhibited the highest FAME yields in the literature. Fig. 5: % FAME of the WCO with methanol using the catalysts at 65 C for 5 hours, 600 rpm stirring, methanol to WCO molar ratio of 6:1 and catalysts amount of 3 wt% III.3. The effect of the reaction time In order to determine the optimum reaction time, the most active catalyst CaMgAl2 was chosen to test. The reaction conditions were determined as methanol to WCO molar ratio of 6:1, the catalyst amount of 3 wt% and reaction temperature 65 C. Samples were collected during the reaction period of hours at every 0.5 hour and analysed by GC/FID system. Figure 6 shows the effects of reaction time on FAME yield. In first 1.5 hours, no conversion was observed. After 3 hours, the conversion to FAME increased quickly, reached maximum 90 % at 5 hours and then remain at 90%. Therefore, 5 hour reaction period was the optimum time at the studied conditions. Fig. 6: Effect of the reaction time on the FAME yield with CaMgAl2 catalyst at 65 C, 600 rpm stirring, methanol to WCO molar ratio of 6:1 and catalysts amount of 3 wt% III.3. The effect of methanol:wco molar ratio on FAME yield The molar ratio of methanol to oil is one of the important parameters to obtain optimum conversion to FAME. Theoretically, reversible transesterification reaction stoichiometry of alcohol to oil is 3. Therefore, excess amounts of methanol proceed the reaction in favour of products. In this study, the effect of methanol: WCO molar ratio was investigated in the range of 3:1 to 15:1. Figure 7 shows variation of FAME conversion versus the molar ratio. The results show that at molar ratio of methanol: WCO of 3:1, the conversion was 67% at 65 C for 5 hours. By increasing ratio to 6:1 and 9:1, the yield value rose to 90%. However increasing the ratio up to 15:1, the yield begins to decrease slightly. The excess amount of methanol promote the reaction forward due to produce methoxy species on the catalyst. However, produced glycerol dissolves in the excess methanol and inhibits the reaction between reactants with methanol and catalyst. Furthermore, more methanol decreases concentration of catalyst in the reaction mixture (Faroog et al. 2015, Sirisomboonchai et al. 2015, Al-Hamamre et al. 2014). For these reasons, the conversion of biodiesel decreases from an optimum ratio of methanol to oil. In our study, the molar ratio of 6:1 is the optimum value for biodiesel production. Fig. 7: Effect of methanol to WCO molar ratio on the FAME yield with CaMgAl2 catalyst at 65 C, 600 rpm stirring and catalysts amount of 3 wt% 658

214 III.3. The effect of amount of the catalyst on FAME yield Figure 8 shows the effect of amount of catalyst in the reaction. It can be seen that biodiesel yield was 83% when the amount of the catalyst was 1% of weight of oil. The more catalyst was added, the yield of FAME was increased up to 90%. Gao et al., (2010), used KF/Ca-Al hydrotalcite for transesterification of palm oil and 3% was chosen optimum amount of the catalyst as we found in our study. In order to accelerate the reaction rate, the amount of the catalyst can be increased. But the more catalyst may cause mixing problem and the catalyst can be emulsified in the reaction medium (Deng et al., 2011). References Albuquerque M.C.G., Santamarıa-Gonzalez J., Merida-Robles J.M., Moreno-Tost R., Rodrıguez-Castellon E., et al., MgM (M = Al and Ca) oxides as basic catalysts in transesterification processes, Applied Catalysis A: General, 347, , (2008). Al-Hamamre Z. and Yamin J., Parametric study of the alkali catalyzed transesterification of wast frying oil for Biodiesel production, Energy Conversion and Management, 79, , (2014). Anuar M.R. and Abdullah A.Z., Ultrasound-assisted biodiesel production from waste cooking oil using hydrotalcite prepared by combustion method as catalyst, Applied Catalysis A: General, 514, , (2016). Fig. 8: Effect of catalyst amount on the FAME yield with CaMgAl2 catalyst at 65 C, 600 rpm stirring and methanol to WCO molar ratio of 6:1 IV. Conclusions In this work, CaMgAl hydrotalcite catalysts were prepared by co-precipitation method and calcined at 800 C for 5 hours. Thermal treatment affected the formation of active oxide forms. Although MgAl catalyst have greater surface area of m 2 /g than Ca-containing MgAl catalysts, conversion of the WCO to biodiesel is the minimum value of 18%. Maximum FAME yield was obtained by using catalyts CaMgAl2 (90%). The highest conversion to FAME was achieved at reaction temperature of 65 C for 5 hours, the molar ratio of methanol to WCO of 6:1 and the amount of the catalysts of 3 wt%. The results showed that CaMgAl catalysts derived from Ca-containing hydrotalcite is promising for transesterification of waste cooking oil with methanol for future researches. Nomenclature WCO FAME HTLCs XRD BET TGA FTIR : Waste cooking oil : Fatty acid methyl ester : Hydrotalcite-like compounds : X-Ray Diffraction : Brunauer Emmett Teller : Thermal gravimetric analyzer : infrared (IR) spectrum 659 Cao Y., Zhou H., Li J., Preparation of a supported acidic ionic liquid on silica-gel and its application to the synthesis of biodiesel from waste cooking oil, Renewable and Sustainable Energy Rewievs, 58, , (2016). Castro C.S., Cardoso D., MgAlLi Mixed Oxides Derived from Hydrotalcite for Catalytic Transesterification, Catal. Lett., 141, , (2011). Deng X., Fang Z., Liu Y., Yu C., Production of biodiesel from Jatropha oil catalyzed by nanosized solid basic catalyst, Energy, 36, , (2011). Farooq M., Ramli A., Naeem A., Biodiesel production from low FFA waste cooking oil using heterogeneous catalyst derived from chicken bones, Renewable Energy, 76, , (2015). Gao L., Teng G., Lv J., Xiao G., Biodiesel Synthesis Catalyzed by the KF/Ca - Mg - Al Hydrotalcite Base Catalyst, Energy Fuels, 24, , (2010). Gomes J.F.P., Puna J.F.B., Gonçalves L.M., Bordado J.C.M., Study on the use of MgAl hydrotalcites as solid heterogeneous catalysts for biodiesel production, Energy, 36, , (2011). Guzmán-Vargas A., Santos-Gutiérrez T., Lima E., Flores-Moreno J.L., Oliver-Tolentino M.A., et al., Efficient KF loaded on MgCaAl hydrotalcite-like compounds in the transesterification of Jatropha curcas oil, Journal of Alloys and Compounds, 643, S159-S164, (2015). Helwani Z., Othman M.R., Aziz N., Fernando W.J.N., Solid heterogeneous catalysts for transesterification of triglycerides with methanol: A review, Applied Catalysis A: General, , (2009). Li M., Zheng Y., Chen Y., Zhu X., Biodiesel production from waste cooking oil using a heterogeneous catalyst from pyrolyzed rice husk,
215 Bioresource Technology, 154, , (2014). Priambodo R., Chen T.C., Lu M.C., Gedanken A., Liao J.D., Novel Technology for Bio-diesel Production from Cooking and Waste Cooking Oil by Microwave Irradiation, Energy Procedia, 75, 84-91, ( 2015 ). Sánchez-Cantú M., Camargo-Martínez S., Pérez-Díaz L.M., Hernández-Torres M.E., Rubio-Rosas E., et al., Innovative method for hydrocalumite-like compounds' preparation and their evaluation in the transesterification reaction, Applied Clay Science, 114, , (2015). Sirisomboonchai S., Abuduwayiti M., Guan G., Samart C., Abliz S., et al., Biodiesel production from waste cooking oil using calcined scallop shell as catalyst, Energy Conversion and Management, 95, , (2015). Ullah Z., Bustam M.A., Man Z., Biodiesel production from waste cooking oil by acidic ionic liquid as a catalyst, Renewable Energy, 77, , (2015). Valente J.S., Rodriguez-Gattorno G., Valle-Orta M., Torres-Garcia E., Thermal decomposition kinetics of MgAl layered double hydroxides, Materials Chemistry and Physics, 133, , (2012). Wang Y.B. and Jehng J.M., Hydrotalcite-like compounds containing transition metals as solid base catalysts for transesterification, Chemical Engineering Journal, 175, , (2011). Xu W., Gao L., Jiang F., Xiao G., In situ synthesis and characterization of Ca Mg Al hydrotalcite on ceramic membrane for biodiesel production, Chinese Journal of Chemical Engineering, 23, , (2015). 660
216 Production of Upgraded Bio-Oils by Biomass Catalytic Pyrolysis Using Low Cost Food Industry Waste Nurgul Ozbay 1*, Adife Seyda Yargic 1, Rahmiye Zerrin Yarbay Sahin 1, Elif Yaman 2 1 Bilecik Şeyh Edebali University, Faculty of Engineering, Chemical and Process Engineering Department, Gulumbe Campus, Bilecik, 11210, Turkey 2 Bilecik Şeyh Edebali University, Central Research Laboratory, Gulumbe Campus, Bilecik, 11210, Turkey * [email protected] Abstract Biomass pyrolysis is one of the promising proces to obtain energy sources and chemicals from biomass. Pyrolysis liquid product consists of complex mixtures of organic compounds and water. Their direct use as fuels may cause some difficulties due to their high viscosity, poor heating value, corrosiveness and instability. The most necessary process is upgrading pyrolytic oils to use them as conventionel fuels. Upgrading process essentially involves removal of oxygen. In this study, tomato waste pyrolysis oil was upgraded by using alumina-supported iron catalyst (Fe-Al2O3). The effect of catalyst to biomass ratio on the yields and bio-oil content were investigated. Fe-Al2O3 catalyst was prepared by using co-precipitation method. The prepared catalyst was characterized by using X-ray diffraction (XRD) measurement. The surface area, pore volume and pore size of the Fe-Al2O3 catalyst were also specified by N2 adsorption-desorption experiments. Pyrolysis performance of Fe-Al2O3 was studied to produce a valuable bio-oil from catalytic pyrolysis of tomato waste. Pyrolysis of tomato waste gave a maximum liquid yield of 24.01% at the pyrolysis temperature of 500 C, and heating rate of 10 C min 1. Use of Fe/Al2O3 catalyst caused an increase in gas yields and a decrease in liquid yields. In terms of energy recovery, 20% was the most effective catalyst to biomass ratio. Keywords: Catalytic pyrolysis, tomato waste (Solanum lycopersicum), Fe-Al2O3 catalyst I. Introduction Biomass, a renewable energy resource, could be transformed into liquid, gaseous and solid fuels or fuel precursors through biomass conversion processes, thereby decreasing the dependency on fossil fuels (Aho et al., 2010). Biomass conversion could be classified in two generic approaches: thermochemical decomposition including gasification, carbonization, liquefaction and pyrolysis processes and biological digestion essentially referring to microbial digestion and fermentation (Iliopoulou et al., 2012). Pyrolysis is a capital step of biomass thermochemical conversion as it is the first step of all the processes. Pyrolysis consists in the conversion of biomass by the action of heat in an inert atmosphere into char, gas and a liquid composed of a mixture of hundreds of oxygenated organic compounds (Collard and Blin, 2014). The highly oxygenated bio-oil can be upgraded through de-oxygenation over different catalysts (Omoriyekomwan et al., 2016; Cai et al., 2016; Aysu et al., 2016). Solid acid catalysts, i.e. zeolites, can be used for improving the quality of the bio-oil through de-oxygenation. Catalytic pyrolysis occurs in two steps: degradation of biomass and conversion of pyrolysis vapors to smaller molecules with catalyst. Biomass is heated firstly and converted into pyrolysis vapors, non-condensable gases and bio-char. After that step, the pyrolysis vapors pass over the surface of the solid catalyst on which the oxygen containing compounds can be converted into aliphatics and aromatics by deoxygenation (Aysu et al., 2016). Product yields and selectivity can be altered by the spesific function of various catalysts, thus affecting the bio-oil composition and its physical and chemical properties. Several types of microporous (e.g. zeolites: Y, ZSM-5, Mordenite and Beta) and mesoporous (e.g. MCM-41, MSU, MFI, SBA-15, MCM-48, SBA-15) materials have been studied as catalysts for the upgrading of bio-oil (Williams and Horne, 1995; Carlson et al. 2009; Park et al. 2010; Pütün, 2010; Bu et al. 2011; Jae et al. 2011; Stefanidis et al. 2011; Zhang et al. 2011; Bu et al. 2012; Melligan et al. 2012; Park et al. 2012; Zhao et al. 2013; Lee et al. 2014a; Lee et al. 2014b; Liu et al. 2014). The mechanism of oxygen removal and the yield and content of pyrolysis product are affected by the type of the catalyst. The catalyst properties play a crucial role selectivity towards higher value compounds (alkanes, phenolics, mono-aromatic hydrocarbons, etc.) while avoiding undesirable compounds (sugars, acids, poly-aromatic hydrocarbons, etc.). Selectivity can be arrenged by changing the physical and chemical properties of the specified catalyst such as surface area, pore size, impregnation of active metals, etc. Therewith, the targeted product specifications determine the selection of the catalyst that serves through the purpose of the catalytic pyrolysis (Yıldız et al., 2016). 661
217 According to the recent studies (Ying et al., 2012; Busca, 2014a; Busca, 2014b), the most active surface sites on the alumina are on edges, corners and defects of the oxide structure, the sites located on flat faces being likely less reactive. Over the defect sites the deposited species would first interact, while at higher coverages they also occupy less reactive sites. Silica is used as an additive of alumina to stabilize Al2O3 against loss of surface area. Modifying the dispersion of the active phases with a resulting modification of the final catalyst behavior can be insured the presence of small amounts of silica on the alumina support (Garbarino et al., 2015a; Garbarino et al., 2015b). To enhance the catalytic activity of Al2O3 for catalytic upgrading of bio-oils, some transition metals including noble metals such as Pt, Pd and Ru are usually loaded on Al2O3. Sulfided Al2O3-supported CoMo and NiMo catalysts are also used in the oil refineries in hydrotreating processes for the purpose of S, N, O, and metals removing from oil streams and the saturation of hydrocarbons take place. Fe-doped catalysts are much cheaper, abundant and environmental friendly than other noble metal catalysts. In addition to this, iron-doped catalysts possibly enhancing the catalytic activity or decreasing the coke deposition (Wang et al., 2012; Fermoso et al., 2012). In previous work, we have optimized the reaction parameters of tomato waste pyrolysis. The highest liquid product yield was obtained at 500 o C with the heating rate of 10 o C/min. In this study, Fe-Al2O3 was tested in a bench scale experimental unit in order to evaluate effect of catalyst to biomass ratio on product yields. Bio-oils obtained from catalytic pyrolysis experiments were also characterized by using column chromatography, elemental and FT-IR (Fourier Transform Infrared Spectroscopy) analysis. II. Experimental Facility II.1. Biomass feedstock Tomato waste was chosen as biomass feedstock obtained from Bursa located in the North West of Turkey. Air-dried biomass sample was ground in a high speed rotary cutting mill then sieved to achieve average particle size. ASTM Standart Test Methods used to investigate proximate analysis. The weight fraction of moisture content was measured in Sartorius MA 150 moisture analyzer. The volatile matter content is 77.35% while ash content is 4.49%. According to its high volatile and low ash content, tomato waste is a suitable biomass feedstock for pyrolysis process. Tab.1. Proximate analysis of tomato waste Proximate Analysis (%) Moisture 7.18 Volatile matter Fixed carbon Ash II.2. Preparation and characterization of catalytic material 5 wt.% of iron has been loaded in Fe/Al2O3 catalyst using co-precipitation method. During the synthesis of catalyst, an aqueous solution containing requisite amounts of Fe(NO3)2.9H2O and Al(NO3)3.9H2O with concentration of 0.1N each was simultaneously precipitated using an aqueous solution containing 0.25N KOH. The co-precipitated catalyst has been thoroughly washed, filtered and dried at 110 o C for 12 hours in air followed by calcination in a tubular furnace at 900 o C for 6 hours. The X-ray diffraction (XRD) (Panalytical Empyrean diffractometer) measurements were performed to measure crystal structure, with employing CuKα1 radiation (λ= nm) and operating at 45 kv and 40 ma. The XRD patterns were accumulated in the range of o 2θ every 0.02 o (2θ) with counting time 2s per step. For the determination of surface area, pore volume and pore size, N2 adsorption/desorption experiments were conducted at 196 o C, using an Automatic Volumetric Sorption Analyzer (Micromeritics, ASAP 2020). The samples were previously outgassed 300 minutes at 360 o C. II.3. Pyrolysis experiments The reactor externally heated by an electric furnace was used for pyrolysis experiments with the temperature being controlled by the thermocouples inside the bed. In the first, 15 g of air-dried biomass was placed into the reactor and the temperature was raised at 10 C min -1 to a final temperature of 500. The reactor held at this temperature for a minimum of 20 min. The liquid phase was collected in a glass liner located in a cold trap maintained at about 0 C. The liquid phase consisted of aqueous and oil phases which were separated and weighed. After pyrolysis, the solid char was removed and weighed, and then the gas yield was calculated by the difference. II.4. Characterization of bio-oil Characterization of non-catalytic and catalytic bio-oils was done by using various techniques. Elemental analysis of bio-oils was performed and the calorific value of bio-oil was calculated by Dulong s formula. In addition, column chromatography was employed and the yields of the sub-fractions were calculated. FT-IR analysis was done to specify functional group of bio-oils and sub-fractions. IV. Results and discussions IV.1. Non-catalytic pyrolysis experiments Final pyrolysis temperature is a vital parameter influencing the product yields and distrubition. The important role of temperature is to supply heat necessary for decomposition of biomass. Temperature can add synergetic effect on the liquid
218 yields due to the extended fragmentation of biomass with increasing temperature. When the temperature is increased over activation energies, biomass depolymerization extensively occurs to break bonds. This result in formation of high amount of free radicals, hence the probability of repolymerization of fragmented species increases. The role of temperature in pyrolysis is defined by hydrolysis, fragmentation and repolymerization stages of pyrolysis, while repolymerization occurs in the later stages which lead to the formation of char (Aysu et al., 2016). The distribution of products obtained by pyrolysis of tomato waste at constant heating rate of 10 o C/min and varying temperatures are given in Fig.1. As seen in Fig. 1, when temperature increased in 100 o C increments, the gas yields were increased sharply, while the solid yields decreased. The maximum liquid yield was achieved as 24.01% at the temperature of 500 o C. gaseous products while minimising char formation. that have given the highest liquid product yield were determined to be the temperatures between 500 and 550 o C (Rover et al., 2014; Shadangi and Mohanty, 2014). Catalytic pyrolysis experiments were done at 500 o C which gave the maximum liquid yield. IV.1. Catalyst characterization Porosity characteristics of Fe/Al2O3 catalyst are presented in Tab.2. The surface area of the sample used in the present study was m 2 /g. As it is shown by pore size and the meso/macropore volume data; it was highly mesoporous with few structural and textural defects that generated the observed limited microporosity. Surface area (m 2 /g) Tab.2. Porosity of the Fe/Al2O3 catalyst Micropore Pore size volume (nm) (cm 3 /g) Meso/macropore volume (cm 3 /g) XRD pattern of Fe/Al2O3 catalyst is presented in Fig. 2. The results illustrate that hercynite structure of Al2FeO4 (2θ=19.13, and 46.01) with only small quantities of Fe2O3 (2θ=66.83) was exhibited mainly in the catalysts. No separate peak for Al2O3 was noticed. It indicates that iron was well dispersed in the catalyst surface during the synthesis, resulting in the formation of hercynite structures. Fig.1. Effect of temperature on yields of tomato waste pyrolysis The liquid yields were increased at 500 o C and then slightly decreased at 600 o C. This can be explained by pyrolysis vapors expose to secondary cracking reactions at high temperatures leading to an increase in gas yields and decrease in liquid yields At lower temperatures, between 50 and 150 o C, biomass loses its moisture, generates noncombustible gases like CO2 and undergoes depolymerisation reactions involving no significant carbohydrate loss. Chemical bonds in the main constituents of biomass sample begin to break at temperatures higher than 200 o C. Breakdown of hemicellulose, which has lower thermal stablity, takes place at lower temperatures up to 300 o C forming gases like carbon monoxide and carbon dioxide. At temperatures between 350 and 500 o C cellulose breakdowns and lignin starts to decompose resulting in char, water and heavier liquid product. At higher temperatures, gasification reactions take place forming hydrogen enriched gaseous products and char undergoes further degradation by being oxidized to CO2, CO and H2O. According to these reactions it can be said that relatively low pyrolysis temperatures around 400 o C favours char formation. Temperatures up to 600 o C maximise the production of bio-oils and temperatures above 700 o C maximise 663 Fig.2. XRD pattern of the Fe/Al2O3 catalyst IV.1. Catalytic pyrolysis experiments and bio-oil characterization Fig. 3 shows the product yields for the pyrolysis of tomato waste in relation to catalyst to biomass ratio of pyrolysis at the temperature of 500 o C and heating rates of 10 o C min -1. While the oil yield was % at the catalyst to biomass ratio of 5%, then the catalyst to biomass ratio increase, the oil yield decreased to 19.07%, as expected. We found that the use of catalyst in biomass pyrolysis resulted in the reduction of the liquid yield and in the increase of the gas yield.
219 ketones. The absorption peaks within the range of cm -1 were mainly caused by the stretching vibration of C-O bond in the alkyl aryl ethers, alcohols, esters or aliphatic ethers. In general, bio-oils were mainly constituted of alcohols, aldehydes, ketones, acids, esters, ethers, aliphatics and aromatics. Fig.3. Effect of catalyst/biomass ratio on pyrolysis yields of tomato waste Elemental analyses of obtained bio-oils were given in Tab.6. As seen in table, the bio-oil obtained from non-catalytic pyrolysis run had higher carbon, higher calorific value and lower oxygen contents than the feedstock (Feedstock has 49.7% carbon, 39.1% oxygen). By comparison with the non-catalytic pyrolysis experiments, bio-oils obtained from catalytic pyrolysis runs had higher calorific values. Also, when the catalyst to biomass ratio increased, carbon content and calorific value of the bio-oils increased. The calorific values of bio-oils were between 28 and 32 MJ/kg in comparison with the low calorific value (20.47 MJ/kg) of the feedstock. The decrease in oxygen content in bio-oils may be attributed to deoxygenation reactions such as reduction of oxygen in the form of carbon monoxide and carbon dioxide during pyrolysis. The most effective catalyst to biomass ratio in improving the bio-oil quality was 20%, which increased the calorific value of bio-oil 13% compared to non-catalytic run. Tab.6.Elemental analysis of bio-oils obtained from non-catalytic and catalytic runs Catalyst/ biomass NC %5 %10 %15 %20 ratio C (%) H (%) N (%) O (%)* H/C O/C Calorific value (MJ/kg) *NC: Non-catalytic FT-IR spectra of the bio-oils with (a) %5 catalyst/biomass, (b) %10 catalyst/biomass, (c) %15 catalyst/biomass and (d) %20 catalyst/biomass ratios are given in Fig. 4. It shows that the bio-oils obtained catalytic runs have basicly same IR spectrums which showed that they were consisted of the similar chemical functional groups in the macroscopic view. It shows that the absorption peak in the range of cm -1 corresponded to alcohols or phenols with the stretching vibration of the -OH bond. The band correspond these oxygenated groups only appeared at the non-catalytic run. The vibration absorption peaks within the range of cm -1 were the absorption peaks of the skeleton structure of the aromatic C=C bond, meanwhile, the absorption peaks located within the range of cm -1 might be caused by the bending vibration of the aromatic =C-H hydrogen bonds, which indicated that bio-oils obtained catalytic run contained many aromatic compounds. Saturated alkyl hydrogen bonds vibration at cm -1, bending vibration at cm -1 and ethylenically unsaturated hydrogen stretching vibration at cm -1 indicated that bio-oils contained aliphatic hydrocarbons or other organics contained alkane or alkene groups. Absorption peak within the range of cm -1 was caused by stretching vibration of the C=O bond, which might correspond to acids or 664 Fig. 4. FT-IR analysis of bio-oils with (a) %5 catalyst/biomass, (b) %10 catalyst/biomass, (c) %15 catalyst/biomass and (d) %20 catalyst/biomass ratios Bio-oils are complex mixtures consisting of organic compounds from wide variety of chemical groups (Uzun et al., 2010). To characterize the bio-oil obtained at the catalyst to biomass ratio of 20%, they were separated into four fractions; asphaltenes, aliphatics, aromatics and polars (Tab.7). The results of the column chromatography of the bio-oil showed that the pyrolysis oil consists of 76.97% n-pentane soluble and the rest is asphaltenes. The aliphatic, aromatic, and polar fractions of the n-pentane soluble were 23.47%, 23.75%, and 47.22%, respectively. Tab.7. Results of the column chromotography for the bio-oil obtained from catalytic run n-pentane n-pentane soluble insoluble Asphaltenes Aliphatics Aromatics Polars FT-IR spectra of the bio-oil, aliphatic, aromatic and polar sub-fractions from catalytic run are given in Fig. 4. The O H stretching vibrations between 3150 and 3400 cm -1 indicate the presence of phenols and
220 alcohols. No peaks specified between these wave numbers for the aliphatic sub-fraction and this indicates that aliphatic subfraction does not contain oxygenated compounds like bio-oil. The C H stretching vibrations between 2800 and 3100 cm -1 and C H deformation vibrations between 1350 and 1475 cm -1 indicate the presence of alkanes. The C=H stretching vibrations with absorbance between 1650 and 1750 cm -1 indicate the presence of ketones or aldehydes. The absorbance peaks between 1575 and 1675 cm -1 represent C=C stretching vibrations indicative of alkenes and aromatics. azurea: Effects of operating conditions on product yields and chromatographic characterization, Bioresource Technology 205, 7 14, (2016). Bu Q., Lei H., Ren S., Wang L., Zhang Q., Tang J., Ruan R, Production of phenols andbiofuels by catalytic microwave pyrolysis of lignocellulosic biomass, Bioresour.Technol., 108, (2012). Busca, G, Chapter Three Structural, Surface, and Catalytic Properties of Aluminas, Advances in Catalysis Volume 57, , (2014). Fig. 4. FT-IR analysis of sub-fractions (a) Aliphatics, (b) aromatics and (c) Polars V. Conclusions This study involved the use of catalyst to improve either the yield or quality of liquids obtained from rapid pyrolysis of tomato waste. However, the catalyst used in this study caused only enhancement of liquid production in terms of quality not quantity. Fine chemicals, such as aromatics or light hydrocarbons can be produced this way. Pyrolysis of tomato waste gave a maximum liquid yield of 24.01% at the pyrolysis temperature of 500 C, and heating rate of 10 C min 1. Use of Fe/Al2O3 catalyst caused an increase in gas yields and a decrease in liquid yields. In terms of energy recovery, 20% was the most effective catalyst to biomass ratio. The produced bio-oil contained greater calorific value than the feedstock. Acknowledgements The authors are grateful to Bilecik Şeyh Edebali University Scientific Research Council for the financial support of this work. References Aho, A., Kumar, N., Lashkul, A.V., Eranen, K., Ziolek, M., Decky, P., Salmi, T., Holmbom, B., Hupa, M., Murzin, D.Y., Catalytic upgrading of woody biomass derived pyrolysis vapours over iron modified zeolites in a dual-fluidized bed reactor, Fuel 89, (2010). Aysu, T., Durak, H., Güner, S., A.Ş., Bengü, Esim, N., Bio-oil production via catalytic pyrolysis of Anchusa 665 Busca, G., The surface of transitional aluminas: A critical review, Catalysis Today 226, 2 13, (2014). Cai, Y., Fan, Y., Li, X., Chen, L., Wang, J., Preparation of refined bio-oil by catalytic transformation of vapors derived from vacuum pyrolysis of rape straw over modified HZSM-5, Energy 102, , (2016). Carlson T.R., Tompsett G.A., Conner W.C., Huber G.W. Aromatic production from catalytic fast pyrolysis of biomass-derived feedstocks, Topics in Catalysis, 52, (2009). Collard, F.X., Blin, J., A review on pyrolysis of biomass constituents: Mechanisms and composition of the products obtained from the conversion of cellulose, hemicelluloses and lignin, Renewable and Sustainable Energy Reviews 38, , (2014). Fermoso J., Rubiera F., Chen D., Sorption enhanced catalytic steam gasification process: a direct route from lignocellulosic biomass to high purity hydrogen Energy Environ. Sci. 5, , (2012). Garbarino G., Chitsazan S., Phung T.K., Riani P., Busca G., Preparation of supported catalysts: A study of the effect of small amounts of silica on Ni/Al2O3 catalysts Applied Catalysis A: General 505, (2015a). Garbarino G., Chitsazan S., Phung T.K., Riani P., Busca G., Preparation of supported catalysts: A study of the effect of small amounts of silica on Ni/Al2O3 catalysts, Applied Catalysis A: General 505, 86 97, (2015b). Iliopoulou E.F., Stefanidis, S.D., Kalogiannis, K.G., Delimitis, A., Lappas, A.A., Triantafyllidis, K.S., Catalytic upgrading of biomass pyrolysis vapors using transition metal-modified ZSM-5 zeolite, Applied Catalysis B: Environmental 127, , (2012). Jae J., Tompsett G.A., Foster A.J., Hammond K.D., Auerbach S.M., Lobo R.F., Huber G.W., Investigation into the shape selectivity of zeolite catalysts for biomass conversion, J. Catal., 279, (2011). Lee H.Y, Choi S.J., Park S.H., Jeon J.K., Jung S.C.,
221 Joo S.H., Park Y.K., Catalytic conversion of Laminaria japonica over microporous zeolites, Energy, 66, 2-6, (2014a). Lee E.H., Jeon M.J., Jeon J.K., Suh D.J., Park S.H., Seo B., Joo S.H., Park Y.K., In situ catalytic pyrolysis of miscanthus over modified SBA-15 catalysts using Py-GC/MS, J Nanosci Nanotechnol,14, , (2014b). Liu, C., Wang, H., Karim, A.M., Sun, J., Wang, Y., Catalytic fast pyrolysis of lignocellulosic biomass, Chem. Soc. Rev., 22, , (2014). Melligan F, Hayes MHB, Kwapinski W, Leahy JJ., Hydro-pyrolysis of biomass and online catalytic vapor upgrading with Ni-ZSM-5 and Ni-MCM-41, Energy Fuels, 26, , (2012). Omoriyekomwan J.E., Tahmasebi, A., Yu J., Production of phenol-rich bio-oil during catalytic fixed-bed and microwave pyrolysis of palm kernel shell, Bioresource Technology , (2016). Park H.J., Park K.H., Jeon J.K., Kim J., Ryoo R., Jeong K.E., Park S.H., Park Y.K., Production of phenolics and aromatics by pyrolysis of miscanthus, Fuel, 97, , (2012). Zhang H.Y., Cheng Y.T., Vispute T.P., Xiao R., Huber G.W., Catalytic conversion of biomass-derived feedstocks into olefins and aromatics with ZSM-5: the hydrogen to carbon effective ratio, Energy Environ Sci., 4, , (2011). Zhao H., Cao Y., Zhang K., Orndorff W., Chen J., Pan W., Fast pyrolysis characteristics of miscanthus over M/ZSM-5 (M=La and Ca), J Therm Anal Calorim, 113, , (2013). Wang L., Hisada Y., Koike M., Li D., Watanabe H., Nakagawa Y., Tomishige K., Appl. Catalyst property of Co Fe alloy particles in the steam reforming of biomass tar and toluene, Catal. B: Environ , , (2012). Williams P.T., Horne P.A., The effect of zeolite ZSM-5 catalyst deactivation during the upgrading of biomass derived pyrolysis vapours, J. Anal. Appl. Pyrolysis, 31, 39 61, (1995). Yildiz G., Ronsse, F., Vercruysse J., Daels J., Toraman H.E., Van Geem, K.M., Marin G.B., Van Duren R., Prins W., In situ performance of various metal doped catalysts in micro-pyrolysis and continuous fast pyrolysis, Fuel Processing Technology 144, , (2016). Park H.J., Heo H.S., Jeon J.K., Kim J., Ryoo R., Jeong K.E., Park Y.K., Highly valuable chemicals production from catalytic upgrading of radiata pine sawdust-derived pyrolytic vapors over mesoporous MFI zeolites, Appl. Catal.B 95, , (2010). Pütün E. Catalytic pyrolysis of biomass: effects of pyrolysis temperature, sweeping gas flow rate and MgO catalyst, Energy, 35: , (2010). Rover, M.R., Johnston, P.A., Whitmer, L.E., Smith, R.G., Brown, R.C., The effect of pyrolysis temperature on recovery of bio-oil as distinctive stage fractions. J. Anal. Appl. Pyrolysis 105, (2014). Shadangi, K.P., Mohanty, K., Comparison of yield and fuel properties of thermal and catalytic Mahua seed pyrolytic oil. Fuel 117, , (2014). Stephanidis S., Kalogiannis K.G., Iliopoulou E.F., Lappas A.A., Pilavachi P.A., In-situ upgrading of biomass pyrolysis vapors: Catalyst screening on a fixed bed reactor, Bioresour. Technol. 102, , (2011). Uzun, B.B., Apaydın-Varol, E., Ates, F., Ozbay, N., Putun, A.E., Synthetic fuel production from tea waste: Characterisation of bio-oil and bio-char, Fuel , (2010). Ying, X., Teijun, W., Longlong, M., Guanyi, C., Upgrading of fast pyrolysis liquid fuel from biomass over Ru/Cu-Al2O3 catalyst Energy Conversion and Management , (2012). 666

222 Numerical Investigation of Fixed Bed Downdraft Woody Biomass Gasification Ebubekir Siddik Aydin 1*, Ozgun Yucel 1, Hasan Sadikoglu 1 1 Gebze Technical University, Faculty of Engineering, Chemical Engineering, Gebze, Kocaeli, 41400, Turkey * [email protected] Abstract Gasification is a thermochemical process that deals with conversion of carbonaceous materials including biomass, fossil fuels, plastics, and coal into syngas through partial oxidation in a gasifier. The current work aims to present a thermodynamic equilibrium model for gasification of woody biomass in a fixed-bed downdraft gasifier under steady-state condition. In the present study, a stoichiometric and a non-stoichiometric model were constructed and solved. The equilibrium models of the gasification process are used in order to predict the composition of the syngas and its associated calorific value. The predicted values were validated with the experimental data, and the agreement between theoretical predictions and experimental results is good. Keywords: Gasification, biomass, downdraft gasifier, modeling I. Introduction Energy resources such as coal, petroleum and natural gas are being consumed at an accelerated rate with fear of depletion in the near future. In order to solve energy demand and reduce the high level of air pollution, the clean energy resources and technologies are crucial and gaining importance. One of these technologies, gasification being highly efficient and environmentally friendly has received significant attention. Azargohar et al. (2015). Gasification is a thermochemical process that deals with conversion of carbonaceous materials including biomass, fossil fuels, plastics, and coal into syngas through partial oxidation in a gasifier. Gasification is a successful option for the waste management, energy production from non-conventional feeds like forest waste, agricultural waste, poultry waste, and municipal solid waste and production of valuable chemicals. Gasification makes valuable low value feedstocks by converting them into marketable fuels and products. The conversion process of gasification is affected by a number of factors and events such as amount of oxidant, feedstock composition, gasifier temperature, reactor geometry and direction of gas-solid contact. Basu (2000). The gasifier design can be optimized either based on experimental data or using mathematical models of the gasification process in the reactor. The experimental approach, though most reliable, is not always practical and satisfactory. Modeling is very effective in optimizing the operation of an existing gasifier, and in exploring operational limits. A good model could help in identifying the sensitivity of the gasifier performance, to the variation in different operating and design parameters. Mathematical models and simulation can reduce the effort of expensive and complicated experiments. Models can save money and time by supporting preparation and optimization of experiments. Patra (2015). Gasifiers are divided into three principal type: fixed beds, fluidized and entrained suspension gasifers. Among these, fixed bed gasifiers are the oldest and most common reactors used to produce syngas. Easy construction and simple operation made fixed bed gasifiers preferable and they widely used and studied. Gasifiers also classified as updraft, downdraft and crossdraft depending upon the direction and entry of oxidizing agent flow. In a downdraft gasifier, the solid fuels and air move in the downward direction in the lower section of the gasifier. A series of temperature dependent thermochemical conversions of carbonaceous material occurred inside the gasifier. The carbonaceous material undergoes several different processes in pasing through four zones based on operation: i) drying zone, ii) pyrolysis zone, iii) combusiton zone, iv) reduction zone. Figure 1 shows the different zones in the process of gasification in downdraft gasifier. Figure 1. Different zones of in the process of gasification in downdraft gasifier 667
223 These type of gasifiers are suitable to handle solid fuels having ash and moisture content less than 5% and 20%, respectively Pathak et al. (2008). The syngas from downdraft gasifier has lesser tar content (<1%), higher temperature around 700 o C and more particulate matter than from an updraft gasifier. Anjireddy (2011). The downdraft gasifier is ideal when clean gas is desired. The thermochemical equilibrium approach can be used to any gasification system by constructing either stoichiometric or non-stoichiometric model. Mendiburu et al. (2014). The stoichiometric method is based on a number of chosen chemical reactions to calculate the equilibrium constants. The non-stoichiometric method is known as the Gibbs free energy minimization. When a number of simultaneous reactions are required to determine equilibrium composition, the non-stoichiometric method gives the direct and general solution. In previous studies, the researchers have been carried out many equilibrium methods. One of the prior reports proposing the stoichiometric equilibrium was presented by Zainal et al. (2001). They used a stoichiometric equilibrium modeling to predict the output of gasification process in a downdraft gasifier. The syngas composition and the calorific value had been determined. The effect of initial moisture content in the wood and the temperature effect on the calorific value had been investigated in their work. In addition this, Mendiburu et al. (2014) developed a non-stoichiometric equilibrium model to study parameter effect in the gasification process of a feedstock in a downdraft gasifier. Equivalence ratio, gasification time and carbon efficiency were considered in their work. In the present work, the thermochemical equilibrium modelling of downdraft gasifiers was constructed by using the stoichiometric and non-stoichiometric methods and the predicted values were validated with the experimental data. I.1. The stoichiometric equilibrium model The stoichiometric equilibrium model has been developed based on following assumptions. i) The biomass consists of carbon, hydrogen, oxygen and nitrogen only. ii) Gasifier is thermodynamically equilibrium and the carbon content conversation to gaseous form is full. iii) The syngas includes CO, CO2, H2, CH4, N2 and H2O. iv) The gasifier is completely adiabatic and there is no heat loss from the gasifier. The model reactions are as follows: C+CO2=2CO (1) C+H2O=CO+H2 (2) 668 C+2H2=CH4 (3) Boudouard (Eq.1) and Steam carbon reaction (Eq.2) combine into water-gas shift reaction. It is given below as Equation 4. CO+H2O=CO2+H2 4) The stoichiometric equilibrium model utilises several complex reaction of gasification and one global gasification reaction. The global gasification reaction can be written in the following form: CHxOyNz+mwH2O+Xg(O2+3.76N2)=X1CO+X2H2 +X3CO2+X4H2O+X5CH4+(0.5z+3.76Xg)N2 (5) As shown above, six unknowns (X1, X2, X3, X4, X5, Xg) are required to determine the syngas composition. Therefore six equations should be constructed Carbon balance: X2+X3+X5=1 (6) Hydrogen balance: mw+x=x1+x4+2x5 (7) Oxygen balance: mw+y+2xg=x2+2x3+x4 (8) The equilibrium constants for methane formation (Eq. 3) and water-gas shift reaction (Eq.4) can be written in terms of their molar composition. They are given below: K1=(X5)/(X1 2 ) (9) K2=(X1X3)/(X2X4) (10) Energy balance is as follows: Hreactants=Hproducts (11) i ni[h 0 f,i + H T 298 ] = ni[h i,reactant i f,i 0 + H 298 T ] i,productloss (12) I.2. The non-stoichiometric equilibrium model The non-stoichiometric equilibrium model is based on the minimization of Gibbs free energy. Gibbs free energy is a linear combination of chemical potential of each component in the system and its form is given below: i=k G = i n i μ i (13) the chemical potential is of species is: μ i = RT [ln ( P P 0 ) + ln(xi) + G i 0 (T, P 0 )] (14) Gibbs free energy can be written in terms of formation and fugacity. i=k G = n i RT [ln ( P i ) + ln(xi) + G 0 P i (T, P 0 )] (15) 0 Under the determined temperature and pressure

224 conditions, at the state of equilibrium, Gibbs free energy should be minimum. In order to minimize the Gibbs free energy, Lagrange multipliers approach is applied for this constrained optimization problem because of better results compared to other approaches. II. Experiment Woody biomass gasification experiments were conducted on a 10 kw downdraft fixed-bed gasification system which is developed by All Power Labs Inc. The scheme for the gasification system is illustrated in Fig. 2. Yucel and Hastaoglu (2016). Conductivity Detector. Gas is also collected and analyzed using a GC-7890A. Finally, theflue gas is burnt out with a swirl burner. III. Numerical procedure The stoichiometric equilibrium model equations (Eq.6-11) were solved using Newton-Jacobi iteration in Matlab program. The ultimate analysis result of feedstock was used to establish the stoichiometric equilibrium. The initial input paramaters of the syngas components were determined randomly and an iterative procedure was applied for a desired gasification temperature. At the non-stoichiometric equilibrium model solution, the amount of woody biomass contents obtained from the ultimate analysis must be equal to the syngas components amount. N A j = i=1 a i,j n i (16) ai is the number of atoms of the j element and Aj is the total number of atoms of jth element in reaction mixture. The main objective of this approach is to find the values of ni such that the Gibbs free energy will be minimum. Lagrange multiplier method is the most favourable and satisfactory way to solve these equations [15]. Thus, the Lagrange function (L) is in the following form: K N L = G j=1 λ j ( i=1 a i,j n i A j ) (17) λ is Lagrangian multipliers and when the partial derivatives of Lagrange function are zero the state of gasification at the point of equilibrium. δl δn i =0 (18) Equation 16 and 17 solved to in order to obtain the syngas compositon by Newton-Raphson method. Figure 2. Gasifier geometry IV. Results and discussions Wood pellets used in the experimental runs had according to the elemental analysis 50.67% C; 6.18% H; 2% N; 0.18% S and the rest was O. The cylindrical pellets were roughly between 1 and 1.5 cm in size. Temperatures at 6 different heights inside the gasifier were measured with a group of 6 in-line K-type thermocouples with 8 mm diameter. Two groups of thermocouples were located at the center and 5 cm off center. The gasifier was ignited by a butane torch from the ignition port until white flue gas is seen at the outlet. The gas obtained from the gasifier enters the cyclone and packed bed filter after traveling between the inner and outer walls of the gasifier. Particulates are removed while passing through the cyclone and the tar is collected by packed bed filter. Afterwards, a portable infrared syngas analyzer, Wuhan Cubic Syngas Analyzer Gas board 3100P, was used for the measurement of the concentrations of CO, CO2, CH4, H2 and O2 in the sample gases simultaneously while heating value (calorific value) is calculated automatically by an NDIR and Thermal 669 The stoichiometric and non-stoichiometric models were constructed in order to use for the gasification of woody biomass. Both models were compared to with experimental data and published experimental works on downdraft gasifiers for validation. Ultimate and proximate analysis of woody biomass used for model validation is given in Table 1 and 2. Tab. 1: Ultimate analysis of feedstocks Biomass C H O N S Wood pelet (Ozgun et. al) Wood chips (Ozgun et. al) < Wood chips (Son et. al) Tab. 2: Proximate analysis of feedstocks Biomass VM FC Ash MC Wood pelet (Ozgun et. al) Wood chips (Olgun et. al) Wood chips (Son et. al)
225 The previous published work, Yucel (2016), Olgun, Ozdogan et al. (2011) and Son, Yoon et al. (2011), have been used for the comparison and validation of predicted results. The researchers studied the gasification of wood pelet, wood chips, wood chips respectively in a downdraft gasifier. Validation and comparison of the results of stoichiometric and non-stoichiometric models with theoretical and experimental data by aforementioned researchers are given in Table 3-5. Tab. 3: Validation and comparison of the models with theoretical data by Ozgun et al StoichModel NonStoichModel Model1 H CO CO CH N T o C ER RMS Tab. 4: Validation and comparison of the models with experimental data by Olgun et al StoichModel NonStoichModel Exp1 H CO CO CH N T o C ER RMS Tab. 5: Validation and comparison of the models with experimental data by Son et al StoichModel NonStoichModel Exp2 H CO CO CH N T o C ER RMS It can be observed that stoichiometric and non-stoichiometric models have the RMS values of 3.15 and 3.18 respectively in Table 3. A transient kinetic and transport model has been introduced for the first time in a throated downdraft gasifier by Yucel et al. (2016). In reference to kinetic model results, the stoichiometric and non-stoichiometric results have considerably low RMS values. In Table 4, the comparison of the models with experimental data by Olgun et al., the non-stoichiometric model showed a good accuracy than the stoichiometric model. The RMS values are 4.84 and 3.90 respectively. The last comparison considers the experimental results presented by Son et al. for wood chips and results obtained are presented in Table 5. The models present RMS values 3.46 and 3.48 respectively. V. Conclusions The stoichiometric and non-stoichiometric models were constructed to predict the syngas composition and lower heating value of woody biomass. The prediction of the equilibrium models were validated with the theoretical and experimental works in the literature and the agreement is good. Furthermore, these models could be used to evaluate the performance and behavior of a downdraft gasifier under different process conditions. Nomenclature G : Gibbs free energy n : Number of moles for component N : Number of elements P : Absolute pressure R : Universal gas constant T : Temperature Greek letters λ : Lagrange multipiers : Chemical potential Subscripts i : Component in the syngas References Anjireddy Bhavanam, R. C. S. (2011). "Biomass Gasification Processes in Downdraft Fixed Bed Reactors: A Review "International Journal of Chemical Engineering and Applications 2(6). Azargohar, R., R. Gerspacher, A. K. Dalai and D.-Y. Peng (2015). "Co-gasification of petroleum coke with lignite coal using fluidized bed gasifier." Fuel Processing Technology 134: Basu P., C. K., Jestin L. (2000). Boilers and burner. New York, Springer&Verlag. Mendiburu, A. Z., J. A. Carvalho Jr, R. Zanzi, C. R. Coronado and J. L. Silveira (2014). "Thermochemical equilibrium modeling of a biomass downdraft gasifier: Constrained and unconstrained non-stoichiometric models." Energy 71: Olgun, H., S. Ozdogan and G. Yinesor (2011). "Results with a bench scale downdraft biomass gasifier for agricultural and forestry residues." Biomass and Bioenergy 35(1): Pathak, B. S., S. R. Patel, A. G. Bhave, P. R. Bhoi, A. M. Sharma and N. P. Shah (2008). "Performance evaluation of an agricultural residue-based modular throat-type down-draft gasifier for thermal application." Biomass and Bioenergy 32(1): Patra, T. K. and P. N. Sheth (2015). "Biomass gasification models for downdraft gasifier: A state-of-the-art review." Renewable and Sustainable Energy Reviews 50: Salaices, E. (2010). 670
226 Son, Y.-I., S. J. Yoon, Y. K. Kim and J.-G. Lee (2011). "Gasification and power generation characteristics of woody biomass utilizing a downdraft gasifier." Biomass and Bioenergy 35(10): Yucel, O. and M. A. Hastaoglu (2016). "Kinetic modeling and simulation of throated downdraft gasifier." Fuel Processing Technology 144: Zainal, Z. A., R. Ali, C. H. Lean and K. N. Seetharamu (2001). "Prediction of performance of a downdraft gasifier using equilibrium modeling for different biomass materials." Energy Conversion and Management 42(12):
227 Influence of Boron Loading Sequence on HDS Catalyst Activity Yesim Dusova-Teke 1*, Esra Yonel-Gumruk 1, Orhan Ozcan 2,3, M. Efgan Kibar 2,3, A. Nilgun Akin 2,3 1 Turkish Petroleum Refineries Corporation, R&D Department, Izmit Turkey 2 Kocaeli University, Chemical Engineering Department, 41380, Kocaeli, Turkey 3 AYARGEM, Alternative Fuels R&D Center, Kocaeli University, 41040, Kocaeli, Turkey * [email protected] Abstract Hydrodesulfurization (HDS) is an important refinery process which converts the sulfur compounds present in crude oil into H2S. The produced H2S is then removed from products using other methods. Environmental regulations strengthen each year for the removal of sulfur compounds present in fuel. These factors increase the extensive study of HDS catalysts in catalyts research area that focuses on the production of environmentally friendly fuels. The most widely used catalyst support for HDS studies remains alumina due to its excellent mechanical and dispersing properties (Topsøe, 1996). The supported metal catalyst are prepared by incipient to wetness impregnation method using cobalt (II) nitrate hexahydrate and ammonium heptamolybdate tetrahydrate as metal precursors. To improve the catalytic performance of CoMo/Al2O3 catalyst, boron (boric acid) is added to the catalyst. The aim of this work is studied the influence of the sequence of boron loading on HDS activity. Boron compound is implemented by altering impregnation sequence of the metal precursors. In order to understand the comparison of the effect of impregnation sequence of boron loading three different impregnation sequence method was used. In the first method, boron is impregnated first followed by co-impregnation of Co and Mo metals onto the catalyst support. In the second method, boron is impregnated first followed by impregnation of Co and Mo metals sequentially onto the catalyst support. In the third method, Co is impregnated first, Mo is impregnated next and boron is impregnated last onto the catalyst support.the synthesized catalysts are characterized by BET and XRD techniques. The catalytic activity of the catalysts is measured by fixed-bed reactor operating at 70 bar and 350 o C. The reactor is filled with SiC to minimize the dead volume of the reactor. Pre-sulfiding is done to enhance the catalyst activity in hydrodesulfirization reaction. The reaction is carried out in the precence of hydrogen to remove sulfur from hydrocarbon molecules. The sulfur content in the feed stock (diesel) is 6123 pm. The results showed that addition of boron compound on CoMo/Al2O3 catalyst was affected the HDS activity. Additionally, the effect of boron loading sequence is observed by the comparison of HDS activity over each prepared catalyst. It is important for a catalyst to remove sulfur and keep the diesel component in product stream. Keywords: Catalytic activity, boron, alumina, HDS catalyst I. Introduction Today, hydroprocessing applications has an important role in refinery technologies. A great deal of research in the field of heterogeneous catalysis used in hydroprocessing reactions is being devoted for the production of ultra clean gas oil. Hydroprocessing catalysts are required to address environmental restrictions imposed on the content of fuels which leads research into more selective catalyst recipes (Wang,2007). For many years, bimetals (cobalt molybdenum and nickel molybdenum) supported onto Al2O3 has been used as hydrotreating catalysts. Recently, in order to enhance the catalyst performance, silica-alumina materials is also used as support material (Marafi,2010). Developing catalyst with high activity and stability plays an important role in petroleum refining industry. By changing the support properties (surface area, pore volume, acidity), the activity and the selectivity of a catalyst can be controlled. In literature, it has been shown that addition of additives such as boron to CoMo/Al2O3 and NiMo/Al2O3 catalysts improves the performance of the catalyst in hydrotreating reactions. The main 672 idea behind the incorporation of additives (boron) to the support is that boron constrains the interaction between metal phase and support, therefore hardly sulfidable CoAl2O4 and Al2(MoO4)3 cannot be formed. Moreover, boron addition seems to have positive effect on the acidic sites, hydrogenation activities, metal dispersion and surface properties of the catalysts (Ferdous,2004; Li,1998; Giraldo,2008; Maity,2011). In addition to the above mentioned properties, boric acid has been shown to react with Al-OH groups to form a boria over layer which stabilizes the structure and creates Al-O-B bridge, leading to a formation of surface B-OH groups (Saih,2009). In this study, to enhance the catalyst properties the effect of boron as well as the effect of nano-alumina has been studied. The preparation method and conditions were optimized to obtain a support with high surface area using sol-gel method. The conditions that were optimized were boric acid concentration, hydrolysis ratio, nitric acid and metal alkoxide concentration.

 which was dissolved in 1-propanol.")

228 II. Experimental Facility Aluminum isopropoxide (Sigma-Aldrich), 1-propanol (Merck), nitric acid (Merck), cobalt(ii)nitrate hexahydrate (Merck) and ammonium heptamolybdate tetrahydrate(merck) were used as obtained. Commercial catalyst was obtained from China. II.1. Catalyst Preparation The catalysts used in this study were prepared by sol-gel and impregnation methods. A sol-gel process was developed to prepare mesoporous nano alumina supports with high BET surface area (598m 2 /g). The sol-gel precursors for Al2O3 were aluminum isopropoxide (AIP) which was dissolved in 1-propanol. Deionized water was added to the solution so that hydrolysis ratio was 15 and the temperature was adjusted to 85 o C. Following that, nitric acid was used as a catalyst to speed up the sol-gel reactions. All prepared samples were aged for 2 days to grow the occurred network encapsulating the solution and dried in an oven at 100 o C for 24 hours. Calcination step was done at 500 o C for 3 hours in a muffle furnace. All catalysts were prepared by impregnation of boric acid solutions at different concentrations onto alumina. Cobalt and molybdenum metals were impregnated onto the boria-alumina support by using cobalt(ii)nitrate hexahydrate and ammonium heptamolybdate tetrahydrate as precursors. To be able to make a pellet of support material, following recipe is applied after trying multiple recipes. First 2 different kinds of zeolites (zeolite-1 - USY Type and zeolite-2 - ZSM-5 Type), colloidal silica and synthesized alumina are well mixed together until uniform dough is obtained. The dough is fed to the extruder to obtain a cylindrical shape pellets.the pellets are dired at 100 o C for 24 hours and calcined at 500 o C for 3 hours. This final recipe includes 2 grams of synthesized alumina, 3 ml of colloidal silica, 0.5 grams of zeolite-1 and 0.5 grams of zeolite-2. The details of the extrusion procedure can be seen in Figure 1. alumina. To able to compare the effect of boron, reference catalyst was also loaded with boric acid. Fig. 2: Alumina support material powder form (a) extruded-pellet support material (b), CoMo loaded CoMo/B-Al2O3 (c) II.2. Reaction System Synthesized catalysts and the reference catalyst were tested in Plug Flow Reactor (PFR) system (Figure 3). The operational parameters are given in Table 1. Diesel feed with high sulfur content (6123 ppm) is fed to the reactor and the hydrodesulfurization reaction was performed in presence of the catalyst. The product is collected within periods and the sulfur removal as well as the cracking activity is studied using Antek Multitek elemental analyzer, ED-XRF and GC-SIMDIS. Tab. 1: Reaction conditions for hydroprosessing reactions Reactor Volume 63 ml Catalyst Volume 16 ml Feed sulfur content 6123 ppm Temperature 350 o C Pressure 70 Bar LHSV 1.16 H2 / Feed 800 Fig. 1: Schematic pathway of extruded catalyst Boron was used in the metal phase with 1-5 wt% impregnated onto the alumina support along with Cobalt (4.4 wt%), Molibdenum (19.7 wt%) changing the sequence and the metals present each time. All of these metals were impregnated in oxide form which can be seen in Figure 2. Reference catalyst consists of CoMo supported on 673 Fig. 3: Plug-Flow Reactor System II.3. Catalyst Characterization The specific surface area, pore volume, and porosity distribution of alumina supports were obtained from nitrogen adsorption desorption isotherms, determined at 77K with an ASAP 2020 (Micromeritics) apparatus. Surface areas were calculated by the Brunauer Emmett Teller (BET)


229 method, and the pore size distribution and total pore volume were determined by the Barrett Joyner Halenda (BJH) method. Prior to adsorption, the samples were outgassed at 200 o C for 1h. The measurements were done using international standards namely ASTM. To be able to obtain the distillation curves of the middle distillate within the hydrocarbon range of C5-C44, product analysis were performed using PAC-GC-CNS-7890B SIMDIS analyzer in accordance with ASTM D2887. III. Results and Discussions Before each reaction, every catalyst is activated by presulfided by DMDS. Feed properties are given in Table 2. As a result of the reaction, all products were analyzed by GC-SIMDIS to obtain distillation cut point and sulfur content in each cut point. Hydratreating activity was calculated as below; Product sulfur content(ppm) HDS activity = [1 ( Feed sulfur content (ppm) )] Tab. 2: Feed properties Procedure Analysis Unit Value ASTM 2887 Sulfur content ppm 6123 ASTM 2887 Nitrogen content ppm 290 ASTM 4052 Density (15 o C) g/cm The synthesized alumina support material is mixed with zeolites and colloidal silica, then pelletized and finally metals are impregnated onto the support. The influence of boron loading sequence is determined by studying the configurations of the catalysts which were compared with a catalysts not containing boron (CoMo/Al2O3). When boron was loaded first, the catalyst was named BCoMo/Al2O3, when loaded last, it was named CoMoB/Al2O3 and when boron loaded first and CoMo was coimpregnated it was named B(CoMo)/Al2O3. Fig. 4: Sulfur content in the products due to the distillation cut points Figure 5 suggests that, boron loaded catalysts are less active in hydrocracking reactions than catalysts without boron loadings. The purpose is to crack less feed, obtain more yield on diesel like products and obtain maximum sulfur removal. Maximum amount of diesel yield was obtained using BCoMo/Al2O3 and CoMoB/Al2O3. Looking at their sulfur content, BCoMo/Al2O3 seems to have a better performance on sulfur removal. Usman et al. (Usman, 2005) mentioned that boron loading sequence does not have an effect on cracking activity but it has a prominent effect on sulfur removal activity of the catalyst. In Figure 4, it is obvious that loading boron prior to cobalt and molybdenum metals increase the sulfur removal acitivty of the catalyst by interaction of the boron with the alumina matrix and effecting the dispersion of cobalt and molybdenum metals on the support positively, thereby increasing the active sites of the catalyst (Maity, 2011). Usman et al. (Usman, 2007) also suggested that boron may change low active Co-Mo-S type I sites to high Co-Mo-S type II sites. Figure 4 shows the sulfur content of the products obtained after the hyfroprocessing reaction by using boron either before or after the cobalt-molibdenum metals. When boron was loaded before CoMo metals, HDS activity was found to be 99%, whereas when it was loaded at last HDS activity was calculated as 96%. It is obvious that boron changes the dispersion of CoMo metals on alumina support and finally improves HDS activity. Fig. 5: Products distillation cut point of the catalyst with different boron loading sequence Boron loaded catalyst was compared with commercial catalyst (CoMo/Al2O3) which doesn t contain boron. It was also compared with boron loaded on the commercial catalyst. Figure 6 shows 674
")
230 the influence of boron loading. Boron addition improves the diesel yields while keeping diesel HDS activity. However the total sulfur content which is given in Figure 7 of the product was increased Acknowledgements This work was funded by Turkish Petroleum Refineries Corporation and TUBITAK (ARDEB 1003) with project number 213M194. Nomenclature BET BJH HDS LHSV : Brauner Emmett Teller Method : Barrett Joyner Halenda Method : Hydrotrodesulfurization : Liquid Hourly Space Velocity (1/h) References Ferdous D., Dalai A. K., Adjaye J., Applied Catalysis A, 260, , (2004) Giraldo S. A. and Centeno A., Catalysis Today, , , (2008) Fig. 6: Products distillation cut point of the commercial catalyst and boron loaded commercial catalyst Li D., Sato T., Imamura M., Shimada H. and Nishijima A., Applied Catalysis B, 16, , (1998) Maity S. K., Lemus M., and Ancheyta J., Energy Fuels, 25, , (2011) Marafi M., Stanislaus A. and Furimsky E., Handbook of Spent Hydroprocessing Catalysts Elsevier, Chapter 3, 17-49, (2010) Saih Y., Segawa K., Applied Catalysis A: General, 353, , (2009) Scherzer J. ve Gruia A.J., Hydrocracking Science and Technology, CRC Press, Chapter 7, Page 96, (1996) Topsøe, H., Clausen, B.S., Massoth, F.E., Hydrotreating Catalysis Science and Technology,Vol. 11, Ed. Anderson, J.R and Boudart, M., Springer Verlag Berlin, (1996) Usman U., Takaki M., Kubota T., Okamoto Y., Applied Catalysis A: General, 286, , (2005) Fig. 7: Sulfur content in the products due to the distillation cut points as a result of hydroprocessing reactions over commercial catalyst and boron loaded commercial catalyst As a conclusion, addition of boron affect the dipersion of Co and Mo metals on the alumina support and improves HDS activity by 3%. Comparison of the boron loaded catalyst to CoMo/Al2O3, it is clear that boron affects the diesel yield positively which is very crucial in hydrotreatment refinery process. While BCoMo/Al2O3 catalyst prevents the craking of diesel feed to the light distillate, it provides the succesful sulfur removal. Usman U., Kubato T., Hiromitsu I., Okamoto Y., J. Catal, 247, 78-85, (2007) Wang D., Li W., Zhang M. and Tao K., Applied Catalysis A, 317, , (2007) 675
231 TIR TIR TIR PIR TIR TIR PIR PIR PIR TIR 2 PIR TIR 8 th International Exergy, Energy and Environment Symposium (IEEES-8), May 1-4, 2016, Antalya, Turkey Production of a Low-Sulfur Oil from Scrap Tires Pyrolysis Using a Two-Stage Pyrolysis Process and Additives Gyung-Goo Choi*, Young-Kon Choi, Joo-Sik Kim University of Seoul, Department of Energy and Environmental System Engineering, Renewable resource laboratory, 90 Jeonnong-Dong, Dongdaemun-Gu, Seoul, , Republic of Korea * [email protected] Abstract To environmentally treat scrap tires, pyrolysis has been investigated for last decades. However, the sulfur contents in the products were main obstacle to their applications. To reduce sulfur contents in the products, a newly developed two-stage pyrolysis process composed of an auger and fluidized bed reactor were applied in this study. In the experiments, scrap tire rubber was pre-pyrolyzed in the auger reactor at ~335 C. And then, the remainder was immediately decomposed in the fluidized bed reactor at ~500 C. In the research, the effects of sulfur absorbents, dolomite and olivine, were investigated additionally. CaO was also mixed with the feed material to further reduce the sulfur contents in pyrolysis products. Because the product yields from the auger reactor were very small, the products from the fluidized bed reactor were mainly investigated. It could be confirmed in the study that the two-stage pyrolysis process along with additives could significantly reduce the sulfur contents of pyrolysis products. Keywords: Scrap tires, Pyrolysis, Two-stage pyrolysis process, Desulfurization I. Introduction As the result of economic growth, the generation of wastes has increased. Scrap tires is posing a representive waste problem today. In worldwide, over 5 million tons of scrap tires are generating (Fung et al., 2012). Because of their natural indegradable property, its management is difficult. The traditional waste treatment methods, such as landfill and combustion, are originally associated with social and environmental problems, needing a lot of space and generating large amounts of harmful gases. Pyrolysis is one of alternative methods for scrap tire treatment. It produces useful products. The gas product having a high caloric value can supply the energy requiring for pyrolysis operation. Liquid product has received attention as an alternative fuel and/or limonene source. Char can be used as recycled carbon black or be activated to produce activated carbon (Martínez et al., 2013). In particular, much research has been conducted to recover liquid fuel from scrap tires by pyrolysis and to utilize it or its blend with diesel fules in engines. However, the high sulfur content of fresh pyrolysis oils derived from scarp tires must be overcome for the oil to be used. The sulfur compounds in pyrolysis oil are mainly derived from the vulcanization agent. To reduce the sulfur content in pyrolysis oil, many trials, especially using absorbents, have been attempted. It proved that metal oxides of absorbents could bond with hydrogen sulfide (Slimane and Abbasian, 2001; Aydın and İlkılıç, 2012). Our group recently developed a two-stage pyrolysis process to remove sulfur in stages. The main idea for the development was based on the fact that sulfur bonds in tires could be broken at lower temperatures compared to the temperatures at which other bonds in tires are broken (Lanteigne et al., 2015). In this study, different kinds of fluidized bed materials and CaO absorbent were applied in the twostage pyrolysis process to decrease the sulfur contents of pyrolysis products. II. Experimental Facility II.1. Setup Feed material Scrap tire rubber was obtained from a tire recycling company in South Korea. The size used in this study was in a range of 1 2 mm. The feed material mainly consisted of volatile matter (~76.1 wt.%) and fixed carbon (~19.4 wt.%). Ash in the feed material was composed of Zn, Ca, K and Fe. The sulfur content was ~2.5 wt.%. Pyrolysis process Fig. 1 shows a diagram of the twostage pyrolysis process. M Silo Vibrator Screw M Screw 2 Air Jaket Water Container (Liquids) Steel Condenser Heater Heater Impact separator Auger Reactor Electrostatic Filter Container (Liquids) 1 Fluidized Bed Reactor Pre Heater Heater Heater Cyclone Pre Heater Fig. 1: Diagram of the two-stage pyrolysis process. Hot filter Water Container (Liquids) Steel Condenser Compressor N Container (Liquids) Glass Condenser EtOH Impact separator Gas meter 3 Electrostatic Filter Gas sampling Container (Liquids) Check Valve Flare 676
232 The process had a feeding system, two reactors, a char separating system and a liquid recovery system. The feed material first enters the auger reactor made of a 310 S tube and heated by an electric heater with the help of a screw feeder. The auger reactor has an inner diameter of 28 mm and a length of 700 mm. The product recovery system after the auger reactor consisted of a steel condenser (20 C; water-cooled), an impact separator (IS) and an electrostatic precipitator (EP). The IS and EP can capture high molecular weight compounds and aerosols, repectively. The fluidized bed reactor connected to the auger reactor has a height of 50 mm and an inner diameter of 110 mm. The vapor leaving the fluidized bed reactor passes a char separating system consisting of a cyclone and a ceramic filter which were designed to capture particles bigger than 10 and 2 μm, respectively. The pyrolysis gas leaving the char separation system passes through a liquid recovery system consisting of two steel condensers, IS and EP. One of two condensers is water-cooled (20 C) and the other is ethanol-cooled (-20 C). Additionaly, a compressor (N0150ATE, KNF) pushes the pyrolysis gas from EP into the fluidized bed reactor. To separate pyrolysis vapor from each reactor, a gas inlet is applied at the demarcation between auger and fluidized bed reactors, where a stream of compressed pyrolysis gas is supplied. Pyrolysis conditions In each experiment, 400 g of scrap tire rubber was fed. Total operation time was ~80 min, and feed rate, therefore, was ~5 g/min. The reaction temperatures of auger and fluidized bed reactors were ~338 C and ~520 C, respectively. The applied fluidized bed materials were natural dolomite, natural olivine, and calcined olivine. 3.2 kg of fluidized bed material was used in each experiment. Detailed experimental conditions are shown in Tab. 1. Tab. 1: Experimental conditions Reator Parameters D1 O1 O2 O3 d Auger Reaction temperature ( C) Reaction temperature ( C) Fluidize Flow rate d bed (NL/min) Bed material D a O b CO c CO c a natural dolomite b natural olivine c calcined olivine d feed material mixed with 60 g of CaO The column was HP-5MS and helium gas was used in the analyzer as the carrier gas. The peak identification was conducted using a libray (NIST, Wiley). The relative response factors (RRFs) of each compound were calculated using a reference value. And then, the RRFs were multiplied by the peak area detected by GC-FID (Jung et al., 2012). All the gas products were analyted using a gas chromatography thermal conductive detector (GC- TCD) and GC-FID. The columns in the GC-TCD and GC-FID were Carboxen 1000 and HP-plot Al2O3/KCL, respectively. The carrier gas was argon. To dectect the sulfur contents in liquid product and char, an elemental analyzer was used. A thermogravimetric analyzer was applied to explore the thermal degradation characteristics of the feed material. III. Results and discussions TGA and DTG curves of the feed material are presented in Fig. 2. Normalized mass to initial mass Temperature ( o C) 5 o C/min 10 o C/min 20 o C/min Fig. 2: TG and DTG curves of the feed material. Thermal degradation of the sample took place within a wide range from C. The first weight loss at C was attributed to the degradation or volatilization of additives. The additives used in tire manufacturing process were mainly vulcanization agents. The second and third weight losses appeared due to the thermal cracking of styrene-butadien rubber and butadiene rubber which are the main components of tire rubber (Choi et al., 2014). Based on the TGA results, the reaction temperature of auger and fluidized bed reactors were set over 200 and 500 C, respectively. The product yields of each pyrolysis experiment are shown in Tab Derivative weight change (%/min) II.2. Measurements All the liquid products from the fluidized bed reactor of the two-stage pyrolyzer were distillated in laboratory distillation apparus. The distillations were performed under a reduced pressure environment (210 C, 13.3 kpa). After distillation, liquid was separated into a light and a viscous phase. The light phase was designated as pyrolysis oil, while viscous phase as distillation residue. For the quantitative and qualitative analysis of pyrolysis oil, gas chromatography-flame ionization detector/mass spectroscopy (GC-FID/MS) was used. 677 Tab. 2: Product yields Reactor Product D1 O1 O2 O3 a Auger Fluidized bed Gas Liquid Char Gas Pyrolysis oil Distillation residue Char a results will presented at the conference.
233 As can be seen in Tab. 2, the product yields from the auger reactor was small compared to those from the fludized bed reactor, being at ~9 wt.%. Pyrolysis oil yield from the fluidized bed reactor ranged from wt.%. Natural dolomite used as the fluidized bed material produced more pyrolysis oil than natural and calcined olivines. In addition, gas yield was increased calcined olivine was used (O2). The sulfur contents in pyrolysis products from the fluidized bed reactor are presented in Tab. 3. Tab. 3. Sufur contents in pyrolysis products. Sulfur content (wt.%) Conditions Distillation Char Pyrolysis oil residue D1 2.98± ± ±0.05 O1 3.20± ± ±0.07 O2 2.34± ± ±0.02 O3 a a results will presented at the conference The typical sulfur contents of pyrolysis oils are reported to be ~1.0 wt.%. In this study, the lowest sulfur content of pyrolysis oil obtained in this work was 0.45 wt.%. The lowest value could be achieved when calcined olivine was applied in the two-stage pyrolysis process. FeO on the calcined olivine appeared to adsorb H2S present in pyrolysis vapor. CaO also can absorb the sulfur to further reduce the sulfur contents of pyrolysis products. As a result, it was proved that the two-stage pyrolysis process along with absorbents used as the fluidized bed material could significantly reduce the sulfur contents of pyrolysis products, especially the sulfur content of pyrolysis oil. References Aydın H., İlkılıç C., Optimization of fuel production from waste vehicle tires by pyrolysis and resembling to diesel fuel by various desulfurization methods, Fuel, 102, (2012). Choi G.G., Jung S.H., Oh S.J., Kim J.S., Total utilization of waste tire rubber through pyrolysis to obtain oils and CO2 activation of pyrolysis char. Fuel Processing Technology, 123, (2014). Fung P.P.M., Cheung W.H., McKay G., Systematic analysis of carbon dioxide activation of waste tire by fractional design, Chinese Journal of Chemical Engineering, 20(3), (2012). Jung S.H., Kim S.J., Kim J.S., Thermal degradation of acrylonitrile-butadiene-styrene (ABS) containing flame retardants using a fluidized bed reactor. The effects of Ca-based additives on halogen removal. Fuel Processing Technology, 96, (2012). Lanteigne J.R., Laviolette J.P., Chaouki J., Behavior of Sulfur during the Pyrolysis of Tires, Energy & Fuels, 29(2), (2015). Martínez J.D., Puy N., Murillo R., García T., Navarro M.V., Mastral A.M., Waste tyre pyrolysis-a review, Renewable and Sustainable Energy Reviews, 23, (2013). Slimane R.B., Abbasian J., Utilization of metal oxidecontaining waste materials for hot coal gas desulfurization, Fuel Processing Technology, 70, (2001). IV. Conclusions In this study, a scrap tire rubber was pyrolyzed in a two-stage pyrolysis process. The yield of pyrolysis oil increased when dolomite was used as the fluidized bed material, while calcined olivine increased the gas yield. The sulfur content in pyrolysis oil was significantly reduced to below 0.5 wt.% when calcined olivine was applied as the fluidized bed material. The two-stage pyrolysis process along with the simultaneous application of minerals as the fluidized bed material and additives like CaO could further reduce the sulfur contents of pyrolysis products. Acknowledgements This research was supported by a Grant (14CHUD- C ) from Architecture & Urban Development Research Program (AUDP) funded by Ministry of Land, Infrastructure and Transport Affairs of Korean government. 678
234 Utilization of Kayseri-Menteş Iron Ore as Oxygen Carrier in Chemical Looping Combustion of Syngas: Deconvolution of the Gas Analysis Data Nesibe Dilmac 1*, Omer Faruk Dilmac 2 1,2 Çankırı Karatekin University, Engineering Faculty, Department of Chemical Engineering, Uluyazı, Çankırı, 18200, Türkiye * [email protected] Abstract Chemical Looping Combustion (CLC), is one of the most promising candidates among the current and newly developing efficient&clean energy technologies which bases on a totally different concept than conventional ones.the CLC concept can be simulated at laboratory scale studies by using an "alternating atmosphere" gas feed and determining the performance of the oxygen carrier depending on the stack gas composition. This study deals with the deconvolution procedure applied for compensating the alterative effects of residence time distribution (RTD) on stack gas composition. Keywords: Chemical looping combustion, iron ore, CO2 capture, deconvolution, simultaneous gas analysis. I. Introduction Capture and removal of CO2 from combustion gases is of great importance issue on account of greenhouse effect and global warming. Chemical Looping Combustion (CLC), is one of the most promising candidates among the current and newly developing efficient&clean energy technologies since it fulfills the fuel combustion and CO2 capture simultaneously. Owing to this advantage, it is suggested as one of the cheapest CCS (carbon capture and storage) options. As well, it offers additional attractive advantages such as; higher energy conversion efficiency and ultra low NOx emissions too (Richter and Knoche, 1983; Hossain and Lasa, 2008). The technique involves utilization of a metal oxide as an oxygen carrier which transfers oxygen selectively from combustion air to the fuel as can be seen on Figure 1 (Mattisson et al., 2004). Since the fuel is oxidized into CO2 by means of the lattice oxygen of the carrier instead of the atmospheric oxygen, fuel and air are never mixed in this technique. As a result of this situation, combustion gases are not diluted by N2 which making the sequestration of CO2 much more easier. From this aspect, CLC can be accepted as a next generation combustion technology which bases on a totally different concept than conventional ones (Tokyo Gas, 2014). The process that takes place in the fuel reactor of CLC (referred as "Reduction Half Cycle" (RHC) in this study) includes simultaneous reduction of metal oxide and flameless combustion of fuel as seen on Eq.(1). On the other hand, the process that occurs in the air reactor of CLC (referred as "Oxidation Half Cycle" (OHC) in this study), regenerates the oxygen depleted metal oxide with atmospheric oxygen and by this way completes a single (or a full) cycle as seen on Eq.(2). C n H m +Me x O y nco 2 + ( m 2 ) H 2O+Me x O y-1 (1) Me x O y-1 + ( 1 2 ) O 2 Me x O y (2) The sum of the reduction and oxidation half cycles - i.e.,a full CLC cycle- can be represented with a net reaction (given in Eq. (3)) which is basicly identical with traditional combustion reaction of any hydrocarbon with atmospheric oxygen. C n H m + (n+ m 4 ) O 2 nco 2 + ( m 2 ) H 2O (3) Fig. 1: The principle of chemical looping combustion (Harichandan and Shamim, 2014) In this regard, CLC process can be evaluated as a "splitted combustion" way that occurs in two seperate reactors concurrently. In order to simulate the CLC concept at bench-scale studies, there are two options; The first; rotating the oxygen carrier between two interconnected fluidized beds with constant air and fuel gas feeds as on Fig.1, i.e. applying circulating 679

235 fluidized bed (CFB) technology in minimised scale. Second; Fluidizing an oxygen carrier chargedsingle reactor by a gas feed that is alternating with an order as; "fuel gas purifier inert gas oxidizing air purifier inert gas", i.e. applying an alternating atmosphere CLC programme (Mattisson et al., 2001). The second approach was adopted in this study due to its conveniences in installation, design and control. As for the oxygen carrier; although there are several metal oxide candidates offered as oxygen carrier, Fe2O3 was preferred in this study, since it has a striking economical strength for its lower price, environmental benignity and higher melting point (Wang et al., 2011). Within this context, oxygen carrying performance of a native iron ore obtained from Menteş-Kayseri hematite deposits (delivered by Özkoyuncu Mining) was tested in a bench-scale fluidized bed CLC reactor which consumes syngas as fuel and air as oxidizer in a sequenced manner as explained above. Since there was no way for sampling the ore during an ongoing multicycle CLC test, the whole performance calculations were based on the stack composition data acquired by a flue gas analyzer. This paper focuses privately on enhancement of that data which include somewhat deviation due to the residence time distribution (RTD) of gases on sampling line. II. Experimental Facility II.1. Setup This study was carried out in the experimental setup, shown schematically in Figure 2. The quartz fluidized bed reactor (i.d.=22 mm, length= 1200 mm) with 570 mm of preheating zone below the porous distributor plate was electrically heated in a vertical tube furnace. The temperature of the reaction zone was measured using a K type thermocouple. Pressure sensors mounted on inlet and outlet regions of the reactor enabled to observe possible agglomeration or defluidization problems during the CLC tests. Fig. 2: The CLC experimental set-up scheme The flow rate of high-purity reactant gases (delivered by Linde Gas) i.e. CO, H2, O2 and N2, were measured by mass flow controllers (MFC, Aalborg) and the current gas (synthetic syngas i.e. CO and H2 at 1:1 volumetric ratio as fuel, N2 as purifier and synthetic air i.e. O2 and N2 mixture at 1:3,76 volumetric ratio as oxidizer) was led from gas cylinder(s) to the reactor through solenoid two-way valves. A programmable logic controller (PLC, flow control unit) that was connected with MFCs and valves conducted CLC tests by organizing gas flow traffic according to the "scenario" inputted to an interface on PC. (The "scenario" term in here corresponds to the whole procedure followed for any experiment, i.e the RHC set temperature, the RHC time, the fuel gas composition and flow rate of each component, the OHC time, the flow rate of synthetic air, the flow rate of purifier N2, number of cycles to be repeated in the experiment, parameters to be applied during the heating/cooling of the reactor at the beginning/end of the experiment like target temperature and flow rate of inert gas N2 etc.) As a batch of (approximately 5 g.) hematite particles was introduced into the reactor, the flow control unit started to run the scenario by heating the ore to the desired RHC temperature under inert N2 flow. As the set temperature was attained, the loop procedure was activated and repeated for a number of cycles that was predefined on scenario. As soon as the looping step was completed, the cooling step was actuated and the reactor was cooled to the ambient temperature under inert flow. Then, the content of the reactor i.e. the processed oxygen carrier, was transferred into sealed bottles for further structural analyzes like XRD, SEM etc. The stack gas leaving the reactor was sent to a flue 680
236 gas analyzer (ABB EL 3020) and the instantaneous composition was measured continiously via NDIR analysis of CO and CO2; thermal conductivity analysis of H2 and paramagnetic analysis of O2 species (The H2O in the stack gas was removed by a cold trap right before entering the analyzer in order to protect the sensors from hazards of humidity). The measurements transferred by analyzer to the PC were assumed as "raw data" that need to be corrected before being utilized in Eq.(5)-(8). A typical stack gas composition profile representing the data obtained during a CLC test of 50 cycles can be seen on Figure 3 (6-48 th cycles are removed from the graph due to the lack of space and the experimental conditions are given on figure). The conversion of oxygen carrier (X) is preferred to be stated in terms of the oxidation degree of the carrier -which is a function of time- as given on Eq.(4) in this study. II.2. Measurements X= m t-m red m o -m red (4) Fig.3: A typical stack gas composition profile So, the term "Xi,red." given on Eq.(5) represents the total conversion that is achieved by the end of the i th RHC prevailing between to and ti; while the term "dxi,red/dt" given on Eq.(6) represents the instantaneous conversion rate at any moment of i th RHC. Likewise, the total conversion that is achieved by the end of the i th OHC prevailing between to and ti, is represented by "Xi,oxd." (Eq.(7)); while, the instantaneous conversion rate at any moment of i th OHC is represented by "dxi,oxd/dt" (Eq.(8)). t i y COin. (y COout + yh 2out ) X i,red. = X i-1 ( (M A ) O. ṅ in ). (1- ).dt (5) m o. R OC t 0 ( y COout +y CO2out ) y COin. (y COout + y ) dx i,red. = ( (M A ) O. ṅ H2out in ). (1- ) (6) dt m o. R OC ( y COout +y CO2out ) y N2in. y O2out X i,oxd. = X i-1 + ( 2(M A ) O. ṅ in ). [ y m o. R OC O2in - ].dt (7) t 0 t i (1-y O2out ) dx i,oxd. =+ ( 2(M A ) y O. ṅ N2in. y O2out in ). [ y dt m o. R O2in - ] (8) OC (1-y O2out ) Since the RHC proceeds towards to decrease the oxidation degree of the carrier (Xi-1), the conversion rate of the carrier during any RHC has a negative 681 value. In a similar manner, since the OHC proceeds towards to increase the oxidation degree of the carrier (Xi-1), the conversion rate of the carrier during any OHC has a positive value. Note that "Xi-1" represents the oxidation degree of the carrier coming from the previous OHC/RHC. Another point to be emphasized is; the term "yj,out" represents the mole fraction of gas "j" exactly at the outlet of the reactor whose value changes by time due to the reaction in the reactor, while the term "yj,in" represents the mole fraction of gas "j" at the inlet of the reactor that can be accepted as; 0,5 for CO and H2 during RHCs; 0,21 for O2 and 0,79 for N2 during OHCs. A detailed explanation on acquirement of the correlations given on Eq.(5)-Eq.(8) and interpretation of them within the context of the CLC process are beyond the scope of this paper and can be found on elsewhere (Song et al., 2008; Fernandez, 2012; Mayer et al., 2014). However, in order to relate the current study with those equations, it can be emphasized that; determination of the instantaneous value of the stack gas composition i.e. yco,out, yco2,out, yh2,out and yo2,out accurately has a critical importance in respect of CLC studies. In this sense, it is required to have somewhat knowledge on "Residence Time Distribution" (RTD) and its effects on effluent concentration values of species on real reactors, sampling lines etc.
.")
237 II.3. Residence Time Distribution (RTD) As is known, the flow behaviour in real reactors differs from the one in ideal reactors due to the channelling, backmixing and bypassing of the products/reactants (Fogler, 2006). As a result of this situation, different fluid elements (or molecules) leave the reactor at different times and a distribution classifying the fluid elements according to their residence times i.e. the time spent by the element in the reactor, arises. The RTD is determined experimentally by injecting an inert chemical molecule or atom (tracer) into the reactor at some time (t=0) and then measuring the tracer concentration (C) in the effluent stream as a function of time (Fogler, 2006). The graph that represents the effluent tracer composition versus time is referred as "Response curve" (or C curve) which has a more flattened shape compared to the input curve as seen on Figure 4. as "the injection point" and the flue gas analyzer as "the dedection point", it can be concluded that the measured concentration value of the stack gas at any time is lower than its actual value at the outlet of the reactor. Hence, it is essential to rearrenge the effluent concentration of species by taking the RTD into consideration. In this study, the real concentration values of gasesous species at the reactor outlet were obtained by deconvolution of the measured values taken from the flue gas analyzer. For this purpose, a "deconvolution equation" given in Eq. (9) (where "t" is time, "τ" is the time constant for sampling line and "Ci" is the concentration of gas "i") was utilized in order to obtain the real concentration values by the help of the measured ones (Cheng et al., 2010; Arjmand, 2014). (C i ) real =(C i ) measured + τ. ( d (C i) measured ) (9) dt First of all, Eq. (9) was applied to "t-[o2]measured " couples (Figure 6) obtained immediately after shutting down the air flow to the reactor during an OHC; namely in a time interval of an OHC that the real oxygen concentration value ([O2]real) was equal to zero, in order to determine the time constant (τ) (Johansson, 1993; Farmery and Hahn, 2000; Fennell et al., 2007; Chuang et al., 2009, 2011; Arjmand, 2014; Liu et al., 2014). Fig.4: Input and response curves for pulse injection (Fogler, 2006) As the distance between injection and dedection points increases, the value of the peak point of the C curve decreases as seen on Figure 5 (Arnould and Hild, 2007). Fig.5: Shape of C curve versus the distance between the injection and the dedection points (Fogler, 2006) IV. Results and discussions The emission of the gaseous products and residual reactants into the sampling line lying from the exit of the reactor to the flue gas analyzer (including dust filters and cold trap) -especially during the reduction half cycles of 15 seconds in this study - resembles with the pulse injection operation seen on Figures 4 and 5. In that case by referring the exit of the reactor Fig.6: "t-[o2]measured" data couples used for deconvolution equation By making [O2]real equal to zero, Eq. (9) turned into Eq.(10). - d[o 2 ] measured = 1.dt (10) [O 2 ] measured τ By integrating Eq.(10), a linear equation (given in Eq.(11)) whose graph has a slope equal to (1/ τ) was obtained. -ln[o 2 ] measured = ( 1 ). t + (Integration constant) (11) τ Then, Eq.(11) was utilized to represent the data seen 682
238 on Figure 6 and a reasonably high linear regression coefficient (R 2 =0,98) was obtained yielding a time constant of 9,4 s as seen on Figure 7 (That procedure was repeated for other OHCs and a high repeatability was observed for all OHCs). ṅ: Molar flow rate of fuel or air [kmol/s] ROC: Oxygen carrying capacity of iron ore [-] X: Conversion or oxidation degree of oxygen carrier at any time of a RHC/OHC [-] yi: Mole fraction [-] τ: Time constant for deconvolution equation [s] References Arjmand M., Copper and Manganese-based Oxygen Carriers in Chemical-Looping Combustion (CLC) and Chemical-Looping with Oxygen Uncoupling (CLOU), PhD Thesis, Chalmers University of Technology, Göteborg, Sweden, (2014). Arnould O., Hild F., On the measurement by EDX of diffusion profiles of Ni/Cu assemblies, Microscopy and Analysis European Edition, 2000, 13-15, (2007). Fig.7: "t versus -ln[o2]measured" graph for determination of "τ" Following the determination of time constant, Eq.(9) was applied to whole stack gas composition data measured by analyser during 50 cycles of the CLC test. By this way, the real composition of each specie at the outlet of the reactor was deconvoluted, then utilized for CLC calculations given in Eq.(5)-(8) confidingly. V. Conclusions Since there was no way for sampling the oxygen carrier (iron ore) during an ongoing multicycle CLC test, the whole performance calculations were based on the stack composition data acquired by a simultaneous flue gas analyzer. The measured concentration value of the stack gas at any time was lower than its actual value at the outlet of the reactor due to the RTD. The actual concentration values at the outlet of the reactor were obtained via a deconvolution equation whose time constant is 9,4 s. Acknowledgements This research was supported by TUBITAK (Project No.: 113M548) and substantiated in laboratories of Çankırı Karatekin University. These supports are gratefully acknowledged. Nomenclature mo: Mass of the oxygen carrier in fully oxidized state [kg] mred: Mass of the oxygen carrier in fully reduced state [kg] mt: Mass of the oxygen carrier at any time of a RHC/OHC [kg] (MA)O : Atomic weight of oxygen [16 kg/kmol] 683 Cheng K. C., Acevedo-Bolton V., Jiang R. T., Klepeis N. E., Ott W. R., Hildemann L. M., Model-based reconstruction of the time response of electrochemical air pollutant monitors to rapidly varying concentrations, Journal of Environmental Monitoring, 12(4), , (2010). Chuang S. Y., Dennis J. S., Hayhurst A. N., Scott S. A., Kinetics of the chemical looping oxidation of CO by a co-precipitated mixture of CuO and Al2O3. Proceedings of the Combustion Institute, 32(2), , (2009). Chuang S.Y., Dennis J. S., Hayhurst A. N., Scott S. A., Kinetics of the chemical looping oxidation of H2 by a co-precipitated mixture of CuO and Al2O3, Chemical Engineering Research & Design, 89(9), , (2011). Farmery A. D., Hahn C. E. W., Response-time enhancement of a clinical gas analyzer facilitates measurement of breath-by-breath gas exchange, Journal of Applied Physiology, 89(2), , (2000). Fennell P.S., Davidson J. F., Dennis J. S., Hayhurst A. N., Regeneration of sintered limestone sorbents for the sequestration of CO2 from combustion and other systems, Journal of the Energy Institute, 80(2), , (2007). Fernandez A. C., Chemical Looping Combustion of Coal Using Ilmenite as Oxygen Carrier, PhD Thesis, University of Zaragoza, Zaragoza, Spain, (2012). Fogler, H. S., "Elements of Chemical Reaction Engineering (4 th Edition)". New Jersey: Pearson Education, (2006). Harichandan A. B., Shamim T., Effect of fuel and oxygen carriers on the hydrodynamics of fuel reactor in a chemical looping combustion system, Journal of Thermal Science and Engineering Applications, 6(4), 1-8, (2014). Hossain M. M., Lasa H. I.,. Chemical looping
239 combustion (CLC) for inherent CO2 seperations-a review, Chemical Engineering Science, 63, , (2008). Johansson M., Berglund M., Baxter D. C., Improving accuracy in the quantitation of overlapping, asymmetric, chromatographie peaks by deconvolution: Theory and application to coupled gas chromatography atomic absorption spectrometry, Spectrochimica Acta Part B: Atomic Spectroscopy, 48(11), , (1993). Liu W., Lim J. Y., Saucedo M. A., Hayhurst A. N., Scott S. A., Dennis J. S., Kinetics of the reduction of wustite by hydrogen and carbon monoxide for the chemical looping production of hydrogen, Chemical Engineering Science, 120, , (2014). Mattisson T., Lyngfelt A., Cho P.. The use of iron oxide as an oxygen carrier in chemical looping combustion of methane with inherent separation of CO2, Fuel, 80(13), , (2001). Mattisson T., Johansson M., Lyngfelt A., Multicycle reduction and oxidation of different types of iron oxide particles-application to chemical-looping combustion, Energy & Fuels, 18(3), , (2004). Mayer F., Bidwe A., Schopf A., Taheri K., Zieba M., Scheffknecht G., Comparison of a new micaceous iron oxide and ilmenite as oxygen carrier for chemical looping combustion with respect to syngas conversion, Applied Energy, 113, , (2014). Richter H. J., Knoche K. F., Efficiency and Costing Second law analysis of processes. Editor: Gaggioli R. A. Washington D. C.: ACS Symposium Series, (1983). Song Q. L., Xiao R., Deng Z. Y., Shen L. H., Xiao J., Zhang M. Y., Effect of temperature on reduction of CaSO4 oxygen carrier in chemical-looping combustion of simulated coal gas in a fluidized bed reactor, Industrial & Engineering Chemistry Research, 47(21), , (2008). Wang S., Wang G., Jiang F., Luo M., Li H., Chemical looping combustion of coke oven gas by using Fe2O3/CuO with MgAl2O4 as oxygen carrier, Energy&Enviromental Science 3(9), , (2010). 684
240 Pyrolysis of Waste Polyethylene Plastics and Investigation of the Fuel Potential of Pyrolysis Products Merve Sogancioglu 1, Esra Yel 1, Gulnare Ahmetli 2 1 Selcuk University, Environmental Engineering Department, Konya-Turkey 2 Selcuk University, Chemical Engineering Department, Konya-Turkey * [email protected] Abstract Pyrolysis products of plastic wastes plays an important role for utilization in energy production. The thermal treatment methods have been environmentally friendly ways for the transformation of plastic wastes into valuable products such as chemicals or fuels. The upgrading of these waste materials to hydrocarbon mixtures by pyrolysis techniques have received much attention because these might allow the reduction of the volume of waste, the recovery of chemicals and the replacement of fossil fuels. In this study, high density polyethylene (HDPE) and low density polyethylene (LDPE) plastic wastes were collected, some portion of each were washed in field-simulated laboratory scale system. Both washed and unwashed plastic waste samples were pyrolyzed at fixed bed reactor pyrolysis equipment at various temperatures (300, 500, 700 C). The effect of plastic type, pyrolysis temperature and plastic washing process on the pyrolysis oil and gas quality were investigated. Pyrolysis fluids were analyzed by gas chromatography coupled with a mass spectrometry detector (GC-MS). The heat values were determined using an automatic calorimetric bomb. Both the washed and the unwashed samples of HDPE and LDPE yielded oils with heavy hydrocarbons (C10-C40). Heating values were between kcal. Pyrolysis gases of both wased and unwashed HDPE and LDPE mainly contain gas samples contained pentene, pentane, hexane, benzene, heptane, toluene, octane, ethylbenzene and styrene. Each of these components have potential for use as fuel or as raw materials for various industrial processes after proper separation process. Keywords: Fuel, HDPE and LDPE wastes, pyrolysis oil. I. Introduction The growth of the plastic consumption has been occuring rapidly in the last six decades due to their ability to be simply formed, its light weight and non-corrosive behavior. These excellent properties have been used to replace the use of wood and metals. The great number of consumptions would increase the product of plastics wastes which led to the environmental problems. Landfilling is not a suitable option for disposing plastic wastes because of their slow degradation rates. The use of incinerator generates some pollutants to the air, which also cause environmental issues. Therefore, recycling and recovering methods have been used to minimize the environmental impacts, to reduce the damage caused by plastic wastes and to evaluate these valuabe materials as raw material of various proccesses. Chemical recycling via pyrolysis process is one of the promising methods of recycling waste plastics, which involves thermochemical decomposition of organic and synthetic materials at elevated temperatures in the absence of oxygen. In the pyrolysis process (heating in oxygen free atmosphere), the organic components of the material are decomposed generating liquid and gaseous products, which can be useful as fuels and/or sources of chemicals (Aguado et al, 2007; Buekens et al, 1998). Washing 685 the dirty plastic wastes is an important preliminary process affecting the pyrolysis product quality. The composition of the liquid and gaseous products of the depolymerisation of various types of polymeric materials has been a subject of wide research in various technological systems, including slow and fast pyrolysis at normal and increased pressure (Lee at al, 2007; Kim et al, 1997; Williams et al, 1997; Brebu et al, 2010). Upgrading of pyrolytic oil produced from polyethylene plastic has also been investigated using catalyst material (Lee et al, 2009). The addition of catalyst in the process showed the improvement of liquid and gas yields and also high fraction of heavy hydrocarbons in oil product due to more cracking residue. Non catalytic pyrolysis process has also been studied using waste plastics (Demirbas, 2004). The results showed that the pyrolysis of waste PS produced higher liquid products while waste PE and PP produced higher gaseous products. In this study, washed and unwashed HDPE and LDPE plastic wastes were were pyrolyzed at fixed bed reactor pyrolysis system at 300, 500, 700 C. The oil and gaseous product compositions were investigated and the potentials of these oil and gaseous products for being utilized in fuel production were evaluated. The effects of plastic type, pyrolysis temperature and plastic washing preprocess on the

241 pyrolysis product quality were investigated. II. Material and Method Waste HDPE and LDPE plastics were crushed to <8 mm, washed in laboratory scale system and pyrolysed at fixed bed reactor pyrolysis equipment at 300, 500 and 700 C under the heating rate of 5 C/min in a 12 mm internal diameter vertical chromium reactor. At the end of pyrolysis processes, the fluid product has passed through condenser, liquid products were collected in condensation pots and non-condensed portion of the fluid that is gaseous product was collected in a gasometer. The liquid and gas fractions were analysed by using a gas chromatography-mass spectrometry (GC-MS). The column was RTX-5MS capillary column, 30 m length with 0.25 mm diameter and 0.2 μm film thickness. Helium was used as the carrier gas. The temperature program used was, initial temperature 80 C for 10 min followed by a heating rate of 10 C /min to 200 C and then held at 300 C for 10 min. The heat values of the samples were measured by using a cylinder (bomb) type auto calorimeter (AC-350, LECO). III. Results and Discussion The effect of prewashing of HDPE and LDPE wastes on the C10-C40 hydrocarbon (HC) content in the oil can be seen in Fig. 1. Pyrolysis temperature affects the C10-C40 HC contents in the oil, but the type of the effect differs at each PE type and washing conditions. For 700ºC, HC content of unwashed and washed HDPE decreased to 5% and 19% respectively. As temperature increased, depolymerization increased and molecular weight of polyethylene and the number of double bonds in polymer decreased in the HDPE wastes. The HC quantities of oil product of unwashed LDPE pyrolysis were higher than washed LDPE. Unwashed LDPE wastes were containing impurities as residue of bag dye. These residues showed negative effect on depolymerization reactions. The HC contents were 23% and 5% at 300 C and 700 C pyrolysis temperatures for washed LDPE. As temperature increased, depolymerization more slowly occurred as compared to HDPE because this type of plastic is produced under higher pressure conditions. Fig. 1: The effect of pyrolysis temparature on C10-C40 HC content of pyrolysis oil products When pyrolysis temperature increased, heat values of oil products increased for all samples (Tab 1). The heat values of pyrolysis oil of washed plastics were higher than unwashed plastics. The main reason was impurities content of these wastes. When the HC content increased, heat values decreased Tab.1: The Heat Values of Liquid Products Pyrolysis Temperature Haet Value of HDPE oil (kcal) Heat Value of LDPE oil (kcal) ( C) Unwashed Washed Unwashed Washed Pyrolysis gas products composed of HC s having smaller number of carbons (Tab 2). All gas samples contained pentene, pentane, hexane, benzene, heptane, toluene, octane, ethylbenzene and styrene. Tab. 2: Pyrolysis Gas Products Composition Component UNWASHED HDPE WASHED HDPE UNWASHED LDPE WASHED LDPE 300 C 500 C 700 C 300 C 500 C 700 C 300 C 500 C 700 C 300 C 500 C 700 C 1-Pentene X X X X X X X X X X X X Pentane X X X X X X X X X X X X 2-methyl-1-pentene X X X X X X X X X X X X Hexane X X X X X X X X X X X X Benzene X X X X X X X X X X X X 1-Hepten X X X X X X X X X X X X Toluene X X X X X X X X X X X X Octane X X X X X X X X X X X X Ethylbenzene X X X X X X X X X X X X Styrene X X X X X X X X X X X X 2.4 Dimethyl -1 Heptene X X X X X X Methyl Cyclopentane X X X 2 Methyl - 1Pentene X 2 Methyl-1Heptene X X Methyl Cyclohexane X 1-Nonene X X Nonane X X 1 Octene X Methyl Cyclopentane X X 3-Methyl Cyclopentane X Trichloroethen X X X 686
242 Most of these compounds can be used as petroleum-based fuel for vehicles and engines. These compounds can also be used as a solvent to produce other chemicals and materials. Ethylbenzene can be used in production of styrene plastics. Toluene can be used as an octane booster in gasoline fuels for internal combustion engines. Hexane is used in the glue production. Several additional compounds were observed besides above common compounds. The number of these different compounds was higher for HDPE type plastics than LDPE plastics. The types of these additional gas components generated from the pyrolysis of unwashed HDPE were different from those of washed HDPE for all pyrolysis temperatures. Only two additional compounds, 2.4 Dimethyl -1 Heptene and 2 Methyl-1 Heptene were produced in the pyrolysis gas of washed LDPE obtained at 300 and 500 C, respectively. At 700 C pyrolysis temperature, this compound was not generated. Each of the compounds in Table 2 can be recovered from the pyrolysis gases and can be used as either fuel, or raw material for number of industrial processes. IV. Conclusions The C10-C40 HC content and heat values of pyrolysis liquid samples and compunds present in the pyrolysis gases were investigated for HDPE and LDPE waste plastics pyrolysis in this study. HDPE and LDPE pyrolysis produced oil product with heating value kcal which is higher than coal. The obtained pyrolysis oils have up to 30-40% C10-C40 HC. These indicated that these pyrolysis oils have potential for use as fuel after further processing, such as extraction or distillation. In a large scale plants the amount of pyrolysis liquid generated will have high heating value and have a great potential in terms of energy and product recovery as the these liquids can be utilized for fuel by utilizing in engines or can even be used in the process itself providing a sustainable process with permissible or no pollution. References Aboulkas A, Harfi KE, Bouadili AE. Thermal degradation behaviors of polyethylene and polypropylene. Part I: Pyrolysis kinetics and mechanisms. Energy Conversion and Management 2010; 51: Aguado J, Serrano DP, Miguel GS, Castro MC, Madrid S. Feedstock recycling of polyethylene in a two-step thermo-catalytic reaction system. Journal of Analytical and Applied Pyrolysis 2007; 79: Buekens AG, Huang H. Catalytic plastics cracking for recovery of gasoline-range hydrocarbons from municipal plastic wastes. Resources, Conservation and Recycling 1998; 23: Demirbas A. Pyrolysis of municipal plastic wastes for recovery of gasoline-range hydrocarbons. Journal of Analytical and Applied Pyrolysis 2004; 72: E.A. Williams, P.T. Williams, Analysis of products derived from the fast pyrolysis of plastic waste, J. Anal. Appl. Pyrolysis (1997) J. Kim,W. Kaminsky, B. Schlesselmann, Pyrolysis of a fraction of mixed plastic wastes depleted in PVC, J. Anal. Appl. Pyrolysis (1997) K.-W. Lee, D.-H. Shin, Characteristics of liquid product from the pyrolysis of waste plastic, Waste Manage. 27 (2) (2007) Lee KH. Thermal and catalytic degradation of pyrolytic oil from pyrolysis of municipal plastic wastes. Journal of Analytical and Applied Pyrolysis 2009; 85: M. Brebu, S. Ucar, C. Vasile, J. Yanik, Co-pyrolysis of pine cone with synthetic polymer, Fuel 89 (8) (2010) Similar to pyrolysis liquids, waste HDPE and LDPE plastics pyrolysis gas products also contain number of valuable organics which have the potential for either being used as fuel or used as raw material after proper distillation. Washing the waste plastic affects liquid (oil) and gas products composition in pyrolysis process, with higher effect on oil composition. Moreover, washing the waste to be pyrolyzed increases the heat value of the oil. Pyrolysis temperature has also effects on oil and gas product composition. Acknowledgements This study was financially supported by TUBITAK-CAYDAG, under grant no 114Y116; and by Selcuk University BAP /
243 Pyrolysis of Washed Waste HDPE Plastics and Production of Epoxy Composite from the Pyrolysis Char Merve Sogancioglu 1, Esra Yel 1, Gulnare Ahmetli 2 1 Selcuk University, Environmental Engineering Department, Konya-Turkey 2 Selcuk University, Chemical Engineering Department, Konya-Turkey * [email protected] Abstract The disposal of waste plastics has become a major worldwide environmental problem. Pyrolysis of waste plastics is one of the routes to waste minimization and recycling that has been gaining in interest. In pyrolysis the pyrolysed material is separated into gas, liquid (both are fuel) and solid (char) products. All fractions have utilities and economical value depending upon their characteristics. Washing the crushed dirty plastic wastes is an important preliminary process affecting the product quality. Waste HDPE plastics were washed in laboratory scale system and pyrolysed at fixed bed reactor pyrolysis equipment. The first objective of this study is to obtain the pyrolysis product fractions of washed waste high density polyethylene (HDPE) and to determine the effects of pyrolysis temperature on the quality of the solid product (char). Pyrolysis runs were performed at temperatures 300, 500 and 700 C with heating rates of 5 C/min. The results showed that increase in the pyrolysis bed temperature from 300 C to 700 C resulted in a significant increase in the gas product yield, as opposed to the decrease in oil product. There were significant differences noted in the char compositions of the compared pyrolysis temperatures. Subsequent to chars obtained at different temperatures were used in epoxy composite preparation as additive, and as the second objective-the effect of pyrolysis temperature and additive dosage on composite quality were investigated. Composite qualities were determined by measuring electrical conductivity, surface hardness, Young s modulus and tensile strength of the composites. Electrical conductivity, surface hardness and tensile strength of composites were higher than neat epoxy for 30 wt% additive, which was the washed HDPE char obtained at 300 C. Keywords: Char, composite, pyrolysis, waste HDPE. I. Introduction Plastic materials have proved their reputation and have gained popularity as they are light in weight, does not rust or rot, low in cost and, reusable and conserve.there are numerous of ways that plastic is being used nowadays/will be used in the years to come. Hence plastics have become essential materials and their applications in the industrial field are increasing. At the same time, waste plastics have created a very serious environmental challenge because of their huge quantities and their disposal problems. Plastics are produced from petroleum derivatives and are composed primarily of hydrocarbons but also contain additives such as antioxidants, colorants, and other stabilizers. Polyethylene (PE) is the third largest commodity plastic material in the world, after polyvinyl chloride and polypropylene in terms of volume. The demand for HDPE has increased 4.4% a year to 31.3 million ton in 2009 (Kumar et al, 2011). Nowadays wastes such as plastics, used tires and lignocellulosic biomass are, presently, generated in huge amount and considered suitable raw materials for pyrolytic processes since natural and synthetic polymers are broken down into smaller hydrocarbon chains. The fluid products formed include fuel gas and pyrolysis oil that have industrial and energetic applications. Although pyrolysis conditions are usually optimized in order to maximize the gas and liquid products, non-volatilization of raw materials, recondensation and/or recombination of thermal cracking products may occur leading to a solid fraction named as pyrolytic char. This solid char is mainly composed by a carbon-rich matrix that contains almost all the inorganic compounds present in the raw wastes and a significant amount of condensed by-products formed during the pyrolysis process dispersed throughout the solid porous structure. To minimize the cost and increase the sustainability of the pyrolysis process, the pyrolytic char should be valorized as are the gaseous and liquid products instead of being directed to landfill disposal. Combustion of char is a possibility, since it provides process energy for pyrolysis. Usually, the pyrolysis chars have porous structures compatible with adsorption purposes, moreover, due to their potential adsorptive properties, the solid chars are good precursors for manufacturing activated carbons by means of physicochemical activation (Harris et al, 2006). Composite material is a material system that two or more constituents mixtures or combinations that are not dissolved in each other basically and have 688

244 different forms and/or material compositions. Epoxy resins are matrix materials that have commonly been used in composites because of the ease of processing, low price and environmental advantages (Schartel et al, 2007; Wang et al., 2010; Liu et al., 2005; Brus et al., 2008). Any evidence about the evaluation of solid product obtained by the pyrolysis of HDPE and LDPE plastic wastes has not been found. However, about the use of char that is plastic pyrolysis solid product in epoxy resin is encountered (Ahmetli et al., 2013). In that study, the composite of epoxy that is the pyrolysis product of the plastic HDPE at 450 C is prepared and positive results are obtained by investigating its mechanic, electrical and thermal properties (Ahmetli et al., 2013). In this study, the pyrolysis of washed HDPE type waste plastics was performed in fixed-bed pyrolysis reactor at different temperatures and char that is the solid product of pyrolysis was evaluated in the production of epoxy composite. Electrical conductivity, tensile strength, surface hardness of produced epoxy composites were tested. Effects of pyrolysis temperature and char dose on the quality of composite were investigated. II. Material and Method Waste HDPE was crushed into approximately 8 mm pieces in plastic crusher. Washing the crushed dirty plastic wastes is an important preliminary process affecting the product quality. Crushed waste HDPE samples were washed in laboratory scale system and pyrolysed at fixed bed reactor pyrolysis equipment. The crushed materials were pyrolysed at 300, 500 and 700 C under a heating rate of 5 C/min in a 12 mm internal diameter vertical chromium reactor (Fig 1). according to ASTM D 638 standards. The curing procedure was applied in an oven at 40 C for 24 h and then postcured at C within 48 h. A Shore Durometer TH 210 tester was used for measuring hardness of the composite. The stretch resistance properties were determined by the Stretch and Pressing Equipment TST-Mares/TS-mxe. III. Results and Discussion III.1. Effect of Pyrolysis Temperature on Product Yields Product yields of washed HDPE wastes pyrolysis process are shown in Tab.1. For washed HDPE plastic wastes, gas production was between 15.33%-44.82% between 300 and 700ºC. As temperature increases, polymeric structure of the plastic is degraded and new gas products having high molecular weight are created. While literature researches support this situation, it was determined that the amount of gas produced and the types of main constituent increase at the end of the pyrolysis of PE at of 500 and 700ºC and constituents such as methane, ethylene and propylene, having high molecular weight are dominant in the gas compound (Mastral, 2002). Tab. 1: HDPE Pyrolysis Product Yields Temperature Solid,% Liquid,% Gas,% 300 C C C The amount of liquid product was 83.05% for washed HDPE at 300ºC which was the lowest pyrolysis temperature. However this value was found to be as 54.12% at the higher temperature (700ºC). Plastics of HDPE type began to get degraded into new gas products and therefore the amount of liquid product decreased. HDPE polymers are in the group of polyolefins, the yield of liquid product is generally higher than the yields of solid and gas products in pyrolysis of these types. Fig. 1: Pyrolysis System At the end of pyrolysis processes, char, liquid and gaseous products were collected. The gas product was collected in gasometer system. Chars were grounded to obtain char powder before being mixed with epoxy resin (ER). Char (particle size ~250 mesh) in 10, 30 and 50 wt% and the epoxy matrix were mixed by mechanical stirring at 1200 rpm for 30 min by using a Heidolph RZR1-type stirrer. After, 30 wt% epoxy hardener and 1 wt% epoxy accelerator were added and the mixture was degassed for 60 min at room temperature, the mixture was transferred into the stainless steel molds % of HDPE char remained at pyrolysis temperature of 300ºC. As temperature was increased, char turned into new gas products and 1.06% char remained at the system at 700ºC. Depolymerization increased and molecular weight of PE and the number of double bond in polymer decreased in the plastic wastes for HDPE produced under low pressure conditions as temperature increased. Based upon it, pyrolysis yield of the plastic wastes for HDPE was found to be 98.38% in this study. III.2. Effect of Pyrolysis Temperature over the Structure of Char According to FTIR spectrums of char sample given in Fig 2, for the 300, 500 and 700 C, such groups as aromatic C=C available between the wavenumbers of 1700 cm -1 and 1450 cm -1 and aliphatic C=C
, functional groups were divided and there were aliphatic C=C groups available having bigger molecular weight as")

245 between the wavenumbers of 1300 cm -1 and 800 cm -1. As temperature increased, the amounts of char and liquid products decreased (Table 1), functional groups were divided and there were aliphatic C=C groups available having bigger molecular weight as the only final product at 700 C. Fig. 4: Elongation at break values of composites with HDPE char additives Fig. 2: FTIR spectra of HDPE char III.3. Effect of Char Additive Doses on the Properties of Composite Material Electrical conductivities for composites prepared with HDPE char is given in Tab. 2. Tab. 2: Conductivity Values of HDPE composites Temperature, Conductivity, S.cm -1 C 10% char 30% char 50%char Electrical conductivities of composite materials increased with the increment of char additive rates for HDPE. Epoxy resin is a good insulating material (Value of conductivity: S.cm -1 ). However, composites including char additive at a rate of 10-50% are semi-conductors. These composites showed higher electrical conductivities as compared to reference epoxy resin. When amount of char increases, epoxy particles create conducting chains to get more perfect structure and they become a part of conducting sets. Therefore, resin composite also changed from insulator to a conductor material. On the other hand, electrical conductivities of epoxy composites obtained by char additives obtained at higher pyrolysis temperature for both types of char were higher as compared to lower temperatures (300 C), it complies with literature (Eghlimi et al., 1999; Diakoumakos et al., 1995). Mechanical properties such as percentage of breaking and tensile strength of composite material were determined with tension test. Elongation at break values determined at the end of tensile strength applied to composite materials with char additives are indicated in Fig 4. The elangation at break of ER300 and ER500 composites are higher than the reference composites for dose of 30% and 50% and these values decrease as the dose increases for all composite samples. The structure of HDPE char of 700 C changes through aromatic structure, all samples show lower elongation at break compared to reference as dose increases in these composites and high char dose causes decrease in ductility. Elongation at break decreases as char dose increases at all temperatures. According to these results, composite materials produced by char obtained at the pyrolysis temperature of 300 C show the most ductile behavior. According to Fig 5, high tensile strength was obtained as compared to reference composite. While tensile strength showed an increase by 31% with10% dose for char obtained at 300 C, these increases were 20% and 3% for char additives produced at 500 C and 700 C respectively. Fig. 5: Tensile strength of composites with HDPE char As char additive dose increased, tensile strength of composites decreased, but still had higher value than reference material. The additive decreased tensile strength through prohibition to motion of epoxy composite molecules. As the temperature of char s pyrolysis increased, material s rigidity increased and tensile strength decreased while char structure changed. According to Fig 6, as the dose of HDPE char additive increased, surface hardness also increased. Higher hardness was achieved as compared to reference material for 700 C. Due to the difference in char structures at 700 C, the composite material obtained with this additive increased it s hardness compared to reference, but provided lower hardness as compared to the composites with additives of chars obtained at 300 C pyrolysis temperature. 690

246 following pyrolysis, European Polymer Journal, 31, Eghlimi, A., Lu L., Sahajwalla, V. and Haris, D., Modelling of char combustion based on the structure of char particles, 2 nd International Conference in the Minerals and Process, Australia. Fig. 6: Hardness values of composite IV. Conclusions Epoxy composite material was produced by adding char that was the solid product of pyrolysis of HDPE and LDPE plastic wastes between 300 C and 700 C. Following conclusions can be drawn from this study. Pyrolysis yields of HDPE 98.38% within the scope of this study. As the char additive dose in composite material was increased, electrical conductivity also increased. Composite materials produced at all temperatures and all doses had semi-conductor structure. Epoxy composite material obtained with the HDPE pyrolysis char additive obtained at 300 C showed the better behavior in terms of breaking elongation and tensile strength. This study provided was an alternative method for treatment of HDPE plastic wastes. The char obtained in the pyrolysis was evaluated in a new product by using it as an additive in the production of epoxy composite material. Harris K., Gaskin, J., Das, K.C., Characterization of pyrolysis char for use as an agricultural soil amendment, College of Agriculture & Environmental Science University of Georgia. Kumar S, Panda AK, Singh RK. A review on tertiary recycling of high-density polyethylene to fuel. Resour Conserv Recycl 2011;55: Liu HZ, Zheng SX, Nie KM, Morphology and thermomechanical properties of organic-inorganic hybrid composites involving epoxy resin and an Incompletely condensed polyhedral oligomeric silsesquioxane, Macromolecules, 38, Schartel B, Balabanovich AI, Braun U, Knoll U, Artner J, Ciesielski M, et al., Pyrolysis of epoxy resins and fire behavior of epoxy resin composites flameretarded with 9,10-Dihydro-9-oxa-10-phosphaphenanthrene-10-oxi de additives, J Appl Polym Sci, 104, Wang X, Hu Y, Song L, Xing WY, Lu HD, Lv P, et al., Flame retardancy and thermal degradation mechanism of epoxy resin composites based on a DOPO substituted organophosphorus oligomer, Polymer, 51, Acknowledgement This study was financially supported by TUBITAK under grant no 114Y116 and by Selcuk University BAP / References Ahmetli, G., Kocaman, S., Ozaytekin, I., & Bozkurt, P. (2013). Epoxy composites based on inexpensive char filler obtained from plastic waste and natural resources. Polymer Composites, 34(4), doi: /pc Brus J, Urbanová M, Strachota A., Epoxy networks reinforced with polyhedral oligomeric silsesquioxane: structure and segmental dynamics as studied by solid-state NMR, Macromolecules, 41, Diakoumakos, C. D., Mikroyannidis, J. A., Krontiras, C. A., Pisanias, M. N. and Georga, S. N., Thermosetting resins prepared from the reactions of diaminomaleonitrile with 4,4'-bismaleimidediphenylmethane and electrical conductivity measurements of the resulting materials 691
247 Production of Hazelnut Oil Biodiesel through Investigating KOH-Catalyzed Transesterification Reaction Parameters Mert Gulum *, Atilla Bilgin Karadeniz Technical University, Faculty of Engineering, Mechanical Engineering Department Trabzon, 61080, TURKEY Abstract * [email protected] Optimization of transesterification reaction parameters is purposed to produce the lowest kinematic viscosity hazelnut oil biodiesel by using potassium hydroxide (KOH) as catalyst and methanol (CH3OH) as alcohol in this study. For this purpose, the effects of main reaction parameters that influence the transesterification reaction such as catalyst concentration, reaction temperature, reaction time and alcohol/oil molar ratio on the kinematic viscosities and densities of produced hazelnut oil biodiesels were parametrically investigated. According to experimental results, reaction parameters giving the lowest kinematic viscosity of mm 2 /s were determined as 1.25% catalyst concentration, 60 reaction temperature, 60 minutes reaction time and 9:1 alcohol/oil molar ratio. The quality of the lowest kinematic viscosity biodiesel was also evaluated by determining the other important properties such as, flash point temperature, cold filter plugging point temperature (CFPP), higher heating value and fatty acid compositions. These specifications were found in accordance with ASTM D 6751 and EN standards. Keywords: Alternative fuels, basic transesterification reaction, biodiesel production, viscosity I. Introduction Increasing prices and diminishing known supplies of fossil fuels, and global warming due to exhaust emissions have lead to intense international interest in developing alternative fuel for engines (Salvi and Panwar, 2012), (Alberici et al., 2012). Biodiesel, which is a substitute fuel made up of mono-alkyl esters of long-chain fatty acids prepared from vegetable oils or animal fats as per the American Society for Testing and Materials (ASTM), has fascinated considerable interest as a renewable alternative fuel for diesel engines (Shah et al., 2013). Biodiesel has the following general advantages in compared to the conventional fossil fuels: (1) It is an oxygenated fuel which contains 10-15% oxygen by mass in molecular structure, and has higher cetane number than petro-diesel fuel. These facts lead to better ignition quality and complete combustion. Thus using biodiesel instead of the petro-diesel fuel significantly reduces the exhaust emissions such as carbon dioxide (CO), unburned hydrocarbons (HC) and smoke. Being a sulfur-free fuel, biodiesel also leads to zero sulfur oxide (SOx) emissions (Salvi and Panwar, 2012), (Basha and Gopal, 2012), (Borges and Diaz, 2013). (2) It is clean, biodegradable and non-toxic, being beneficial for reservoirs, lakes, marine life and other environmentally sensitive places (Vicente et al., 2008). (3) It displays lubricating properties superior to petro-diesel fuel, reducing premature wearing of fuel pumps (Alberici et al., 2012), (Joshi and Pegg, 2007). (4) It has the potential to relieve the country s dependence on foreign energy sources since it can be produced renewable and domestic feedstock (Yuan et al., 2003). (5) The flash point temperature of biodiesel is higher than that of petro-diesel fuel which makes it safer regarding to the storage and transport (Alptekin and Canakci, 2008). (6) Biodiesel-diesel fuel blends or even pure biodiesel can be used in diesel engines with small modifications. Taking these advantages into consideration, it can be said that biodiesel is ideal fuel for diesel engines. But, there are also some problems in using of biodiesel. The main problem is its poor low-temperature flow properties, measured in terms of cloud point, pour point and cold filter plugging point temperature. Other major disadvantages are its higher viscosity, lower energy content, generally higher nitrogen-oxides (NOx) emissions and high price (Yusuf et al., 2011). Viscosity is one of the most important fuel property regarding fuel atomization and distribution, and lubrication. Fuel with low viscosity may not provide sufficient lubrication for fuel injection pump, resulting in leakage and increased in wear (Al-hamamre and Yamin, 2014). On the other hand, high viscosity deteriorates fuel atomization during injection which causes to increase exhaust emissions and decrease engine performance. High viscosity also causes cold-starting problems in cold weather (Alptekin and Canakci, 2008). Homogeneous catalyzed vegetable oil transesterification reaction has been commonly used to biodiesel production by using NaOH and KOH as basic catalyst in literature. Some studies in this type are summarized as following. In the study performed by Encinar et al., production of biodiesel from Cynara cardunculus L was carried out by using ethanol as alcohol, and sodium and potassium hydroxide as catalyst. The operation variables for reaction temperature, catalyst concentration and ethanol/oil molar ratio were ranged 25-75, wt.% 692
248 and 3:1-15:1, respectively. The optimum parameters giving maximum biodiesel yield were found as ethanol/oil molar ratio of 12:1, sodium hydroxide as catalyst (1.00 wt%) and 75 temperature (Encinar et al., 2002). Sabagh et al. determined the optimum conditions of biodiesel production from waste frying oil. The transesterification process was made with four alcohol types (methanol, ethanol, 1-propanol, 1-butanol). According to experimental results, when methanol/oil molar ratio of 6:1 and sodium hydroxide/oil weight ratio of 0.40% were used, the maximum yield of ester was obtained as 87 wt%. (El-sabagh et al., 2011). Zhang et al. investigated the optimum conditions of two stage biodiesel productions from Zanthoxylum bungeanum seed oil with high free fatty acids. The acid value of the oil was reduced from mg KOH/g to 1.16 mg KOH/g by first stage acid catalyzed esterification reaction, performed with methyl alcohol/oil molar ratio of 24:1, sulfuric acid/oil weight ratio of 2.00 %, reaction temperature of 60 and reaction time of 80 min. In the second stage, the pretreated oil was used for alkali-catalyzed transesterification and biodiesel having yield of higher than 98% was produced at the end of the reaction (Zhang and Jiang, 2008) There are also several other researches like mentioned above about optimization of parameters giving the highest ester content or yield in literature. But, there is a scarcity about detailed parametric investigation on the effects of transesterification reaction parameters on viscosity and density of produced biodiesel. Therefore the main objective of the present work is to optimize the reaction parameters giving the lowest viscosity biodiesel. Thus, it also has tried to solve the high viscosity problem of biodiesel mentioned above. II. Experimental Methods II.1. Materials To produce biodiesel by basic catalyzed transesterification, refined hazelnut oil was provided from a market. It was not needed to perform a pretreatment to the oil because of being refined. Thus, methanol (CH3OH) of 99.8% purity as alcohol and pure grade potassium hydroxide (KOH) as catalyst were preferred in transesterification reaction. The density at 15 and kinematic viscosity at 40 of the oil were determined as kg/m 3 and mm 2 /s. Methanol was preferred because of its low price, physical and chemical advantages such as being polar and having the shortest chain. II.2. Production parameters and biodiesel production Physical and chemical properties of produced biodiesel are significantly affected by various reaction parameters. In this study, the effects of the following parameters on the kinematic viscosities and densities of produced hazelnut oil biodiesels were investigated: Catalyst concentrations, % (mass of KOH/mass of hazelnut oil): 0.25, 0.50, 0.75, 0.90, 1.00, 1.10, 1.25, 1.50 Reaction temperatures, : 40, 50, 60, 70 Reaction times, (min): 30, 60, 90, 120 Alcohol/oil molar ratios: 3:1, 6:1, 9:1, 12:1 The above parameter values were selected as including the ranges in the literature (Atabani et al., 2012), (Enweremadu and Mbarawa, 2009), (Helwani et al., 2009), (Balat and Balat, 2010), (Leung et al., 2010), (Demirbas, 2009), (Sharma et al., 2008). The transesterification reaction was carried out in a 1 L flat-bottomed flask, equipped with a magnetic stirrer heater, thermometer and spiral reflux condenser. Haake Falling Ball Viscometer, Isolab pycnometer, top loading balance with an accuracy of ±0.01 g, Haake Water Bath and stopwatch with an accuracy of ±0.01 s were used to measure dynamic viscosity and density. Before starting the reaction, a certain amount of potassium hydroxide (KOH) according to chosen catalyst concentration was dissolved in a certain amount of methyl alcohol (CH3OH) depending on alcohol/oil molar ratio in a narrow-neck flask to make alcoholic solution of catalyst. In the flat bottomed flask, this alcoholic solution was added to the hazelnut oil that was formerly warmed in a beaker. Until a certain time, these reactants were mixed at a certain reaction temperature with stirring by means of the magnetic stirrer heater. Transesterification reaction was carried out with the spiral reflux condenser for avoiding loss of alcohol. Also, reaction temperature was controlled by using thermometer to remain at a constant reaction temperature during the reaction. At the end of the reaction, the resulting product mixture was transferred to a separating funnel. After a day, two phases occurred in the separating funnel. The upper phase consists of methyl esters, and the lower one consists of the glycerol, excess methanol, remaining catalyst together with soaps formed during the reaction and some entrained methyl esters. After separation of the two layers by gravity, the upper layer (biodiesel) was washed with warm distilled water until the wash water became clear. Washed biodiesel was heated up to about 100 to remove methyl alcohol and water residuals. II.3. Density measurement The densities of the produced biodiesels were determined by means of Eq. (1) and measurements in accordance with ISO 4787 standard: ρ biodiesel = m total m pycnometer m water ρ water (1) where ρ and m represent density and mass, respectively. In order to minimize measurement errors, all the measurements were conducted three times for each sample and the results were averaged. Also, uncertainty analysis was carried out depend on the sensitivities of measurement devices (Gülüm and 693
249 Bilgin, 2015). II.3. Dynamic viscosity measurement The dynamic viscosities were determined in accordance with DIN standard by using Eq. (2) and making measurements by means of the Haake Falling Ball Viscometer, Haake Water Bath and stopwatch: μ biodiesel = K ball (ρ ball ρ biodiesel ) (2) where μ is dynamic viscosity, K ball is coefficient of the viscometer ball, and t is falling time of the ball moving between two horizontal line marked on viscometer tube at limit velocity. K ball and ρ ball are mpa s cm 3 /g/s and 2.2 g/cm 3, respectively. The viscosity measurements were also conducted three times for each sample and the results were averaged (Gülüm and Bilgin, 2015). The kinematic viscosities were determined from Eq. (3) by dividing dynamic viscosity to density at same temperature: ν biodiesel = μ biodiesel ρ biodiesel (3) In Eq. (3), if μ biodiesel and ρ biodiesel are in the units of (mpa. s) and (kg/l), respectively, then ν biodiesel is obtained in unit of (mm 2 /s) (Gülüm and Bilgin, 2015). In this study, dynamic viscosities and densities were measured in Internal Combustion Engines Laboratory in the Mechanical Engineering Department at Karadeniz Technical University. The fatty acid methyl ester compositions of produced hazeulnut oil biodiesel having the lowest kinematic viscosity were qualitatively and quantitatively analyzed by gas chromatography using a Hewlett-Packard HP-6890 Series GC system fitting with a HP-6890 mass selective detector (1909N-133 innowax capillary column of 30 m length, 0.25 mm I.D and 0.25 µm film thickness) in Science Research and Application Center at Mustafa Kemal University in Turkey. The other properties of the produced hazeulnut oil biodiesel having the lowest kinematic viscosity such as flash point temperature (EN ISO 3679), cold filter plugging point temperature (EN 116) and higher heating value (DIN ) were also measured in the Prof. Dr. Saadettin GUNER Fuel Research and Application Center at Karadeniz Technical University in Turkey. II.4. Uncertainty analysis The results obtained from experimental studies are generally calculated from measured physical quantities. These quantities have some uncertainties due to uncertainties of measuring tools and measurement systems. Therefore, uncertainty analysis should be applied for proving reliability of the calculated results. In this study, uncertainties of the measured and calculated physical quantities such as dynamic and kinematic viscosities and densities were determined by the method proposed by Kline and McClintock given in (Holman, 2001). According to this method, if the result R is a given function of the independent variables x 1, x 2, x 3,..., x n and w 1,w 2, w 3,..., w n are the uncertainties of each independent variables, then the uncertainty of the result w R is calculated by using the equation: w R = [( R w x 1 ) 2 + ( R w 1 x 2 ) ( R 2 1/2 w 2 x n ) ] n (4) By using the method, the highest uncertainty was determined as %. Therefore, it can be said that the results have fairly high reliability. III. Results and Discussions Parametric study was started by varying catalyst concentration. After determination of the catalyst concentration, the effects of reaction temperature, reaction time and methyl alcohol/oil molar ratio on kinematic viscosities and densities of produced biodiesels were investigated, respectively. Densities and viscosities were determined at 15 and 40, respectively. III.1. Effects of catalyst concentration In order to research the effects of catalyst concentration on kinematic viscosities and densities of produced biodiesels, reaction temperature: 60 reaction time: 60 minutes alcohol/oil molar ratio: 6:1 were kept constant throughout this set of the experiments and catalyst concentration was changed as 0.25, 0.50, 0.75, 0.90, 1.00, 1.10, 1.25 and 1.50%. The changes of kinematic viscosities and densities with respect to catalyst concentration are shown in Figs. 1 and 2, respectively. Fig. 1 shows the change of kinematic viscosity with respect to catalyst concentration. As shown in this figure, as catalyst concentration increases, kinematic viscosity of produced biodiesel gradually decreases until the catalyst concentration of 1.25%. At this point, kinematic viscosity takes a minimum value of mm 2 /s. Then, when the catalyst concentration is continued to increase, the viscosity gradually increases. This variation can be attributed to the yield of the transesterification reaction. It is known that the viscosity of the produced biodiesel decreases with increasing reaction yield (Ghanei et al., 2011), (Moradi et al., 2012). Because there is not enough amount of catalyst in reaction medium for low catalyst concentrations (e.g., 0.25% of potassium hydroxide), much of the triglycerides in hazelnut oil cannot be converted sufficiently to methyl esters throughout the reaction period (60 minutes). This situation reduces 694
250 the yield of the transesterification reaction and increases viscosity of produced biodiesel. If higher catalyst concentration is used, the yield of the transesterification reaction improves and thus the viscosity biodiesel decreases. However, when excess catalyst concentration is used, the yield of the transesterification reaction decreases (Uzun et al., 2012), (Encinar et al., 2005) and viscosity increases on account of formation of fatty acid salts (soap), decrease in activity of catalyst and difficulty in separation of glycerol. Fig. 2 shows the change of density with respect to catalyst concentration. Density values change slightly. Similar changes are also observed for variations of the densities with respect to reaction temperature (Fig. 4), reaction time (Fig. 6) and alcohol/oil molar ratio (Fig. 8). In the next stage of the study, catalyst concentration of 1.25 % giving the lowest viscosity was kept constant and the other parameters were changed. Fig. 3 shows the effect of reaction temperature on the kinematic viscosity. When reaction temperature is increased, kinematic viscosity of produced biodiesel gradually decreases until the reaction temperature of 60. At this point, kinematic viscosity takes a minimum value of mm 2 /s. Then, as the reaction time is continued to increase, the viscosity gradually increases. Kinematic viscosity of biodiesel produced at low reaction temperatures (e.g., 40 ) is generally high since transesterification reaction cannot be effectively completed for one hour. As the reaction temperature is increased, the yield of the transesterification reaction improves due to higher energy input, and viscosity of produced biodiesel decreases. In case of increasing reaction temperature higher than 65, which is the boiling point of methyl alcohol, viscosity increases due to diminishing of alcohol concentration by evaporating from reaction medium. Moreover, the saponification and decomposition of methyl esters in biodiesel at high temperatures may be also contributed to increase in viscosity (Hoque et al., 2011), (Ramadhas et al., 2005), (Phan and Phan, 2008). Reaction temperature of 60 giving the lowest viscosity was regarded to be optimal value. Fig. 1: Change of kinematic viscosity with respect to catalyst concentration Fig. 3: Change of kinematic viscosity with respect to reaction temperature Fig. 2: Change of density with respect to catalyst concentration III.2. Effects of reaction temperature To determine the effects of reaction temperature on kinematic viscosities and densities of produced biodiesels, catalyst concentration: 1.25% reaction time: 60 minutes alcohol/oil molar ratio: 6:1 were kept constant throughout this set of the experiments and reaction temperature was changed as 40, 50, 60 and 70. Figs. 3 and 4 show the changes of kinematic viscosities and densities of biodiesels versus reaction temperature, respectively. Fig. 4: Change of density with respect to reaction temperature III.3. Effects of reaction time In order to investigate the effects of reaction time on kinematic viscosities and densities of produced biodiesels, catalyst concentration: 1.25% reaction temperature: 60 alcohol/oil molar ratio: 6:1 were kept constant throughout this set of the 695
251 experiments and reaction time was changed as 30, 60, 90 and 120 minutes. Figs. 5 and 6 represent the changes of kinematic viscosities and densities of biodiesels with respect to reaction time, respectively. The yield of transesterification reaction decreases in short reaction periods because of insufficient time for the reaction and thus viscosity of biodiesel becomes high. With increasing in reaction time, viscosity of biodiesel decreases due to the increase in yield of transesterification reaction (Leung and Guo, 2006), (Satyanarayana and Muraleedharan, 2011) and it takes a minimum value of mm 2 /s at about 60 minutes. When reaction time is continued to increase, the transesterification reaction may shift towards reactants and thus causes to increase in viscosity of biodiesel. In the next stage of the study, based on these results, reaction time of 60 minutes giving the lowest viscosity was considered to be an optimum condition. maximum viscosity with mm 2 /s. When more alcohol/oil molar ratio is used (e.g., 6:1 or 9:1), because the transesterification reaction shifts toward products (El-sabagh et al., 2011), (Fadhıl et al., 2012) the yield of the transesterification reaction increases and viscosity of biodiesel declines. Molar ratio of 12:1 gives higher viscosity than 9:1 and 6:1 molar ratios because use of excess alcohol could be attributed to deactivation of the catalyst and increase in the solubility of the glycerol in the methyl ester phase. Alcohol/oil molar ratio of 9:1 giving the lowest viscosity of mm 2 /s was taken to be optimal value. Consequently, reaction parameters giving minimum kinematic viscosity of mm 2 /s were determined as 1.25% catalyst concentration, 60 reaction temperature, 60 minutes reaction time and 9:1 alcohol/oil molar ratio. Fig. 5: Change of kinematic viscosity with respect to reaction time Fig. 7: Change of kinematic viscosity with respect to molar ratio Fig. 8: Change of density with respect to molar ratio Fig. 6: Change of density with respect to reaction time III.5. Fatty acid metyl ester composition and some fuel properties of final biodiesel III.4. Effects of alcohol/oil molar ratio To analyze the effects of alcohol/oil molar ratio on kinematic viscosities and densities of biodiesels, catalyst concentration: 1.25% reaction temperature: 60 reaction time: 60 minutes were kept constant throughout this set of the experiments and molar ratio was changed as 3:1, 6:1, 9:1 and 12:1. Figs. 7 and 8 show the changes of kinematic viscosities and densities of biodiesels versus molar ratio, respectively. According to the experimental results, the biodiesel produced by using molar ratio of 3:1 has the 696 Table 1 lists some fuel specifications for the final hazelnut oil biodiesel having the lowest kinematic viscosity and commercially available Ultra Force Euro Diesel Fuel, and corresponding EN and ASTM D6751 standards. As seen, these specifications were found in accordance with corresponding standards. Moreover, the fatty acid compositions of the final hazelnut oil biodiesel and its calculated average molecular mass and typical formula are listed in Table 2. It is seen that the major and minor fatty acids are oleic and α-linolenic acid, respectively. In the hazelnut oil biodiesel, the mono-unsaturated (C18:1 and C20:1), saturated (C16:0, C20:0 and C22:0) and poly-unsaturated (C18:2, C18:3) faty acids are found to be about %, % and %, respectively According to this composition, its average molecular mass and typical formula are
252 calculated as g/mol and C18.82H35.62O2, respectively. Tab. 1: Some fuel properties of diesel fuel and the lowest viscosity hazelnut oil biodiesel, and corresponding standard values Properties Units Biodiesel D EN ASTM D 6751 Viscosity at 40 mm 2 /s Density at 15 kg/m * Flash Point CFPP -8-6 <5, -15< * HHV kj/kg * * Tab. 2: Fatty acid methyl ester compositions of the lowest viscosity hazelnut oil biodiesel Fatty acid Mass, % Palmitic (C16:0) Oleic (C18:1) Linoleic (C18:2) α-linolenic acid (C18:3) Arachidic (C20:0) Gadoleic acid (C20:1) Behenic (C22:0) Average molecular mass g/mol 1 Typical formula C18.82H35.62O2 1 1 Calculated from fatty acid distribution. IV. Conclusions In this study, the individual effects of catalyst concentration, reaction temperature, reaction time and molar alcohol/oil ratio on density and viscosity of produced biodiesel were investigated parametrically to produce the lowest viscosity hazeulnut oil biodiesel by using KOH as catalyst. It was determined that: 1.25% catalyst concentration 60 reaction temperature 60 minutes reaction time 9:1 alcohol/oil molar ratio give the lowest kinematic viscosity of mm 2 /s. The other important fuel properties such as, flash point temperature, cold filter plug point temperature and higher heating value of the final biodiesel, produced using above reaction parameters, are also within the range of values of EN and ASTM D6751 standards for biodiesel. Acknowledgements The authors express their gratitude to Karadeniz Technical University Scientific Research Projects Fund for financial support received (Project No: 9745). m total m pycnometer m water R t T w 1, w 2, w 3,..., w n x 1, x 2, x 3,..., x n Greek letters μ biodiesel ν biodiesel ρ ball ρ biodiesel ρ water References : Mass of the pycnometer filled with biodiesel (g) : Mass of pycnometer (g) : Mass of pycnometer fille with pure water (g) : Correlation coefficient : Falling time of the viscometer ball (s) : Temperature ( ) : Uncertainties of independent variables : Independent variables : Dynamic viscosity of biodiesel (cp mpa. s) : Kinematic viscosity of biodiesel (cst mm 2 /s) : Density of viscometer ball (g/cm 3 ) : Density of biodiesel (kg/m 3 ) : Density of pure water (kg/m 3 ) Salvi B.L., Panwar N.L., Biodiesel resources and production technologies A review, Renewable and Sustainable Energy Reviews, 16, , (2012). Alberici R.M., De Souza V., De Sá G.F., Morelli R., Eberlin M.N., Daroda R.J., Used frying oil: a proper feedstock for biodiesel production?, Bioenerg. Res., 5, , (2012). Shah S.N., Iha O.K., Alves F.C.S.C., Sharma B.K., Erhan S.Z., Suarez P.A.Z., Potential application of turnip oil (raphanus sativus L.) for biodiesel production: physical-chemical properties of neat oil, biofuels and their blends with ultra-low sulphur diesel (ULSD), Bioenerg. Res., 6, , (2013). Basha S.A., Gopal K.R., A review of the effects of catalyst and additive on biodiesel production, performance, combustion and emission characteristics, Renewable and Sustainable Energy Reviews, 16, , (2012). Borges M.E., Díaz L., Catalytic packed-bed reactor configuration for diesel production using waste oil as feedstock, Bioenerg. Res., 6, , (2013). Vicente G., Martínez M., Aracil J., Integrated biodiesel production: a comparison of different homogenous catalysts systems, Fuel 87, , (2008). Nomenclature CFPP K ball : Cold filter plugging point temperature : Coefficient of the viscometer ball (mpa s cm 3 /g/s) 697 Joshi R.M., Pegg M.J., Flow properties of biodiesel fuel blends at low temperatures, Fuel 86, , (2007). Yuan W., Hansen A.C., Zhang Q., Predicting the physical properties of biodiesel for combustion modelling, ASAE, 46(6), , (2003).
253 Alptekin E., Canakci M., Determination of the density and the viscosities of biodiesel-diesel fuel blends, Renewable Energy, 33, , (2008). Yusuf N.N.A.N., Kamarudin S.K., Yaakub Z., Overview on the current trends in biodiesel production, Energy Conversion and Management, 52(7), , (2011). Al-Hamamre Z., Yamin J., Parametric study of the alkali catalyzed transesterification of waste frying oil for biodiesel production, Energy Conversion and Management, 79, , (2014). Encinar J.M., González J.F., Rodríguez J.J., Tejedor A., Biodiesel fuels from vegetable oils: transesterification of cynaracardunculus l. oils with ethanol, Energy & Fuels, 16(2), , (2002). El-Sabagh S.M., Keera S.T., Taman A.R., The characterization of biodiesel fuel from waste frying oil, Energy Sources, 33(5), , (2011). Zhang J., Jiang L., Acid-catalyzed esterification of zanthoxylum bungeanum seed oil with high free fatty acids for biodiesel production, Bioresource Technology, 99(18), , (2008). Atabani A.E., Silitonga A.S., Badruddin I.A., Mahlia T.M.I., Masjuki H.H., Mekhilef S.A., Comprehensive review on biodiesel as an alternative energy resource and its characteristics, Renewable and Sustainable Energy Reviews, 16, , (2012). Enweremadu C.C., Mbarawa M.M., Technical aspects of production and analysis of biodiesel from used cooking oil-a review, Renewable and Sustainable Energy Reviews, 13, , (2009). Helwani Z., Othman M.R., Aziz N., Fernando W.J.N., Kim J., Technologies for production of biodiesel focusing on green catalytic techniques: a review, Fuel Processing Technology, 90, , (2009). Balat M., Balat H., Progress in biodiesel processing, Applied Energy, 87, , (2010). Leung D.Y.C., Wu X., Leung M.K.H., A review on biodiesel production using catalyzed transesterification, Applied Energy, 87, , (2010). (2015). Holman J.P., Experimental methods for engineers, Seventh ed., McGraw-Hill, New York, (2001). Ghanei R., Moradi G., Taherpourkalantari R., Armandzadeh E., Variation of physical properties during transesterification of sunflower oil to biodiesel as an approach to predict reaction progress, Fuel Processing Technology, 92, , (2011). Moradi G.R., Dehghani S., Ghanei R., Measurements of physical properties during transesterification of soybean oil to biodiesel for prediction of reaction progress, Energy Conversion and Management, 61, 67-70, (2012). Uzun B.B., Kılıc M., Ozbay N., Putun A.E., Putun E., Biodiesel production from waste frying oils: optimization of reaction parameters and determination of fuel properties, Energy, 44, , (2012). Encinar J.M., González J.F., Rodríguez R.A., Biodiesel from used frying oil, variables affecting the yields and characteristics of the biodiesel, Ind. Eng. Chem. Res., 44, , (2005). Hoque M.D.E., Singh A., Chuan Y.L., Biodiesel from low cost feedstocks: the effects of process parameters on the biodiesel yield, Biomass and Bioenergy, 35, , (2011). Ramadhas A.S., Jayaraj S., Muraleedharan C., Biodiesel production from high FFA rubber seed oil, Fuel, 84, , (2005). Phan A.N., Phan T.M., Biodiesel production from waste cooking oils, Fuel, 87, , (2008). Leung D.Y.C., Guo Y., Transesterification of neat and used frying oil: optimization for biodiesel production, Fuel Processing Technology, 87, , (2006). Satyanarayana M., Muraleedharan C., A comparative study of vegetable oil methyl esters (biodiesels), Energy, 36, , (2011). Fadhıl B.A., Dheyab M.M., Ahmed K.M., Biodiesel production from spent fish oil through acid-base catalyzed transesterification, Pak. J. Anal Envir. Chem., 13, 09-15, (2012). Demirbas A, Progress and recent trends in biodiesel fuels, Energy Conversion and Management, 50, 14-34, (2009). Sharma Y.C., Singh B., Upadhyay S.N., Advancements in development and characterization of biodiesel: a review, Fuel, 87, , (2008). Gülüm M., Bilgin A., Density, flash point and heating value variations of corn oil biodiesel-diesel fuel blends, Fuel Processing Technology 134, , 698
254 Second Law Analysis of a CI Engine Fueled With Biodiesel-Diesel Blends Abdulvahap Cakmak 1*, Atilla Bilgin 2 1 Ondokuz Mayıs University, Kavak Vocational School, Department of Motor Vehicles and Transportation Technologies, Samsun, 55850, TURKEY 2 Karadeniz Technical University, Faculty of Engineering, Mechanical Engineering Department Trabzon, 61080, TURKEY * [email protected] Abstract In this study, first law analysis (energy analysis) and second law analysis (exergy analysis) were applied to a single cylinder, air cooled and direct injection diesel engine using biodiesel-diesel blends. The fuel blends contain corn oil methyl ester by volume ratios of 10, 20 and 50 %. By using experimental data which were collected at different engine speeds for full load condition, energy and exergy components of the engine were calculated and compared with each other. According to results the tested engine can run more efficiently, by using B10 for full load condition at 2000 rpm where maximum exergetic efficiency occurs. Keywords: Energy analysis, exergy analysis, exergy destruction, biodiesel-diesel blends. I. Introduction Today, diesel engines are commonly used in many fields due to their higher efficiency which reaches up to 40%. This situation has led to an increase in the share energy consumption of diesel engines. It is estimated that increasing energy demand cannot be supplied only by fossil fuels. In addition, environmental problems resulting from the use of fossil-based fuels has necessitated the use of renewable and environmentally friendly fuels. In fact, there are many alternative fuels which can be substituted for fossil-based diesel fuel (Tat, 2011). However, biodiesel is the best alternative to the fossil-based diesel fuel in terms of fuel properties, engine performance and emissions. It is widely accepted that biodiesel can reduce HC, CO and PM emissions but slight performance loss in diesel engines (Ozsezen and Canakcı, 2010). Therefore, the use of pure biodiesel or biodiesel-diesel fuel blends in diesel engines increases in all over the world. This kind of development makes attractive to study on using biodiesel-diesel fuel blends in CI engines. Former studies on using biodiesel as an alternative fuel in diesel engine are extensively based on the first law of thermodynamics. Although the first law analysis is sufficient for general performance computations, the insight provided by a second law analysis is invaluable in understanding the details of the overall thermodynamics of engine operation (Caton, 2000). Furthermore, without second law analysis, it is not possible to determine the energy degradation that causes a reduction in work output of the engine (Alkidas, 1988). The second law of thermodynamics provides a distinction between the quantity and quality of energy by taking into account the irreversibilities (Moran and Shapiro, 1988). Therefore, the application of exergy analysis to internal combustion engines is very useful to provide quantitative information on irreversibilities and various exergy losses, and in recent decades, it has been widely applied to internal combustion engines (Sezer and Bilgin, 2013). In literature, there are a lot of papers which apply exergy analysis to internal combustion engines. For application of exergy analysis to internal combustion engines, some researchers used a thermodynamics-based engine cycle model with incorporate second law analysis and the others used experimental data. Zheng and Caton employed an engine cycle simulation incorporating the second law of thermodynamics to evaluate the energy and exergy distribution of various processes associated with injection timings and EGR levels in a low temperature combustion diesel engine (Zheng and Caton, 2012). Sekmen and Yilbası employed the first and second law of thermodynamics to analyze the quantity and quality of energy in a four cylinder, direct injection, water cooled diesel engine operated with diesel fuel and soybean oil methyl ester at constant engine speed (Sekmen and Yilbası, 2011). Azoumah et al. performed an exergy analysis combined with gas emissions analysis to optimize the performance of a compression ignition engine using biofuels such as cottonseed and palm oils, pure or blended with diesel for different engine loads (Azoumah et al., 2009). Rath et al. applied the energy and exergy analysis on a single cylinder four stroke diesel engine using karanja methyl ester under varying compression ratios (Rath et al., 2014). Tat determined the effect of cetane number and ignition delay on the energy and exergy efficiencies of an internal combustion engine fuelled with biodiesel (Tat, 2011). This paper aims to contribute in this field by assessing diesel engine running on biodiesel-diesel fuel blends at full load and various engine speeds. For this purpose, fuel energy and exergy, effective 699

255 power, exhaust heat and exhaust exergy, total heat loss and total heat loss exergy, exergy destruction, and first and second law efficiencies were calculated and the results were compared for all test fuels and operation conditions. II. Experimental Procedure Experiments were carried out on existing test unit at the Mechanical Engineering Department of Karadeniz Technical University produced by Tecquipment. A schematic view of the test unit is shown in Fig. 1. The test unit includes a single cylinder, natural aspirated, four-stroke, air cooled and direct injection diesel engine. Maximum power of the test engine is 7.3 kw (@3600 rpm) and its compression ratio is 20.5:1. The experimental setup enables accurate measurement of engine torque, engine speed, air mass flow rate, fuel volume flow rate and exhaust gas calorimeter cooling water volume flow rate and all the relevant temperatures and pressures. Engine tests were performed at 1000 and 3000 rpm, with intervals of 500 rpm at full load. Test data were recorded by versatile data acquisition system with 0.5-second interval during 10 seconds and the mean values of the data were used for energy and exergy analysis. All measurements are conducted under steady state conditions. calculated from fatty acid distribution. After that the typical formula of B10, B20 and B50 was determined as C14.55H25.82O0.2, C15H26.85O0.4 and C16.38H29.96O1, respectively. Some fuel properties of the test fuels are shown in Table 1. Tab. 1: Some fuel properties of test fuels Properties Diesel B10 B20 B50 Density at 20 C, kg/m Kinematic viscosity at 40 C, mm 2 /s Average molecular mass, kg/kmol Lower heating value, kj/kg Lower heating value, kj/l III. Energy and exergy analysis For energy and exergy analysis the following assumptions were made; the entire engine was considered as a steady-state control volume, fuel and air enter, and effective power, heat loss and exhaust gases leave the control volume at a constant rate as depicted in Fig. 2. The combustion air and exhaust gases are assumed to be ideal gas mixtures and potential and kinetic energy effects of the incoming and outgoing fluid streams are ignored to simplify calculations. Complete combustion is also considered. The reference environment is defined as P 0 = 1 atm and T 0 = 25. Fig. 1: Schematic view of the experimental setup Biodiesel (corn oil methyl ester) was produced in the laboratory from corn oil by transesterification reaction with methanol (CH3OH), where potassium hydroxide (KOH) was used as a catalyst. The reaction parameters giving the lowest kinematic viscosity were chosen as 1.1% catalyst concentration, 60 reaction temperature, 60 minutes reaction time and 9:1 alcohol/oil molar ratio (Gülüm and Bilgin, 2015). Diesel fuel (Euro-diesel) was purchased from a commercial supplier with its typical formula C14.09H24.78 (Canakci, 2007). Produced corn oil biodiesel was then mixed with diesel fuel by ratios of 10, 20 and 50% by volume designated as B10, B20 and B50, respectively. Some important properties of the test fuels such as density (ISO 4787), kinematic viscosity (DIN 53015) and lower heating value (DIN ) were measured in the Prof. Dr. Saadettin GUNER Fuel Research and Application Center at Karadeniz Technical University. Average molecular mass and typical formula of the corn oil biodiesel Fig. 2: Engine as a thermodynamic open system Because the incoming air stream is very close to reference environment state the amount of the energy brought into control volume with it can be ignored. Then the only energy input to the control volume is fuel energy is given by Eq. (1). E f = m fh u (1) Where H u is the lower heating value (kj/kg) and m f is the mass flow rate of the fuel (kg/s), respectively. The effective power of the engine N e (kw) is determined by Eq. (2). N e = Mω10 3 (2) Where ω = πn 30 is angular velocity of the crankshaft, and M and n are torque (Nm) and 700
256 engine speed (rpm), respectively. Energy loss rate due to exhaust gas can be calculated as follows: Q exh = m wc p,w (T w2 T w1 ) (T exh2 T exh3 ) (T exh2 T 0 ) (3) Where m w (kg/s) and c p,w (kj/kg/k) mass flow rate and specific heat of the calorimeter cooling water, T w1 and T w2 cooling water inlet and outlet temperatures, T exh2 and T exh3 exhaust gas temperatures at inlet and outlet of the calorimeter, and T 0 ambient air temperature. Total heat loss per unit time for the control volume was determined by applying energy conservation principle to control volume. E in = E out (4) Q loss = E f N e Q exh (5) Total heat loss comprises all energy lost to the environment by heat transfer. Because friction power is dissipated between the piston assemblies (about half of the total friction), valve mechanism, bearings and engine driven accessories, and it ends up heating the oil or surrounding environment (Pulkrabek, 1997), friction losses evaluated in the total heat loss (Çakmak, 2014). Brake thermal efficiency (first law efficiency) of the control volume is usually defined as the ratio of effective power output to the fuel energy input rate and determined by Eq. (6). When thermomechanical and chemical exergy terms are written in open forms Eq. (10) becomes: n E x exh = i=1 {[h i(t) h i(t 0 )] T 0 [s i(t) s i(t 0 )] + 0 (x i e x ch,i m i μ i + R x i lnx i )} (11) Where m i is the mass flow rate of the i-th component (kg/s), μ i is the molecular mass of the i-th component (kg/kmol), h i(t) is the specific molar enthalpy (kj/kmol) at the exhaust temperature T(K), h i(t 0 ) is the specific molar enthalpy (kj/kmol) at the ambient temperature T 0 (K), s i(t) is the specific entropy (kj/kmol/k) at the exhaust temperature T(K), s i(t 0 ) is the absolute entropy (kj/kmol/k) at the ambient temperature T 0 (K), x i is the molar ratio of the i-th component in 0 the exhaust gas, e x ch,i is the standard chemical exergy of the i-th component (kj/kmol) and R is the universal gas constant (kj/kmol/k). Total heat loss exergy rate was calculated using Eq. (12). E x Q = (1 T loss 0 T e )Q loss (12) Where T 0 and T e are ambient air temperature and engine block temperature, respectively. Units are in K for temperatures in Eq. (12). Under steady-state operation exergy rate balance equation for the control volume can be expressed as: E x f E x Ne E x exh E x Q loss E x dest = 0 (13) ɳ I = N e E f (6) Exergy destruction rate E x dest can be solved from this equation to yield: Input exergy rate, including only chemical exergy of the fuel calculated as E x f = m fex f ch (7) Where ex ch f denotes specific chemical exergy of the fuel and it evaluated using the following expression (Kotas, 1995): ex ch f = [ h o c c s (1 c h )] H c u (8) In Eq. (8) c, h, o and s are mass fractions of carbon, hydrogen, oxygen and sulfur content of the fuel, respectively. Effective power exergy, meaning the net exergy work rate, is also equal to the effective power: E x Ne = N e (9) Exhaust exergy rate is the sum of the thermomechanical and chemical exergy of each component of the exhausted gases in a unit time and it was calculated using the following equation. m i n E x exh = i=1 (e x tm,i + e x ch,i ) (10) μ i 701 E x dest = E x f E x Ne E x exh E x Q loss (14) Finally, the second law (or exergetic) efficiency of the engine can be evaluated from the ratio of the power output to the fuel exergy input rate, i.e., ɳ II = E x N e E x f (15) The experimental data are obtained from measured physical quantities. These quantities have some uncertainties due to uncertainties of measuring tools and measurement systems. Hence, uncertainty analysis should be applied for demonstration reliability of the calculated results. Uncertainties of the calculated results were determined by using by the method proposed by Kline and McClintock given in (Holman, 2001). w R = [( R w x 1 ) 2 + ( R w 1 x 2 ) ( R w 2 x n ) ] n (16) where x 1, x 2,,x n are independent variables, w 1, w 2,, w n are the uncertainties of each independent variables, and w R is the uncertainty of the result R. It was determined that the uncertainty of the first and second law efficiencies varied from % to
257 0.8040% for all the test fuels and engine speeds. Therefore, it can be said that the results have high reliability. IV. Results and discussions Fig. 3 and Fig. 4 show the variation of fuel energy and exergy input rate with the change in engine speed and test fuels. Both fuel energy rate and fuel exergy rate increase with engine speed as expected. Fuel energy and fuel exergy are proportional to lower heating value of the fuel. As seen in figures biodiesel-diesel blends provided slightly less energy and exergy to the engine than diesel fuel. Slight differences between tested fuels can be attributed to the smaller differences between volume-based lower heating values (LHVs) of blend fuels and diesel fuel in compared to mass-based heating values of them. Although mass-based LHV of diesel fuel is 1.36%, 2.64% and 6.86% higher than B10, B20 and B50, respectively, its volume-based heating value is only 0.71%, 1.41% and 3.61% higher than those of blends. Fig. 3: Variations of fuel energy input rate versus engine speed Fig. 4: Variations of fuel exergy input rate versus engine speed slight increase in power output for B10 blend. However, because of the LHV of blend fuels are lower than neat diesel fuel and high viscosity of biodiesel, an increase in biodiesel content in the blend results a decrease in power output of the engine. Fig. 5: Variations of effective power versus engine speed Fig. 6 shows variations of the exhaust heat loss rate and exhaust exergy rate with respect to engine speed. Both of them increase with increasing engine speed due to increased fuel energy and fuel exergy entering the cylinder. Variations of the exhaust heat losses for the tested fuels are originated from differences of the exhaust temperatures. It was observed that exhaust temperatures of the blend fuels do not change linearly with biodiesel percentage. This can be attributed to the different combustion characteristics of each fuel. On average, the exhaust temperature for diesel fuel, B10, B20 and B50 were determined as 419.2, 425.2, and 428.2, respectively. B20 gives maximum exhaust heat loss because of higher exhaust temperature while B10 offers minimum exhaust heat loss. In spite of higher energy input with diesel fuel, higher power output of B10 results in lower energy loss to exhaust. After approximately 2500 rpm exhaust heat loss exceeds the effective power output of the engine. This result is compatible with literature (Pulkrabek, 1997). One item, which needs to be mentioned that there is a big difference between exhaust heat loss rate and exhaust exergy rate for all test fuel, especially lower engine speed. For example, when engine fuelled with diesel fuel exhaust exergy rates are lower % and % than exhaust heat loss rates at 1000 and 3000 rpm, respectively. This implies that only a small amount of exhaust heat can be utilized for useful work (Yasar, 2008). However, in order to improve thermodynamic efficiency exhaust heat loss should be evaluated. Effective power variations of the engine are given in Fig. 5 for tested fuels at full load condition. As seen in the figure the shapes of the power-speed curve are similar to each other. B10 blend gives slightly higher power output than the neat diesel fuel, while B20 and B50 blend give lower power output, although the differences are slight. Oxygen content in the molecular structure of the biodiesel could be the reason for the improvement in combustion giving a 702


258 Fig. 6: Variations of the exhaust heat loss rate and exhaust exergy rate versus engine speed Fig. 7 shows total heat loss rate and total heat loss exergy rate as a function of engine speed at full load operation. As engine speed is increased, mechanical friction, combustion temperature and fluid movement within cylinder increase and this leads to more heat transfer from the engine to surroundings. As seen in the figure the operations with B10 results in higher rates of heat transfer from the engine because it gives the lowest exhaust heat loss as taking into account the energy conservation principle (it can be seen from Eq. 5). By fueling the engine with B10, on average 25.5% of the fuel energy is rejected into the atmosphere and this may be a sign of better combustion (Canakci and Hosoz, 2006) which results in higher combustion temperatures with B10. Also, it can be stated that fueling the engine with B10 leads to shorter ignition delay time which reduces the exhaust temperature but increases total heat loss due to more time for heat transfer from the hot gases to surroundings. Total heat loss exergy is proportional to the heat rejection from the engine and therefore, both of them present nearly the same variations but different in magnitude. As illustrated in Fig.7, for tested fuels total heat loss rate values change from 1.28 kw to 4.32 kw, total heat loss exergy rate values are below 1 kw at all engine speeds and this indicates the energy degradation. Total heat loss from the engine can be reduced by thermal barrier coating. But it causes an increase in exhaust gas temperature and if not recovery, the higher exhaust heat will be rejected to the atmosphere with exhaust gases (Parlak et al., 2005). Exergy destruction rate with respect to the engine speed at full load operation is shown in Fig. 8. In real processes exergy is not conserved and it is destroyed by irreversible processes in the engine, such as combustion, friction, heat transfer along finite temperature gradients, mixing, etc. As seen in the figure for all test fuel, exergy destruction rate increase with increase engine speed due to increasing irreversibilities. It is detected that more than half of the fuel exergy is destroyed and exergy destruction rate are higher than the effective power of the engine at all engine speed. The average value of the exergy destruction rate for diesel, B10, B20 and B50 are calculated as 6.77, 6.56, 6.69 and 6.67 kw, respectively. The most important source of the irreversibility in the internal combustion engine is the combustion process which destroys a significant fraction of the fuel exergy (Ismail and Mehta, 2011). It is estimated that owing to the combined effect of oxygen content and low viscosity of the B10, by using it combustion improve and consequently exergy destruction decreases. Moreover, it can be noted that higher lubricity of biodiesel reduces the mechanical friction particularly in mechanical injection pump which results in less exergy destruction for blend fuels. First law efficiency and second law efficiency of the engine for different engine speeds are shown in Fig. 9 and Fig. 10, respectively. Both efficiencies show the same behaviour but different in magnitude. Because the engine consumes a higher amount of fuel exergy compared to the fuel energy values for the same test fuel, the second law efficiencies lower than the corresponding first law efficiencies. For all test fuels, the first law efficiency of the engine varied from 35.23% to 40.41%, whereas the second law efficiency varied from 33.00% to 37.83%. It is noticed that in Fig. 9 and Fig. 10 biodiesel-diesel fuel blends give better first and second law efficiencies compared to diesel fuel, generally. The improvement in both efficiencies when using biodiesel-diesel fuel blends can be attributed to the oxygen content of the blend fuels which promote a better mixture formation and combustion, and to the higher lubricity of biodiesel which reduces the mechanical friction loss. But, as increasing biodiesel percentage, the viscosity of the fuel also increase which prevent forming a better air-fuel mixture. For this reason, combustion may deteriorate and reduce both efficiencies by increasing biodiesel percentage. When using B10 the positive effect of the oxygen content and good lubricity property become more dominant on the negative effect of the high viscosity. Therefore, maximum first and second law efficiency is obtained at 2000 rpm as and 37.83%, respectively by using B10. Fig.7: Variations of the total heat loss rate and total heat loss exergy rate versus engine speed 703
259 fuel energy, the availability of them are less than 10% of the fuel exergy for all tested fuels. Exergy destruction rate was found to be higher for diesel fuel as compared to blend fuels, on average. For all tested fuel, exergy destruction rate is higher than effective power output at all engine speed. Maximum first and second law efficiency is obtained at 2000 rpm as 40.41% and 37.83%, respectively by fuelling the engine with B10. Nomenclature. Fig. 8: Variations of the exergy destruction rate versus engine speed Fig. 9: Variations of the first law efficiency versus engine speed E f m f H u N e M ω n Q exh m w Q loss E x f ex f ch E x exh E x dest 0 e x ch h s w 1, w 2, w 3,., w n x 1, x 2, x 3,..., x n : Fuel energy enters the cylinder per unit time (kw) : : Mass flow rate of the fuel (kg/s) : : Lower heating value (kj/kg) : : Effective power (kw) : : Torque (Nm) : : Angular velocity (rad/s) : : Engine speed (rpm) : : Exhaust heat per unit time (kw) : Mass flow rate of calorimeter cooling water (kg/s) : Total heat loss per unit time (kw) : Fuel exergy enters the cylinder per unit time (kw) : Specific chemical exergy of the fuel (kj/kmol) : Exhaust exergy per unit time (kw) : Exergy destruction rate (kw) : Standard chemical exergy (kj/kmol) :Specific molar enthalpy (kj/kmol) : Specific entropy (kj/kmol/k) : Uncertainties of independent variables : Independent variables Greek letters ɳ I ɳ II : First law efficiency : Second law efficiency Fig. 10: Variations of the second law efficiency versus engine speed V. Conclusions A single cylinder, natural aspirated, four-stroke, air cooled and direct injection diesel engine fuelled with diesel, B10, B20 and B50 was operated at different engine speed and maximum load. Using data gathered from the experiments, energy and exergy components of the engine was calculated and compared with each other for all fuel operation. All test fuels result approximately similar fuel energy, fuel exergy and effective power. But with B10 it is observed slightly higher effective power output than the other fuels particularly at high engine speeds. Although, the sum of energy value of the exhaust heat loss and total heat loss are % of the Subscript 0 exh dest ch tm f i Abbreviations LHV CI rpm References : Reference environment : Exhaust : Destruction : Chemical : Thermomechanical : Fuel : Component : Lower heating value : Compression ignition : Revolutions per minute Alkidas, A. C., The Application of Availability and Energy Balance to a Diesel Engine, Journal of Engineering for Gas Turbines and Power, Vol.110, pp (1988). 704
260 Azoumah, Y., Blin. J. and Daho, T., Exergy efficiency applied for the performance optimization of a direct injection compression ignition (CI) engine using biofuels, Renewable Energy, Vol. 34, pp (2009). Çakmak, A., Application of Energy and Exergy Analysis to a Single Cylinder Diesel Engine Fuelled with Biodiesel-Diesel Fuel Blends, MS Thesis, Karadeniz Technical University, Graduate School of Natural and Applied Sciences, Trabzon, Turkey (2014). Canakcı, M., Combustion Characteristics of a Turbocharged DI Compression Ignition Engine Fuelled With Petroleum Diesel Fuels and Biodiesel, Biosource Technology, Vol.98, pp (2007). Canakcı, M. and Hosoz, M., Energy and exergy analyses of a diesel engine fuelled with various biodiesels, Energy Sources, Part B, Economics, Planning and Policy, 1:4, pp (2006). Caton, A., A Review of Investigations Using the Second Law of Thermodynamics to Study Internal Combustion Engines, SAE 2000 World Congress, Detroit, Michigan, March 6-9, pp (2000). Gülüm, M. and Bilgin, A., Density, flash point and heating value variations of corn oil biodiesel diesel fuel blends, Fuel Processing Technology, Vol. 134, pp (2015). Rath, M.K., Acharya, S.K., Patnnaik P.P. and Roy, S., Exergy and Energy Analysis of Diesel Engine Using Karanja Methyl Ester Under Varying Compression Ratio, International Journal of Engineering, Transactions B: Application, Vol. 27, pp (2014). Sekmen, P. and Yılbaşı, Z., Application of Energy and Exergy Analyses to a CI engine Using Biodiesel Fuel, Mathematical and Computational Applications, Vol.16, pp (2011). Sezer, I. and Bilgin, A., Effects of Charge Properties on Exergy Balance in Spark Ignition Engines, Fuel, Vol.112, pp (2013). Tat M., E., Cetane Number Effect on the Energetic and Exergetic Efficiency of a Diesel Engine Fuelled with Biodiesel, Fuel Processing Technology, 92, (2011). Yasar, H., First and Second Law Analysis of Low Heat Rejection Diesel Engine, Journal of Energy Institute, Vol.81, No.1, pp (2008). Zheng, J. and Caton, J., A., Second Law Analysis of a Low Temperature Combustion Diesel Engine: Effect of Ignition Timing and Exhaust Gas Recirculation, Energy, Vol.38, pp (2012). Holman J.P., Experimental methods for engineers, Seventh ed., McGraw-Hill, New York (2001). Ismail, S. and Mehta P. S., Evaluation of the Effect of Fuel and Combustion-Related Processes on Exergetic Efficiency, Fuel, Vol. 90, pp (2011). Kotas, T. J., The Exergy Method of Thermal Plant Analysis, Krieger Publishing Company, Malabar, Florida (1995). Moran, M.J. and Shapiro, H.N., Fundamentals of engineering thermodynamics, 3rd edition New York; John Wiley and Sons, ISBN: (1988). Ozsezen A. N., Canakcı M., The emission analysis of an IDI diesel engine fuelled with methyl ester of waste frying palm oil and its blends, Biomass and Bioenergy, 34, (2010). Parlak, A., Yasar, H. and Eldoğan, O., The Effect of Thermal Barrier Coating on a Turbo-charged Diesel Engine Performance and Exergy Potential of The Exhaust Gas, Energy Conversion and Management, Vol.46, pp (2005). Pulkrabek, W., W., Engineering Fundamentals of The Internal Combustion Engine, Prentice Hall, New Jersey (1997). 705
261 Coupled Diesel Engine Hazardous Emissions Fixation, and Microalgae Biomass Production Enhancement D. O. Correa 1, B. Santos 1, J.V.C. Vargas 1,*, A.B. Mariano 1, W. Balmant 1, M.P. Rosa 2, D.C. Savi 3, V. Kava 3, J.C. Ordonez 4 1 Federal University of Paraná (UFPR), Department of Mechanical Engineering, Graduate Program in Materials Science Engineering (PIPE), and Sustainable Energy Research & Development Center (NPDEAS), CP 19011, Curitiba, PR, , Brazil 2 Federal University of Paraná (UFPR), Department of Mechanical Engineering, Graduate Program in Mechanical Engineering (PGMEC), and Sustainable Energy Research & Development Center (NPDEAS), CP 19011, Curitiba, PR, , Brazil 3 Federal University of Paraná (UFPR), Genetics Department, and Sustainable Energy Research & Development Center (NPDEAS), CP 19011, Curitiba, PR, , Brazil 4 Florida State University, Department of Mechanical Engineering, Energy and Sustainability Center and Center for Advanced Power Systems, Tallahassee, Florida, , U.S.A. * [email protected] Abstract Microalgae cultivation has gained increased attention from research and industry sectors in recent years, due to the wide variety of applications for the produced biomass, such as biofuels and substances of high economic value. Additionally, microalgae cultivation could be used for capturing hazardous emissions, lowering CO2, NOx, SOx levels among other unwanted particles and gases content. As a result, this study focused on developing microalgae cultivation using exhaust gases from diesel engines. In order to achieve that objective, four simultaneous cultures were conducted to compare the growth of microalgae under pure air and emissions injection, in different flow regimes. An indigenous microalgae strain was selected to be robust under different weather conditions. This strain was identified through rdna sequence analysis, including ITS1, 5.8S and ITS2 (Internal Transcribed Spacer). The ITS analysis showed no genetic divergence between the utilized strain and Acutodesmus obliquus, which is therefore the species cultivated in this study. The results indicate an increase in biomass production of about 2.8 times for the best case of cultivation with emissions in comparison to cultivation with compressed air. Likewise, cell density results were higher in cultures with emissions as a source of CO2. Besides the growth analyses, the potential for treating the hazardous emissions injected into the system was investigated. Experimental data obtained with a gas analyzer demonstrated that the CO2 and NOx content was substantially reduced with the cultivation with emissions in comparison to cultivation with compressed air, as well as the increase of O2 content, leading to the conclusion that microalgae cultivation with diesel engine emissions was able to perform CO2 fixation, and O2 production through photosynthesis. The experiments also demonstrate that no damage to the microalgae is caused by the diesel engine emissions. Keywords: Biofuels, sustainable energy, microalgae, gas analysis I. Introduction The interest in new technologies that make possible microalgae biomass production has increased substantially in academia and industry in the last decade. This is a result of the many exploration possibilities for that feedstock, both as biofuels source (e.g., biodiesel, biohydrogen), and other high aggregated value products (e.g., pharmaceuticals, proteins, pigments, animal feed). The effect of the growing attention directed to microalgae is the emergence of a new technological niche that has several potential targets. For example, the integration of cultivation systems and hazardous emissions treatment aiming at biomass production enhancement together with pollutants reduction dumped into the atmosphere, such as carbon dioxide (CO2), nitrogen oxides (NOx), and sulfur oxides (SOx). Microalgae are photosynthetic beings, therefore having the capability of converting biologically CO2 rich emissions into biomass, and O2. Microalgae is a term to define unicellular or colonial photosynthetic organisms that live in aquatic or humid media. In general, they are not considered a monophyletic group, i.e., they can originate from different evolution paths, therefore they are an artificial and heterogeneous group (Lourenço, 2006), with low or inexistent cell differentiation. One of the largest algae groups is the green algae group that depict a vegetative structure with an enormous variety of organization levels, from flagellated or not unicellular beings to morphologically complex thalli (Ebenezer et al., 2012). Collectively, algae are extremely important ecologically since they are the primary producers in aquatic systems, supporting the trophic chain. Microalgae could be grown in open (e.g., pools, ponds) or closed systems, i.e., photobioreactors (PBR), that are reactors in which photosynthetic organisms are grown to perform biological reactions (Mata et al., 2010). The former are the most utilized systems, which consist of artificial low depth raceway ponds, aiming at large sun exposure area, and a 706
262 rotating blades system that is responsible for agitation and homogenization of the cultivation medium and gaseous exchanges (Borowitzka, 2005). However, open systems require substantial pure CO2 injection, have lower cultivation conditions control, more contamination probability by external agents, and more available area is required for construction and operation than closed systems. The positive aspect is the expected lower construction and operation cost in comparison to photobioreactors. Possibly, the main advantage of the closed systems is that high density biomass production could be achieved, i.e., by growing vertically, thus not competing with agricultural land. Although pure CO2 injection is not mandatory, i.e., only atmospheric air injection is required (Vargas et al., 2014), when CO2 is injected in the medium, biomass production increases substantially (Suali and Sarbatly, 2012). The interaction among physical, chemical, and biological factors influences directly on microalgae cultivation, likely promoting or inhibiting growth. The biological factors are associated with the cellular metabolism and presence of contaminants in the system, while chemical and physical factors are related to effects caused by light, temperature, ph, and carbon and nutrient sources availability (Raven, 1990; Richmond, 2004; Derner et al., 2006). Microalgae growth involves the consumption of medium dissolved CO2, inducing ph increase (usually > 10). Conversely, medium CO2 concentration increase could reduce ph (< 5), and consequently inhibit some microalgae species growth (Pires et al., 2012). In spite of allowing for medium ph stabilization, the use of buffer solutions could result in prohibitive costs in large scale production systems. Another way of regulating ph variation is aeration, by atmospheric air insufflation (~0.04% de CO2) or with CO2 enriched air, in ideal concentration for the species (Lourenço, 2006). Recent studies evaluated the impact of CO2 on dry biomass productivity: i) Jiang et al. (2013) investigated the influence of CO2 addition in Scenedesmus dimorphus growth in autotrophic cultivation, using a 200 ml photobioreactor. The authors cultivated the microalgae injecting atmospheric air with 0.038%, 2%, 10% and 20% v/v CO2 concentration. The biomass production with 0.038% was significantly smaller than with 2%, 10% and 20% v/v CO2 concentration. Therefore, CO2 injection indeed has a positive effect on productivity, and the highest dry biomass mass concentration was obtained with the 2% v/v CO2 concentration, i.e., reaching 5.17 g L -1 ; ii) A similar study was conducted by Tastan et al. (2013) that analyzed the effect of the combustion products of liquefied petroleum gas (LPG) and gasoline on the growth of two microalgae species. For Phormidium sp. They obtained dry biomass at g L -1 with LPG, and g L -1 with gasoline. For Chlorella sp. the dry biomass productivity was g L-1 with LPG, and g L -1 with gasoline; iii) Praveenkumar et al. (2014) 707 cultivated Chlorella sp. in 500 ml containers for 5 days, and added coal combustion emissions with an average 13.3% v/v average CO2 concentration. The dry biomass productivity was 1.7 g L -1, and iv) Chiu et al. (2011) used wild strains and mutants of Chlorella sp. cultivated in a 800 ml PBR during 6 days with the addition of coke emissions from an oven, with 25% v/v CO2 concentration. For the wild strain the best dry biomass productivity was 1.5 g L -1, while for the mutant strain 2.5 g L -1 was obtained. The authors pointed out that no inhibitory effect was observed due to the presence of NOx in the gas mixture, and reasoned that possibly such gases were converted to NO2 and NO3 in the process, and absorbed by the microalgae as a source of nitrogen. Such studies clearly demonstrate the potential of CO2-rich emissions for dry biomass productivity enhancement. However, since the cultivation volumes were small, the extrapolation of the results to larger systems is at least questionable. Due to the potential for utilizing combustion emissions to boost microalgae dry biomass productivity and diverse pollutants fixation, studies are needed to investigate such effects at a larger scale cultivation than the studies found in the literature. Therefore, the general objective of this work is to develop and characterize the cultivation of microalgae in 11 L airlift photobioreactors (PBR) shown in Fig. 1, fed by hazardous diesel engine emissions. II. Materials and methods In order to achieve the established general objective, the work was divided in the following specific objectives: Identify the selected microalgae wild strain through rdna sequence analysis; Develop and modify an 11 L airlift photobioreactor prototype, as shown in Fig.1, for microalgae cultivation fed by diesel engine emissions; Quantify microalgae growth with pure atmospheric air and with CO2-rich diesel engine emissions injection; Analyze the produced biomass composition regarding the potential for biofuel production, and Determine the cultivation system potential to treat diesel engine emissions. II.1. Microalgae wild species identification The identification process for the main strain used in this study was the rdna sequence and micromorphological analysis. In order to isolate the microalgae from coexistent microorganisms, the purification process was carried out using a serial dilution technique in saline solution (NaCl 0.8% w/v) combined with sequential cultures of dilution aliquots in solid medium CHU (Tale et al., 2014; Tripathi et al., 2015). The pure colonies were selected and grown in liquid medium CHU, and the genomic DNA was extracted using the NucleoSpin Plant II kit (Macherey-Nagel, Düren, Germany). For microalgae
 was amplified and sequenced using the primers LS266 and V9G (Gerrits van Den Ende and De Hoog, 1999) designed initially for fungi but annealing in a")
263 molecular identification, the region including ITS1, 5.8S and ITS2 (Internal Transcribed Spacer) was amplified and sequenced using the primers LS266 and V9G (Gerrits van Den Ende and De Hoog, 1999) designed initially for fungi but annealing in a conserved region of 18S and 28S, working for other eukaryotic organisms. For the PCR, 10 ng of DNA was added at PCR mix (12.5 µl amplification reaction: 1.25 µl 10X PCR buffer, 0.25 µl each PCR primer (10 mm), 1 µl dntp mix (10 mm), µl MgCl2 (50 mm), 3.0 U Taq DNA and sterile MilliQ water). The reaction conditions were initial denaturation at 94 ºC for 5 min, followed by 30 cycles of denaturation at 94 ºC for 30 s, annealing for 45 s at 56 ºC and extension at 72 ºC for 60 s. A final extension was performed at 72 ºC for 10 min. The PCR was performed in a termocycler Eppendorf Mastercycler. Reaction products were electrophoresed on a 1% agarose gel and checked with GelRed (Life Technologies, USA) under UV light. The PCR products were purified with Exo1 and Fastap enzymes (GE Healthcare, USA), sequenced using Taq DyeDeoxy Terminator Cycle Sequencing Kit in the Automatic sequencer model ABI Prism 3500 (Applied Biosystems). The sequences were aligned using MegaBACE programs (Tamura et al., 2013) and compared with sequences available in the NCBI database using the BLAST tool (Altschul, 1990). The morphological characterization was performed using the microscope Axio Imager Z2 (Carl Zeiss, Jena, DE), equipped with Metafer 4 software automated capture (Metasystems, Altlussheim, DE) using the camera CoolCube monochrome 1 - Metasystems. module is built with transparent polyvinyl chloride (PVC) pipes, which allows for sunlight passage, and has an approximate volume of 11 L. An air compressor system supplies either atmospheric air or diesel engine emissions for all PBR moduli. The module structure consists of two 1.2 m long tubes that are attached to a wall vertically forming a closed circulation loop, as shown in Fig. 1. In the airlift PBR, the atmospheric gas supply driven by a compressor enters the system at the bottom of the tube, and serves both to supply CO2 to the fluid and to induce the flow circulation pattern, therefore not requiring a pump for such task. A diesel/biodiesel driven 50 kw genset, manufactured by Battistella-Maquigeral Ltd., was utilized to generate the gas emissions. Since the engine exhaust emissions are hot, a one tube pass shell and tube heat exchanger was used to cool down the emissions before entering the compressor reservoir in which they were stored for later use at a maximum 12 bar pressure. Tap water was used as the cold fluid stream. A pressure regulator valve supplied both pure atmospheric air and the emissions to the PBR in order to keep a constant PBR input pressure, and thus a constant mass flow rate. The air lift cultivations were conducted with a synthetic medium (Chu, 1942). The experiments had a 14-day duration in a total of 4 PBR in order to compare growth and biomass production, as follows: 1) atmospheric air injection, with a 1 L min -1 comp air volumetric flow rate; 2) combustion gases injection, with a 1 L min -1 emission 1 volumetric flow rate; 3) combustion gases injection, with a 2 L min -1 emission 2 volumetric flow rate, and 4) combustion gases injection, with a 3 L min -1 emission 3 volumetric flow rate. The combustion gases injection had an 8-hour duration per day aiming at maximizing the use of sunlight, and CO2 fixation through photosynthesis, thus avoiding excessive ph reduction. In the other 16 hours of the day, including the night period, the medium was fed with compressed atmospheric air. Since the cultivations were conducted outdoors, luminosity, photoperiod, and ambient temperature were not controlled, but were monitored. In this way, it was possible to evaluate the PBR response to realistic environmental conditions aiming at possible future commercialization. II.3. Microalgae growth quantification Fig. 1: Four modules of 11 L airlift photobioreactors. II.2. Airlift photobioreactor development An existing 4-module column airlift PBR prototype shown in Fig. 1 was adapted for processing diesel engine emissions, and utilized in this study. Each 708 The determination of microalgae growth was done on a daily basis, using cell concentration parameters, optical density, dry biomass, ph variation, temperature data, luminosity, and system productivity. Cell concentration variation was determined through direct counting in an optical microscope Bioval TM with a 400x magnifying setting. For that, the cultivation samples were collected and prepared in Neubauer
264 chambers, in which triplicate countings were performed, according to methodology described by Lourenço (2006). The methodology to quantify dry biomass consists of fitering samples with a known volume, and weighing the membrane before and after the process. For that, glass microfiber membranes are selected. The process is conducted three times in order to compute uncertainties, as follows: i) the medium free membranes are dried in a 60 o C greenhouse for 24 h, and kept in silica; ii) weigh the membrane on a precision digital scale; iii) 25 ml cultivation samples are filtered with the dry membranes using a vacuum pump; iv) dry the membranes in a 60 o C greenhouse for 24 h, and keep in silica, and v) weigh the membranes. The produced dry biomass is calculated as follows: 5 C, recovering the supernatant with a Pasteur pipette and preserve in other tube (tube 2); vii) add 1.5 ml of the mixture chloroform:methanol (2:1, v:v) to the sedimented biomass and centrifuge again in the same conditions; viii) recover the supernatant and transfer to tube 2, agitating and centrifuging again; ix) recover the lower phase with a Pasteur pipette and preserve (tube 3); x) wash the aqueous phase (tube 2) with 1 ml of chloroform, agitate and centrifuge again, recovering the lower phase and transferring to tube 3; xi) in an extraction space, dry the chloroform:lipids phase (tube 3) with gaseous nitrogen, and xii) use the gravimetric method to determine the total lipids content. The total lipids content was evaluated through the ratio between the obtained extraction values and the dry biomass used in procedure, as follows: V2 V1 L t 100 (3) b M (1) 2 M B 1 S Vf where Bs = produced dry biomass (g L -1 ), M1 = medium free dry membrane mass (g), M2 = mass of membrane with filtered biomass (g), and Vf = filtered volume (L). In order to better describe the experimental growth, the experimental data was curve fitted by the growth logistic equation for cell density and dry biomass, as follows: Nmax N N max 1 e N0 1. t (2) in which, N = cell density (cel ml -1 ), N0 = initial cell density (cel ml -1 ), Nmax = maximum cell density (cel ml -1 ), µ = specific growth rate (day -1 ), and t = cultivation time (day). The cultivation medium ph was monitored using a phmeter Tecnal TM, model TE-058. The measurements were taken every 2 hours aiming at capturing the effect of combustion gases addition on the medium ph reduction. II.4. Produced biomass composition In order to evaluate the microalgae potential for biodiesel production, total lipids in the dry biomass was quantified. For that, the Bligh-Dyer methodology was used, adapted from the work of Soares (2010), with the following steps: i) weigh 50 mg of dry biomass in a 12 ml polypropylene tube (tube 1); ii) add 3 ml of a mixture chloroform:methanol (2:1, v:v) and 10 µl of a BHT solution (1% in methanol); iii) treat with ultrasound for 3 cycles of 15 min each; iv) incubate the tubes wrapped in aluminum foil for 24 h at 4 C; v) treat with ultrasound again for 3 cycles of 15 min each; vi) centrifuge at 5000 rpm for 5 min at 709 where Lt = total lipids (%), V1 = empty vial mass (g), V2 = vial with oil mass (g), and b = dry biomass used for extraction (g). II.5. Potential to treat diesel engine emissions The combustion gases from the diesel genset were analyzed at the inlet and outlet of the cultivation aiming at determining the initial and final gas composition, as well as the potential for removing hazardous emissions with the microalgae. A gas analyzer LANDCOM TM, model LAND III was utilized. The analyzed gases are carbon monoxide (CO), sulfur dioxide (SO2), oxygen (O2), nitrogen dioxide (NO2), nitric oxide (NO), non burnt hydrocarbons (CxHy), hydrogen sulphate (H2S), carbon dioxide (CO2), and nitrogen oxides (NOx). II.6. Uncertainty analysis The calculation of experimental uncertainties is essential for the adequate evaluation of the obtained results. Through the cell density, produced dry biomass and lipid content measurements during the transient evolution of the system and at steady state conditions, it is sought to experimentally determine how the four tested systems compare to each other. Such results contain uncertainties due to the measurement process and instrumentation that need to be quantified. The average of the measurements taken in three runs was utilized to estimate system production. The precision limit of the measurements was calculated as twice the standard deviation of the experimental runs assuming that the population follows a symmetric unimodal normal distribution, within a 95 % confidence interval (Lipschutz and Lipson, 2000). In this work, the evaluated quantities uncertainties were estimated according to standard criteria from the American Society of Mechanical Engineers,
265 ASME (Kim et al., 1993). The measurements uncertainties are therefore obtained as follows: U a 2 a 2 a P B or Ua a Pa a 2 Ba a 2 (4) value with atmospheric air was 0.73±0.03 g L -1, whereas combustion gases injection experiments depicted maximum produced biomass values as follows: i) 1.66±0,04 g L -1 for emission 1; ii) 2.04±0.05 g L -1 for emission 2, and iii) 1.80±0.03 g L -1 for emission 3. where B a = quantity a s bias limit, and precision limit, i.e.,. Therefore, Ua is quantity a s measurements uncertainty, with a being the measured quantities (e.g., cell density, produced dry biomass, lipid content). 2 a In order to determine significant differences between two samples, the t-distribution statistic test was applied with a significance level of 5%, i.e., p > 0.05 means that no significant difference is observed between the samples, and p < 0.05 means that there were significant differences between the samples. III. Results and discussion The results are presented in three sections. The first refers to the microalgae species identification. The second shows the cultivation growth and cell density data, produced dry biomass, ph variation in the period, and dry biomass lipid content. The third section presents the combustion gases composition analyses, as well as their fixation through the microalgae. III.1. Microalgae wild species identification The DNA sequences analysis showed no genetic divergence with the species Scenedesmus obliquus and Acutodesmus obliquus. By microscopy analyses, general characteristics shared by the Scenedesmus and Acutodesmus genus were observed, such as oval or cylindrical cells with obtuse or truncate poles, without spines, in flat or slightly curved coenobia and smooth cell wall (Krienitz and Bock, 2012). Due to the plasticity of such organisms, a significant number of different species described according to their morphology are being revised, supported by molecular data, reducing the number of validated taxa. In a study based on molecular data of Scenedesmaceae family, Hegewald et al. (2013) proposed that this species should be identified as Acutodesmus obliquus. III.2. Biomass growth Both cell density (cel ml -1 ) and dry biomass (g L -1 ) measurements were performed. However, since there is a direct relationship between such quantities, and for brevity, only produced dry biomass results are herein shown. The initial biomass at t = 0 day was the same in all experiments (0.29±0.03 g L -1 ) that increased continuously from the first day, noting that the growth rate was higher for the cultivations with combustion gases injection than with atmospheric air. Figure 2 illustrates the dry biomass production for the 14-day experiments. The highest registered biomass P a = 710 X B (g L -1 ) t (day) Fig. 2: Biomass concentration during the 14-day experiments. The highest registered dry biomass value in the experiments with emissions injection was approximately 2.8 times higher than the maximum value obtained in the experiment with atmospheric air injection. Among the tested emissions injection flow rates, the most productive one was 2 L min -1, since the highest cell density and produced dry biomass were achieved. Table 1 summarizes the produced dry biomass in all shown, as a result of the experimental data curve fitting of the growth logistic equation for produced dry biomass. The last column shows the generation time, G2, which is defined as the time the system takes to double the biomass. Figure 3 depicts the experimental data and the curve fit obtained with Eq. (2), only for atmospheric air and emission 2, for brevity. Tab. 1: Produced dry biomass in each experiment. PBR comp air comp air emission 1 emission 2 emission 3 Biomass (g L -1 ) start final µ (day -1 ) G 2 (day) 0.73± emission ± ±0.03 emission ± emission ± As discussed earlier in the text, Jiang et al. (2013) investigated the influence of CO2 addition in Scenedesmus dimorphus growth in autotrophic cultivation, and the highest dry biomass mass concentration was obtained with the 2% v/v CO2 concentration, i.e., reaching 5.17 g L -1. However, such high value could be related to the fact that pure gases were used in the experiment, not from emissions, therefore disconsidering all other
 0.00 0 1 2 3 4 5 6 7 8 9 10 11 12 13 14 t (day) Fig.")
266 substances present in combustion emissions. Additionally, the injection was controlled, i.e., as the ph became acid, gas injection was interrupted, and restarted when ph became neutral again. Last, but not least, the experiments were conducted in a 200 ml PBR, i.e., at the laboratory scale. X B (g L -1 ) t (day) Fig. 3: Biomass concentration logistic curve fit for the atmospheric air and emission 2 experiments. In the cultivation with atmospheric air, there was a daily oscillation in the ph values. In general, there was a tendency to increase ph along the 14-day experiment. The ph started at 7.3 and finished at 10.6 on the 14 th day. Since CO2 present in air is entirely consumed by photosynthesis, the ph does not decrease. On the other hand, for the cultivations with emissions injection, there is a pattern of acidification in the medium in the first 2 hours, up to the point the medium is CO2 saturated. Initially CO2 reacts with water and forms carbonic acid (H2CO3), leading to ph reduction. After that point, the ph tends to stabilize. As CO2 concentration increases, microalgae growth increases as well, thus resulting in more consumption of dissolved CO2. Figure 4 summarizes the results by showing the final ph reading at the end of each day in all experiments, i.e., after 8 hours of emission injection. It is important to point out that the microalgae were capable of bearing ph variations from 6.3 to 10.8 in the experiments comp air - exp comp air - adjust emission 2 - exp emission 2 - adjust comp air emission 1 emission 2 emission 3 lipid extract was more greenish than the emission injection experiments. This result is probably due to less chlorofil in the biomass generated with combustion gases, or the action of emission components on the biomass that altered the color. Fig. 5: Lipids extracted from the produced dry biomass. The dry biomass lipid content includes fatty acids which could be transformed in biodiesel, and all other lipidic substances (e.g., cell membrane, energy reserve, photosynthetic pigments). At first, the expectation was that the lipid content of the biomass obtained with emission injection would be greater than with atmospheric air, since more CO2 availability could direct the algae metabolism to synthesize and store reserve material. However, there were no significant differences among the experiments in lipid content as it is shown by Table 2. Despite that, when the total generated biomass in each reactor was taken into account (cultivation final concentration), it was observed that there was an increase up to 285% in the total lipids production with combustion gases injection. Tab. 2: Produced dry biomass and total lipids. Total Lipid Total lipids PBR biomass (g) content (%) (g) comp air ± emission ± emission ± emission ± ph 9 III.3. Emission treatment analyses t (day) Fig. 4: The daily ph variation in all experiments. Figure 5 shows the lipid extract obtained in the experiments. The color pattern of the atmospheric air 711 The high CO2 concentration in the emissions cultivations was responsible for larger growth rate and dry biomass production than in the atmospheric air cultivation. Although the emissions composition contains other gases in high concentration, such as CO and nitrogen oxides (NO2. NO e NOx), their presence did not affect microalgae growth. In fact, NO2, CO2, and NOx dropped for all emissions experiments, and O2 concentration increased. Table 3 shows the measured data on the flue gases
267 composition analyzed at the input and output of systems emission 1, emission 2, and emission 3. Each value represents the average of the 14-day experiments, followed by the uncertainties calculated according to the theory of section II.6. Tab. 3: Composition of flue gases (PBR input and output). Gases Input Emis-si Emis-si Emis-si on 1 on 2 on 3 U a CO (ppm) SO 2 (ppm) O 2 (%) NO 2 (ppm) NO (ppm) C xh y (%) H 2S (ppm) CO 2 (%) NO X(ppm) The atmospheric air cultivation had a CO2 fixation average of 0.3 g day -1, with a daily variation from 0 to 0.4 g, whereas O2 production was 0.2 g day -1 on average, in the period, and a daily variation from 0 to 0.7 g. For emission 1, the CO2 fixation average was 9.5 g day -1, with a daily variation from 2 to 18.6 g, whereas the average O2 production was 9 g day -1, varying from 1.4 to 19.9 g. For a) emission 2 and b) emission 3, CO2 fixation average, daily variation, and average O2 production, variation were respectively: a) 5.3 g day -1, 0.2 to 20.6 g; 4.2 g day -1, 0 to 20.6 g, and b) 2.6 g day -1, 0 to 7.9 g; 1.9 g day -1, 0 to 6.2 g. Based on the measured results, emission 1 was the cultivation that showed the highest CO2 fixation and O2 production. This is a distinct result from the previous one obtained for the highest dry biomass production, that pointed to emission 2. A possible physical explanation for the observed trends is that the intermediate volumetric flow rate (2 L min -1 ) provides an optimal solubilization of the gases in the liquid medium for maximum biomass production, whereas with a lower volumetric flow rate (1 L min -1 ) there are more dissolved gases due to the low bubbles speed in the medium, and with a higher volumetric flow rate (3 L min -1 ) the soluble gases concentrations are reduced since the bubbles speed is higher, which results in lower mass transfer rate between the gaseous and liquid phases. Table 4 summarizes the results obtained for CO2 fixation and O2 production with all the experiments. Numerically, it is seen that emission 1 depicted the largest total CO2 fixation and O2 production in the 14-day experiments. Figures 5 and 6 show a comparison of the daily variation of CO2 fixation and O2 production for emission 1 and 2. Clearly, there is an oscillating pattern for net CO2 fixation and O2 production. This is a result of the microalgae growth, which results in increasing need of CO2 (for photosynthesis) and O2 (for respiration), therefore in a continuous balance of consumption and production. Tab. 4: CO2 fixation and O2 production. Gases PBR Minimum Maximum Total (g) comp air CO 2 emission fixation (g day -1 emission ) emission O 2 comp air produc-ti emission on emission (g day -1 ) emission CO 2 (g) O 2 (g) emission 1 emission t (day) Fig. 5: CO2 fixation Emission 1 Emission t (day) Fig. 6: O2 production. The NOx variation data in the experiments performed with emissions injection indicate that microalgae have the capability of fixating them too. Figure 7 shows the measured NOx data in the emissions cultivations. There were significant differences between the readings at the input and output for each PBR. In all days there was NOx concentration reduction in the cultivations supplied with emissions, varying from 24.7% to 87.1% in the period of 14 days. Note that as in the case of CO2 fixation, in general, the highest NOx concentration reduction values were observed in system emission 1. The possible physical explanation for that result is the same as the one presented earlier in the text for CO2 fixation, i.e., the lower the gas speed, the higher the solubilization. However, scientific investigation is needed for a better understanding of the biochemical routes that lead to both CO2 fixation and NOx absorption by the 712
268 microalgae, which is not within the scope of this study. NO X (ppm) comp air emission 1 emission 2 emission 3 V. Conclusions t (day) Fig. 7: NOX reduction. In this paper, a method for CO2-rich emissions fixation was investigated. For that, microalgae cultivation using exhaust gases from diesel engines was conducted in four simultaneous cultures to compare the growth of microalgae under pure air and emissions injection, in different flow regimes. Based on the obtained results, the key conclusions are: 1. The microalgae species used in the experiments was identified as Acutodesmus obliquus; 2. The microalgae were tested in 11-liter airlift photobioreactors, i.e., at a larger scale than previously CO2 fixation published studies, and tolerated the combustion gases injection, with a large ph variation during the experiments, showing robustness for possible future practical applications; 3. Emissions injection increased dry biomass production up to 2.8 times in comparison to atmospheric air injection cultivations; 4. Although no significant difference was observed in lipid content in the four experiments, due to the higher biomass productivity, the total lipids production increased up to 285% in the emission injection cultivation in comparison to the atmospheric air one, and 5. All emission injection cultivations showed significant net CO2 fixation, O2 production, and NOx absorption rates, demonstrating the microalgae potential for large scale hazardous emissions treatment in future industrial applications. Acknowledgements This research was supported by the National Council for Scientific and Technological Development, CNPq, Brazil, projects /2013-0, /2013-6, and /2013-0, and by the Araucaria Foundation, Parana, Brazil, project / Nomenclature b : Dry biomass used for extraction (g) Ba : Bias limit of quantity a BS : Produced dry biomass (g L -1 ) G2 : Time to double the biomass (day) Lt : Total lipids (%) M1 : Medium free dry membrane mass (g) M2 : Mass of membrane with biomass (g) N : Cell density (cel ml -1 ) N0 : Initial cell density (cel ml -1 ) p : probability Pa : Precision limit of quantity a t : Cultivation time (day) Ua : Uncertainty of quantity a V1 : Empty vial mass (g) V2 : Vial with oil mass (g) Vf : Filtered volume (L) XB : Biomass concentration (g L -1 ) Greek letters : Specific growth rate (day -1 ) : Standard deviation Subscripts max : Maximum References Altschul S.F.,Gish W., Miller W., Myers E.W., Lipman D.J., Basic local alignment search tool, Journal of Molecular Biology, 215, (1990). Borowitzka M.A., Culturing microalgae in outdoor ponds. In: Anderson RA (ed) Algal culturing techniques. Elsevier Academic, London, , (2005). Chiu S.Y., Kao C.Y., Huang T.T., Lin C.J., Ong S.C., Chen C.D.,..., Lin C.S. Microalgal biomass production and on-site bioremediation of carbon dioxide, nitrogen oxide and sulfur dioxide from flue gas using Chlorella sp. cultures. Bioresource Technology, 102, (2011). Chu S.P. The influence of the mineral composition of the medium on the growth of planktonic algae: part I. Methods and culture media, The Journal of Ecology, 30, , (1942). Derner R.B., Ohse S., Villela M., Carvalho S.M.D., Fett R., Microalgae, products and applications, Ciência Rural, 36, (2006). Ebenezer V., Medlin L.K., Ki J.S., Molecular detection, quantification, and diversity evaluation of microalgae, Marine Biotechnology, 14, (2012). Gerrits van den Ende A.H.G., de Hoog G.S., Variability and molecular diagnostics of the neurotropic species Cladophialophora bantiana, Studies in Mycology, 43, (1999). Hegewald E., Bock C., Krienitz L., A phylogenetic study on Scenedesmaceae with the description of a new species of Pectinodesmus and the new genera
269 Verrucodesmus and Chodatodesmus (Chlorophyta, Chlorophyceae), Fottea, 13, (2013). Jiang Y., Zhang W., Wang J., Chen Y., Shen S., Liu T., Utilization of simulated flue gas for cultivation of Scenedesmus dimorphus, Bioresource Technology, 128, (2013). Kim J.H., Simon T.W., Viskanta R., Journal of heat transfer policy on reporting uncertainties in experimental measurements and results [editorial], Journal of Heat Transfer, 115, 5-6, (1993). Krienitz L., Bock C. Present state of the systematics of planktonic coccoid green algae of inland waters, Hydrobiologia, 698, (2012). Lipschutz S., Lipson M.L., Theory and Problems of Probability, 2nd Ed. McGraw-Hill, New York (2000). Tamura K., Stecher G., Peterson D., Filipski A., Kumar S., MEGA6: Molecular Evolutionary Genetics Analysis Version 6.0, Molecular Biology and Evolution, 30, (2013). Tastan B.E., Duygu E., İlbaş M., Dönmez G., Utilization of LPG and gasoline engine exhaust emissions by microalgae, Journal of Hazardous Materials, 246, (2013). Tripathi R., Singh J., Thakur I. S., Characterization of microalga Scenedesmus sp. ISTGA1 for potential CO2 sequestration and biodiesel production, Renewable Energy, 74, (2015). Vargas J.V.C., Mariano A.B., Corrêa D.O., Ordonez J.C., The microalgae derived hydrogen process in compact photobioreactors, International Journal of Hydrogen Energy, 39, (2014). Lourenço S.O., Seawater Microalgae Cultivation: Principles and Applications. São Carlos, SP, Brazil: RiMa (2006). (in Portuguese) Mata T.M., Martins A.A., Caetano N.S., Microalgae for biodiesel production and other applications: A review. Renewable and Sustainable Energy Reviews, 14, (2010). Pires J.C.M., Alvim-Ferraz M.C.M., Martins F.G., Simões M., Carbon dioxide capture from flue gases using microalgae: engineering aspects and biorefinery concept, Renewable and Sustainable Energy Reviews, 16, (2012). Praveenkumar R., Kim B., Choi E., Lee K., Park J.Y., Lee J.S.,, Oh Y.K., Improved biomass and lipid production in a mixotrophic culture of Chlorella sp. KR-1 with addition of coal-fired flue-gas, Bioresource Technology, 171, (2014). Raven J.A., Sensing ph?, Plant, Cell & Environment, 13, (1990). Richmond A., Principles for attaining maximal microalgal productivity in photobioreactors: an overview. In: Asian Pacific Phycology in the 21st Century: Prospects and Challenges. Springer Netherlands, (2004). Soares D., Evaluation of cell growth, and lipids productivity of sewater microalgae in diffrent cultivation regimes, Master Thesis, Universidade Federal do Paraná, Brazil (2010). (in Portuguese) Suali E., Sarbatly R., Conversion of microalgae to biofuel, Renewable and Sustainable Energy Reviews, 16, (2012). Tale M., Ghosh S., Kapadnis B., Kale, S., Isolation and characterization of microalgae for biodiesel production from Nisargruna biogas plant effluent, Bioresource Technology, 169, (2014). 714
270 Regression Models for Predicting Some Important Fuel Properties of Corn Oil Biodiesel-Diesel Fuel Blends Atilla Bilgin *, Mert Gulum Karadeniz Technical University, Faculty of Engineering, Mechanical Engineering Department Trabzon, 61080, TURKEY * [email protected] Abstract In this study, corn oil biodiesel was produced and blended with commercially available petro-diesel fuel at 5, 10, 15, 20, 25, 50 and 75% on a volume basis. The some important fuel properties such as kinematic viscosity, flash point temperature and higher heating value of the prepared blends were measured according to the related international standards. The effects of temperature and biodiesel percentage on the fuel properties of the blends were assessed. In the light of this assessment, in order to estimate these properties, new one-dimensional lineal models were fitted to the measurements and derived by using the least squares method. For the tried models, calculated regression constants and correlation coefficients were given as tables. Keywords: Alternative fuels, corn oil biodiesel, biodiesel-diesel fuel blends, fuel properties, prediction models. I. Introduction Concerns over global warming, environmental degradation and national energy independence have developed interest in alternative fuels (Turns, 2012). Currently, biodiesel is receiving a lot of attention as clean and renewable alternative fuel for diesel engines. Biodiesel consists of fatty acid alkyl esters which are obtained through transesterification reaction of vegetable oils and animal fats with an alcohol (most commonly methanol or ethanol) in the presence of a suitable catalyst (Rezaei et al., 2013). Even though biodiesel cannot entirely replace petro-diesel fuel (hereafter referred to as diesel fuel), it has many advantages such as: (1) It is non-toxic, contains no aromatics and has higher biodegradability than diesel fuel (Ozener et al., 2014). (2) It is an oxygenated fuel that contains about 10 to 12% oxygen by mass in the molecular structure, thus improving combustion efficiency and producing fewer harmful emissions and pollutants such as particulate matter (PM), unburned or half-burned hydrocarbons (HC) and carbon monoxide (CO) (Ozener et al., 2014). (3) It improves lubricity, which results in longer engine component life (Ferrão et al., 2011). (4) It can be produced by using domestic renewable feedstock, thus reducing the dependence on imported petroleum. (5) It has higher cetane number (48-67) compared to diesel fuel (40-55) which causes shorter ignition delay, generally lower NOx emissions and lesser occurrence of knocking phenomena in combustion process (Sakthivel et al., 2014). (6) Biodiesel has higher flash point temperature than diesel fuel, which makes it safer to transport and handle (Encinar et al., 2005). (7) It can be completely miscible with diesel fuel, allowing the blending of these two fuels in any proportion (Benjumea et al., 2008). Although these properties make biodiesel an ideal fuel for diesel engines, it has also some disadvantages such as lower heat of combustion and volatility, and higher viscosity and cloud point temperature (Radue al., 2016), (Verduzco et al., 2011). As the use of biodiesel becomes more widespread, researchers have shown a strong interest in modeling the combustion process in the engine in order to understand the fundamental characteristics of biodiesel combustion (Yuan et al., 2003). They often use physical properties of biodiesels as input data in their combustion models. However, it may not be practical at every turn to make the measurements of physical properties of biodiesels or biodiesel-diesel fuel blends for each blending ratio or temperature in any study. For this reason, regression equations have been generally used to calculate these properties without measurements. Some studies reporting these equations are summarized as following. Gülüm and Bilgin investigated the variations of densities, flash point temperatures and higher heating values of corn oil biodiesel-ultra Force Euro diesel fuel blends. The authors proposed new one- and two-dimensional models to predict these fuel properties (Gülüm and Bilgin, 2015). Joshi and Pegg determined cloud point and pour point temperatures, and dynamic viscosities of biodiesel-diesel fuel blends at low temperatures. Arrhenius equation as a function of temperature was used to predict the viscosities. Also, polynomial equations as a function of biodiesel fraction were developed to estimate both the pour point and cloud point temperatures (Joshi and Pegg, 2007). Benjumea et al. measured some basic fuel properties (viscosity, density, heating value, cloud point, calculated cetane index and T10, T50 and T90 distillation temperatures) of several palm oil biodiesel-diesel fuel blends. Arrhenius type equation and Kay s mixing rules were used in order to predict kinematic viscosity and the other properties, 715
271 respectively (Benjumea et al., 2008). Alptekin and Canakci measured densities and kinematic viscosities of biodiesels derived from six different vegetable oils and their blends with two different type diesel fuels. Linear and Arrhenius mixing equations were used to predict densities and viscosities of the blends, respectively (Alptekin and Canakci, 2009). Fahd et al. densities, dynamic viscosities and higher heating values of waste cooking palm oil biodiesel and its blends with No. 2 diesel fuel were investigated under varying temperatures and blend ratios. The proposed correlations for density and dynamic viscosity were respectively compared with Kay s mixing rule and Grunberg-Nissan mixing rule theory in order to validate their applicability (Fahd et al., 2014). pycnometer, top loading balance with an accuracy of 0.01 g, Haake Water Bath and a stopwatch with an accuracy of 0.01 s were used to measure dynamic viscosity and density. Before starting the reaction, the catalyst was dissolved in methanol to make alcoholic solution of catalyst in a narrow-neck flask. In the flat bottomed flask, the alcoholic solution was added to the 200 g corn or hazelnut oil formerly warmed to about 80 in a beaker. These reactants were mixed with stirring speed of 500 rpm by means of the magnetic stirrer heater. After the reaction, glycerol was removed by a separating funnel, while biodiesel was washed with warm distilled water and then heated at about 100 to remove reaction residues (methyl alcohol and water residuals (Gülüm and Bilgin, 2015). The present study focuses two main objectives. First objective is to identify the effects of temperature and biodiesel percentage in blend on some important fuel properties such as kinematic viscosity, flash point temperature and higher heating value of corn oil biodiesel-diesel fuel blends. Second objective is to develop new one-dimensional lineal equations by applying the least squares regression to experimental data. To achieve these objectives, corn oil biodiesel, which was produced by using sodium hydroxide (NaOH) as catalyst and methanol (CH3OH) as alcohol, was blended at the volume ratios of 5, 10, 15, 20, 25, 50 and 75% with commercially available Ultra Force Euro diesel fuel (D) purchased from Shell, and then the fuel properties of each blends were measured according to the related international standards. II. Experimental Methods II.1. Biodiesel production In this study, commercially available refined corn oil was used in biodiesel production. It was not needed to perform a pretreatment to the oil because of being refined. Thus, methanol (CH3OH) of 99.8% purity as alcohol and pure grade sodium hydroxide (NaOH) as catalyst were preferred in transesterification reaction. In master s thesis by Gülüm (Gülüm, 2014), many reaction parameters, which influence the transesterification reaction, such as catalyst concentration, reaction temperature, reaction time and alcohol/oil molar ratio were varied within the ranges of %, 40-70, minutes and 3:1-12:1, respectively, and the effects of these parameters on changes of densities and dynamic and kinematic viscosities of produced biodiesels were investigated parametrically to produce corn oil biodiesel having the highest methyl ester contents. The reaction parameters for the transesterification of corn oil were determined as 0.90 % catalyst concentration, 50 reaction temperature, 60 minute reaction time and 6:1 alcohol/oil molar ratio (Gülüm, 2014). The transesterification reaction was carried out in a 1 L flat-bottomed flask, equipped with a magnetic stirrer heater, thermometer and spiral reflux condenser. Haake Falling Ball Viscometer, Isolab 716 II.2. Density measurement The densities of the produced neat corn oil biodiesel and its blends at different temperatures (10, 15, 20, 30 and 40 ) were determined by means of Eq. (1) and measurements in accordance with ISO 4787 standard: ρ biodiesel or blends = m total m pycnometer m water ρ water (1) where ρ and m represent density and mass, respectively. In order to minimize measurement errors, all the measurements were conducted three times for each sample and the results were averaged. Details of the measurements were given in (Gülüm and Bilgin, 2015). II.3. Dynamic viscosity measurement The dynamic viscosities at 10, 20, 30 and 40 were determined in accordance with DIN standard by using Eq. (2) and making measurements by means of the Haake Falling Ball Viscometer, Haake Water Bath and stopwatch: μ blends = K ball (ρ ball ρ biodiesel or blends )t (2) where μ is dynamic viscosity, K ball is coefficient of the viscometer ball, and t is falling time of the viscometer ball moving between two horizontal line marked on viscometer tube at limit velocity. K ball and ρ ball are mpa s cm 3 /g/s and 2.2 g/cm 3, respectively. The viscosity measurements were also conducted three times for each sample and the results were averaged. The kinematic viscosities were determined from Eq. (3) by dividing dynamic viscosity to density at the same temperature: ν biodiesel = μ biodiesel ρ biodiesel (3) In Eq. (3), if μ biodiesel and ρ biodisel are in the unit of mpa s and kg L, respectively, then ν biodiesel is obtained in unit of mm 2 s (Gülüm and Bilgin, 2015). In this study, dynamic and kinematic viscosities and densities were measured in Internal Combustion Engines Laboratory in Mechanical Engineering Department at Karadeniz Technical University. The
272 fatty acid methyl ester compositions of produced corn oil biodiesel were qualitatively and quantitatively analyzed by gas chromatography using a Hewlett-Packard HP-6890 Series GC system fitting with a HP-6890 mass selective detector (1909N-133 innowax capillary column of 30 m length, 0.25 mm I.D and 0.25 µm film thickness) in Science Research and Application Center at Mustafa Kemal University. The other properties such as flash point temperature (EN ISO 3679) and higher heating value (DIN ) were measured in the Prof. Dr. Saadettin GÜNER Fuel Research and Application Center at Karadeniz Technical University. These properties and international standard values (EN and ASTM D 6751), and the fatty acid compositions are listed in Tables 1 and 2, respectively independent variables, then the uncertainty of the result w R is calculated from the following equation: w R = [( R w x 1 ) 2 + ( R w 1 x 2 ) ( R 2 1/2 w 2 x n ) ] n (4) For example, by using Eqs. (1) and (4), the uncertainty of density of B5 ( % 5 corn oil biodiesel- % 95 Ultra Force Euro Diesel) at 15 (w ρb5,15 ) was calculated as: ρ B5,15 = m total m pycnometer ρ m water,15 water ρ B5,15 = ρ B5,15 (m total, m pycnometer ) Table 1. Some fuel properties of diesel fuel, produced corn oil biodiesel and their blends, and corresponding standard values for biodiesel Properties Unit D B5 B10 B15 Viscosity at 40 mm 2 /s Density at 15 kg/m Flash Point HHV kj/kg Table 1. (Continued) B20 B25 B50 B75 B100 EN14214 ASTM-D * * * *Not specified Table 2. Fatty acid methyl ester compositions of the produced corn oil biodiesel Fatty acid Mass% Palmitic (C16:0) Oleic (C18:1) Linoleic (C18:2) α-linolenic acid (C18:3) Arachidic (C20:0) Gadoleic acid (C20:1) Behenic (C22:0) Lignoceric (C24:0) Average molecular mass g/mol Typical formula C18.74H35.12O2 II.4. Uncertainty analysis The results obtained from experimental studies are generally calculated from measured physical quantities. These quantities have some uncertainties due to uncertainties of measuring tools and measurement systems. Therefore, uncertainty analysis should be applied for proving reliability of the calculated results. In this study, uncertainties of the measured and calculated physical properties such as dynamic and kinematic viscosities and density values were determined by using the method proposed by Kline and McClintock given in (Holman, 2011). According to this method, if the result R is a given function of the independent variables x 1, x 2, x 3,, x n, and w 1, w 2, w 3,, w n are the uncertainties of each 717 R ρ B5,15 x 1 m total = g x 2 m pycnometer = g ρ B5,15 m total = 1 m water ρ water,15 ρ B5,15 = 1 ρ m pycnometer m water,15 water m water = g 1 w ρb5,15 = [( ρ m water,15 w mtotal ) 2 + ( 1 water ρ water,15 w mpycnometer ) 2 ] w ρb5,15 = [( g 1/ kg m3 0.01g) 2 + ( kg m3 0.01g) 2 ] g w ρb5,15 = kg/m 3 1/2 m water Since the density of the blend was determined as kg/m 3, dimensionless uncertainty becomes as: w νb10,40 = kg/m3 100 = % kg/m3 Similarly, the highest uncertainty for all measurements was determined as %, which means that the results are highly reliable. III. Results and Discussions III.1. Viscosity variations III Effect of temperature Fig. 1 depicts the effects of temperature on kinematic viscosities of neat fuels (D and COB) and their biodiesel-diesel fuel blends (B5, B10, B15, B20, B25, B50 and B75). In the figure, the points correspond to the measured viscosity values at studied temperatures (T) and biodiesel percentages (X) while the lines are plots of curve fit equation. Viscosities
 = ν 0 + a/t + b/t 2 (5) where ν is kinematic viscosity in cst, T is temperature in and ν 0, a and b are")
273 follow the similar trend: it decreases with increase in temperature, as expected. The experimental data were correlated with inverse second-order polynomial model: ν = ν(t) = ν 0 + a/t + b/t 2 (5) where ν is kinematic viscosity in cst, T is temperature in and ν 0, a and b are regression constants. Table 3 present the measured viscosities, calculated viscosities from Eq. (5), % errors between measured and calculated values, regression constants and correlation coefficients. As known, the correlation coefficient (R) is a quantitative measure of goodness-of-fit of the regression equation to the measured data. For a perfect fit, for example, R becomes 1 that the equation explains 100% of the variability of the measured data (Chapra and Raymond, 1998). The maximum error of COB-D blends coming from Eq. (5) is % with the lowest R value of Moreover, as observed in Fig. 1, inverse second-order polynomial model is qualitatively proper for the variations of viscosities throughout studied temperature ranges. Table 3. (Continued) Regression constants ν 0 a (10 1 ) b (10 1 ) Table 3. (Continued) Calculated, ν (mm 2 /s) Temp., T ( ) Table 3. (Continued) Absolute errors (%) Temp., T ( ) R III Effect of biodiesel percentage Fig. 1. Changes of kinematic viscosity values of pure D and COB, and their blends with respect to temperature Table 3. For different biodiesel percentages, the measured viscosities of COB-D blends, their calculated viscosities from Eq. (5), errors between measured and calculated viscosities, regression constants and correlation coefficients Blend X (%) Measured, ν (mm 2 /s) Temp., T ( ) The changes of kinematic viscosities of COB-D blends with respect to biodiesel percentages for different temperatures are shown in Fig 2. All the fuel blends follow the similar trend, i.e., viscosities increase with increasing in biodiesel percentage for a specific temperature, and the changes of them tend to be about linear with increasing in biodiesel percentage as temperature is decreasing. Rational model was used in order to characterize these variations as: ν = ν(x) = (a + bx) (c + X) (6) where X is biodiesel percentage in blend (%) and a, b and c are regression constants. Table 4 shows the measured and calculated (from Eq. (6)) viscosities of the blends and neat biodiesel, % errors between measured and calculated values, regression constants and correlation coefficients (R). For COB-D blends, the maximum error and the lowest R value computed from Eq. (6) were % and , respectively. These results and Fig. 2 show that the rational model represents
274 the relationship between kinematic viscosities of COB-D blends and biodiesel percentages with high accuracies. Table 4. (Continued) Calculated, ν (mm 2 /s) Blend, X (%) Table 4. (Continued) Absolute errors (%) Blend, X (%) Fig. 2. Changes of kinematic viscosity values of COB-D blends with respect to biodiesel percentage in blend Table 4. For different temperatures, the measured viscosities of COB-D blends, their calculated viscosities from Eq. (6), errors between measured and calculated viscosities, regression constants and correlation coefficients. Temp. T ( ) Measured, ν (mm 2 /s) Blend, X (%) Table 4. (Continued) Measured, ν (mm 2 /s) Blend, X (%) Table 4. (Continued) Regression constants a (10 2 ) b c (10 1 ) Table 4. (Continued) Calculated, ν (mm 2 /s) Blend, X (%) R Table 4. (Continued) Absolute errors (%) Blend, X (%) III.2. Flash point variation Flash point temperature is defined as the lowest temperature at which a liquid produces enough vapor to ignite in air at atmospheric pressure when an ignition source such as an external flame is applied under specified test conditions (Gharagheizi et al., 2008). The effects of biodiesel percentage in blend on the flash point temperatures of the COB-D blends is given in Fig. 3. Flash point temperature linearly increases with increasing biodiesel content, as seen in this figure. Because of this characteristic, the linear model is suitable for representing the variation of flash point temperature with respect to biodiesel percentage as: T FP = T FP (X) = a + bx (7) where T FP is flash point temperature in, a and b are regression constants. Table 5 lists the measured flash point temperatures, calculated flash point temperatures from Eq. (7), % errors between them, regression constants and correlation coefficients of the Eq. (7). For COB-D blends, the maximum error between calculated and measured values, and the correlation coefficient were computed as % and , respectively. 719
275 HHV = HHV(X) = a + bx (8) In Eq. (8), HHV is in kj/kg, a and b are regression constants. The measured higher heating values, calculated higher heating values (from Eq. (8)), % errors between them, regression constants and correlation coefficients are presented in Table 6. The correlation coefficient and maximum error were determined as and %, respectively. Fig. 3. Changes of flash point temperatures of COB-D blends with respect to biodiesel percentage in blend Table 5. For different biodiesel percentages, the measured flash point temperatures of COB-D blends, their calculated flash point temperatures from Eq. (7), errors between measured and calculated flash point temperatures, regression constants and correlation coefficient Blend X (%) Measured flash point temperature T FP ( ) D 63 B5 70 B10 76 B15 80 B20 88 B25 92 B B B a b R Table 5. (Continued) Calculated Absolute flash point errors temperature (%) T FP ( ) III.3. Higher heating value variation HHV is a measure of the energy produced when the fuel is burnt completely (Rashid and Anwar, 2008). Fuel having higher heating value can provide longer transportation distance with smaller storage fuel tank, and also gives higher power output from smaller engine. Fig. 4 shows the distributions of higher heating values of the COB-D blends with biodiesel percentage. As expected, the higher heating values decrease in direct proportion to biodiesel percentage. For this reason, the experimental data for HHV values are found to be well correlated by linear model: 720 Fig. 4. Changes of higher heating values of COB-D blends with respect to biodiesel percentage in blend Table 6. For different biodiesel percentages, the measured higher heating values of COB-D blends, their calculated higher heating values from Eq. (8), errors between measured and calculated higher heating values, regression constants and correlation coefficient Blend X (%) Measured higher heating value HHV (kj/kg) D B B B B B B B B IV. Conclusions Table 6. (Continued) Calculated higher heating value HHV (kj/kg) a b R Absolute errors (%) In this study, the basic fuel properties of neat diesel (D) and corn oil biodiesel (COB), and their blends (COB-D) were measured according to the related international standards. New one-dimensional lineal models were fitted to the measurements for
276 estimating these properties. The following conclusions can be drawn from the study: The one-dimensional inverse-second order polynomial model (ν = ν(t) = ν 0 + a/t + b/t 2 ) as a function of temperature of blend gives quite accuracy to estimate kinematic viscosities of neat fuels (D and COB) and COB-D blends. The one-dimensional rational model (ν = (a + bx) (c + X)) as a function of biodiesel percentage in blend is found to be good predictions for kinematic viscosities of COB-D blends, respectively. The changes of flash point temperatures and higher heating values of COB-D blends with biodiesel percentage are to be well expressed by linear model. Acknowledgements The authors express their gratitude to Karadeniz Technical University Scientific Research Projects Fund for financial support received (Project No: 9745). Nomenclature a,b,c K ball m total m pycnometer m water R t T w 1, w 2, w 3,..., w n x 1, x 2, x 3,..., x n Greek letters μ biodiesel ν biodiesel ρ ball ρ biodiesel ρ water References : Regression coefficient : Coefficient of the viscometer ball (mpa s cm 3 /g/s) : Mass of the pycnometer filled with biodiesel (g) : Mass of pycnometer (g) : Mass of pycnometer fille with pure water (g) : Correlation coefficient : Falling time of the viscometer ball (s) : Temperature ( ) : Uncertainties of independent variables : Independent variables : Dynamic viscosity of biodiesel (cp mpa. s) : Kinematic viscosity of biodiesel (cst mm 2 /s) : Density of viscometer ball (g/cm 3 ) : Density of biodiesel (kg/m 3 ) : Density of pure water (kg/m 3 ) Turns S.R., An introduction to combustion concepts and applications, McGraw-Hill, New York, 638, (2012). Rezaei R., Mohadesi M., Moradi G.R., Optimization of biodiesel production using waste mussel shell 721 catalyst, Fuel, 109, , (2013). Ozener O., Yüksek L., Ergenc A.T., Ozkan M., Effects of soybean biodiesel on a DI diesel engine performance, emission and combustion characteristics, Fuel, 115, , (2014). Ferrão M.F., Viera M.D.S., Pazos R.E.P., Fachini D., Gerbase A.E., Marder L., Simultaneous determination of quality parameters of biodiesel/diesel blends using hatr-ftir spectra and pls, ipls or sipls regressions, Fuel, 90, 2, , (2011). Sakthivel G., Nagarajan G., Ilangkumaran M., Gaikwad A.B., Comparative analysis of performance, emission and combustion parameters of diesel engine fuelled with ethyl ester of fish oil and its diesel blends, Fuel, 132, , (2014). Encinar J.M., Gonza lez J.F., Reinares A.R., Biodiesel from used frying oil. Variables affecting the yields and characteristics of the biodiesel, Ind. Eng. Chem. Res, 44, 15, , (2005). Benjumea P., Agudelo J., Agudel A., Basic properties of palm oil biodiesel-diesel blends, Fuel, 87, 10-11, , (2008). Radu R., Petru C., Edward R., Gheorghe M., Fueling an D.I agricultural diesel engine with waste oil biodiesel: Effects over injection, combustion and engine characteristics, Energy Conversion and Management, 50, 9, , (2009). Verduzco L.F.R., Flores B.E.G., Rodriguez J.E.R., Jacob A.D.R.J., Prediction of the density and viscosity in biodiesel bblends at various temperatures, Fuel, 90, 5, , (2011). Yuan W., Hansen A.C., Zhang Q., Predicting the physical properties of biodiesel for combustion modeling, Transactions of the ASAE, 46, 6, , (2003). Gülüm M., Bilgin A., Density, flash point and heating value variations of corn oil biodiesel-diesel fuel blends, Fuel Processing Technology, 134, , (2015). Joshi R.M., Pegg M.J., Flow properties of biodiesel fuel blends at low temperatures, Fuel, 86, 1-2, , (2007). Benjumea P., Agudelo J., Agudelo A., Basic properties of palm oil biodiesel-diesel blends, Fuel, 87, 10-11, , (2008). Alptekin E., Canakci M., Characterization of the key fuel properties of methyl ester-diesel fuel blends, Fuel, 88, 1, 75-80, (2009). Fahd M.E.A., Lee P.S., Chou S.K., Wenming Y., Yap C., Experimental study and empirical correlation development of fuel properties of waste cooking palm
277 biodiesel and its blends at elevated temperatures, Renewable Energy, 68, , (2014). Gülüm M., Experimental investigation of the effect of various production parameters on the some fuel properties of produced biodiesels from corn and hazelnut oils, Master s Thesis, Karadeniz Technical University, Department of Mechanical Engineering, Trabzon-TURKEY, (2014). Holman J.P., Experimental methods for engineers, New York: McGraw-Hill, New York, 52, (2001). Chapra S.C., Raymond C.P., Numerical methods for engineers with programming and software applications, America: McGraw-Hill, 444, (1998). Gharagheizi F., Alamdari R.F., Angaji M.T., A new neural network-group contribution method for estimation of flash point temperature of pure components, Energy&Fuels, 22, 3, , (2008). Rashid U., Anwar F., Production of biodiesel through base-catalyzed transesterification of safflower oil using an optimized protocol, Energy & Fuels, 22, 2, , (2008). 722
278 Rational and Hyperbolic Models to Estimate Kinematic Viscosities of Hazelnut Oil Biodiesel-Diesel Fuel Blends Mert Gulum *, Atilla Bilgin Karadeniz Technical University, Faculty of Engineering, Mechanical Engineering Department Trabzon, 61080, TURKEY * [email protected] Abstract In this study, hazelnut oil biodiesel (HOB) was produced by means of transesterification reaction, and was blended with Ultra Force Euro diesel fuel at the volume ratios of 5, 10, 15, 20, 50 and 75%. The kinematic viscosities of each blend were measured at 10, 20, 30 and 40 by following DIN standard. To predict kinematic viscosities of the blends, new one-dimensional curve fit equations, as a function of temperature or biodiesel content, were fitted to the experimental data through the least squares regression, and these equations were compared with each other to determine the well-matched equation. Among the fitted equations, the ones as a function of biodiesel content were also compared to the well-known mixing equation originally proposed by Arrhenius. The calculated regression constants and correlation coefficients were given as tables for all equations. Keywords: Hazelnut oil biodiesel, biodiesel-diesel fuel blends, viscosity, rational model, hyperbolic model. I. Introduction The increasing prices of fossil fuels and their associated environmental problems foster the development of new renewable alternative fuel (Wang et al., 2015). In this scenario, biodiesel is widely considered to be an attractive and sustainable fuel (Choedkiatsakul et al., 2015) because of its great properties as: (1) It is biodegradable, non-toxic, non-aromatic and sulfur-free clean fuel (Wang et al., 2015), (Arreola et al., 2015), (Verduzco et al., 2012), (Yuan et al., 2003), (Canakci and Sanli, 2008). (2) It comprises of about 10 to 11% oxygen by mass in the molecular structure, and has higher cetane number and better ignition quality compared to diesel fuel. Therefore, when a diesel engine is operated with biodiesel, exhaust emissions decrease; approximately 20% in CO, 30% in HC, 40% in PM, and 50% in soot emission, compared to diesel fuel (Wang et al., 2015), (Canakci and Sanli, 2008), (Al-Hamamre and Yamin, 2014). (3) Lubricity property of biodiesel is much better than that of diesel fuel. Little biodiesel additive, even as little as 1%, is enough to significantly improve the diesel fuel s lubricity (Wang et al., 2015), (Canakci and Sanli, 2008). (4) It is compatible with diesel fuel and can be blended in any proportion with diesel fuel to produce a stable blend (Benjumea et al., 2008), (Agarwal et al., 2006). For this reason, it can be used in existing diesel engines without any special modification to the engines. Moreover, all the major automotive manufacturers have approved its use (Ullah et al., 2015). (5) Flash point of the biodiesel is 171, which is higher than that of diesel (74 ). This indicates that biodiesel can be stored and handled safely (Keera et al., 2011). (6) Biodiesel provides one of the best energy returns among renewable fuels. It returns about 90% more energy than the energy that is invested to produce it, where ethanol, in comparison, only provides about 25% net energy (Farooq et al., 2015). Taking the above advantages into consideration, biodiesel is considered as ideal fuel for diesel engines in a way. However, it has also some disadvantages such as lower heat of combustion and volatility, higher viscosity, NOx emissions, price, cloud and pour point temperatures (Farooq et al., 2015), (Gülüm and Bilgin, 2015), (Maghbouli et al., 2015). Several methods exist for producing biodiesel. The most significant is the transesterification reaction (Nogueira et al., 2010), (Feitosa et al., 2010). In that reaction, triglycerides in oil are converted into fatty acid methyl or ethyl ester (biodiesel) with glycerol as a commercial value product, in the presence of short chain alcohol (methanol or ethanol) and homogeneous base/acid catalysts (Choedkiatsakul et al., 2015), (Vasudevan and Briggs, 2008). The traditional homogeneous catalysts (base or acid) show a very good catalytic activity in biodiesel production (Farooq et al., 2015). However, the separation of these catalysts from biodiesel requires washing with water which in turn results in loss of fatty acid alkyl esters (FAAE), energy consumption, and generates large amounts of waste water (Farooq et al., 2015). Moreover, these catalysts cause reactor corrosion and are difficult to recover, thus increases the overall biodiesel production cost (Farooq et al., 2015). Another alternative way to produce biodiesel is through thermal cracking or pyrolysis. However, this process is rather complicated to operate and produce side products that have no commercial value (Sharma and Singh, 2009). The knowledge of thermodynamic properties (viscosity, density, flash point temperature, cetane number etc.) of biodiesels and their blends plays an important role in the understanding of intermolecular interactions between the different molecules in biodiesel s structure (Feitosa et al., 2010). Additionally, because 723
279 researchers have shown a strong interest in modeling the combustion process in the engine in order to understand the fundamental characteristics of biodiesel combustion (Yuan et al., 2003), the thermodynamic properties are used as input data in their combustion models or software. However, it may not be practical at every turn to make measurements of physical properties of biodiesel or biodiesel-diesel fuel blends for each blending ratio or temperature in any study. Regression equations as a function of temperature, percentage of blend and the chemical structure have been generally used to calculate these properties without measurements. Some studies reporting these equations can be summarized as following. Gülüm and Bilgin investigated the variations of densities, flash point temperatures and higher heating values of corn oil biodiesel-ultra Force Euro diesel fuel blends. The authors also proposed new one- and two-dimensional models to predict these fuel properties (Gülüm and Bilgin, 2015). Tesfa et al. investigated the effects of temperature and biodiesel fraction on densities and viscosities of rapeseed, corn oil and waste oil biodiesels-diesel fuel blends, and developed new correlations between density and viscosity for the blends (0B, 5B, 10B, 20B, 50B, 75B and 100B). The developed correlations were compared with the other ones published in literature. Moreover, the authors researched the effects of densities and viscosities of the biodiesel-diesel blends on various components of the engine fuel supply system such as fuel pump, fuel filters and fuel injector (Tesfa et al., 2010). Nita et al. measured densities, viscosities and refractive indices of biodiesel-diesel and biodiesel-benzene mixtures at K. The densities of the blends were predicted with a very good accuracy by using Kay s mixing rule. The viscosities of the biodiesel mixtures were estimated by using Grunberg-Nissan modified equation and derived two equations as a function of volume biodiesel fraction. Density-refractive index and viscosity-refractive index correlations also have been developed from using different mixing rules: Lorentz-Lorenz, Dale-Gladstone, Eykman or Newton (Nita et al., 2011). Fahd et al. investigated the densities, dynamic viscosities and higher heating values of waste cooking palm oil biodiesel-diesel blends under varying temperature and blend ratio. The blends (20%, 40%, 60% and 80%) were prepared on a volume basis. Dynamic viscosities and densities were measured in the temperature range for each fuel sample whereas the higher heating values were determined at 25 room temperature condition.1 st order and exponential equations as a function of temperature were developed to predict densities and dynamic viscosities for each of the fuel blends, respectively. Moreover, the correlations for density and dynamic viscosity were compared with Kay s mixing rule and Grunberg-Nissan mixing rule theory in order to validate their applicability, respectively (Fahd et al., 2014). The main objective of the present work is (1) to measure kinematic viscosities of HOB and their blends with Ultra Force Euro Diesel at different 724 temperatures (10, 20, 30, 40 ) by following DIN standard, (2) derive new one-dimensional models as a function of temperature or biodiesel percentage to predict the viscosities of the blends, and (3) compare to the derived models with for showing their validities. Therefore, HOB was produced and blended with Ultra Force Euro Diesel at the volume ratios of 5, 10, 15, 20, 50 and 75%. The names of the blends are defined by the first letter of the name of the biodiesel B followed by the volume percent of the biodiesel in the blend, as usual. For example, B5 signifies that, it is a blend of 5% volume HOB and 95% volume Ultra Force Euro Diesel. II. Experimental Methods II.1. Biodiesel production In this study, commercially available refined hazelnut oil was used in biodiesel production. It was not needed to perform a pretreatment to the oil because of being refined. Thus, methanol (CH3OH) of 99.8% purity as alcohol and potassium hydroxide (KOH) of pure grade as catalyst were used in transesterification reaction. In a master s thesis by Gülüm (Gülüm, 2014), many reaction parameters such as catalyst concentration, reaction temperature, reaction time and alcohol/oil molar ratio were optimized to produce the lowest kinematic viscosity HOB, which were not mentioned in this study. The optimum reaction parameters for the transesterification of hazelnut oil was determined as 1.25% catalyst (KOH) concentration, 60 reaction temperature, 60 minute reaction time and 9:1 alcohol/oil molar ratio (Gülüm, 2014). The transesterification reaction was carried out in a 1 L flat bottomed flask, equipped with a magnetic stirrer heater, thermometer and spiral reflux condenser. Haake Falling Ball Viscometer, Isolab pycnometer, top loading balance with an accuracy of ±0.01 g, Haake Water Bath and a stopwatch with an accuracy of ±0.01 s were used to measure dynamic viscosity and density. Before starting the reaction, the catalyst was dissolved in methanol to make alcoholic solution of catalyst in a narrow-neck flask. In the flat bottomed flask, this alcoholic solution was added to 200 g hazelnut oil that was formerly warmed to about 80 in a beaker. These reactants were mixed with stirring speed of 500 rpm by means of the magnetic stirrer heater. Transesterification reaction was carried out with the spiral reflux condenser for avoiding loss of alcohol. Reaction temperature was controlled by using thermometer to remain constant reaction temperature during the reaction. At the end of the reaction, the resulting products mixture was transferred to a separating funnel. After a day, two phases occurred in the separating funnel. The upper one consists methyl esters, and the lower one consists glycerol, excess methanol, remaining catalyst and soaps. After separation of the two layers by gravity, the upper layer (biodiesel) was washed with warm distilled water until the water became clear. Washed biodiesel was heated up to about 100 to remove methyl alcohol and water residuals (Gülüm
280 and Bilgin, 2015). II.2. Density measurement Density can be defined as mass per unit volume. The densities of the produced biodiesel and its blends were determined by means of Eq. (1) and measurements in accordance with ISO 4787 standard: ρ biodiesel = m total m pycnometer m water ρ water (1) where ρ and m represent density and mass, respectively. In order to minimize measurement errors, all the measurements were conducted three times for each sample and the results were averaged. Also, uncertainty analysis was carried out depend on the sensitivities of measurement devices (Gülüm and Bilgin, 2015). II.3. Dynamic viscosity measurement Turkey. The other properties of the biodiesel such as flash point temperature (EN ISO 3679), cold filter plugging point temperature (EN 116) and higher heating value (DIN ) were also measured in the Prof. Dr. Saadettin GUNER Fuel Research and Application Center at Karadeniz Technical University in Turkey. Table 1 lists these fuel properties with EN and ASTM D 6751 standard values. Moreover, Table 2 shows the fatty acid compositions, its calculated average molecular mass and typical formula. Tab. 1: Some fuel properties of diesel fuel and hazelnut oil biodiesel, and corresponding standard values Properties Units Biodiesel D EN ASTM D 6751 Viscosity at 40 mm 2 /s Density at 15 kg/m * Flash Point CFPP -8-6 <5, -15< * HHV kj/kg * * Viscosity is a measure of the resistance offered by a fluid to flow [24]. The dynamic viscosities were determined in accordance with DIN standard by using Eq. (2) and making measurements by means of the Haake Falling Ball Viscometer, Haake Water Bath and stopwatch: μ biodiesel = K ball (ρ ball ρ biodiesel ) (2) where μ is dynamic viscosity, K ball is coefficient of the viscometer ball, and t is falling time of the ball moving between two horizontal line marked on viscometer tube at limit velocity. K ball and ρ ball are mpa s cm 3 /g/s and 2.2 g/cm 3, respectively. The viscosity measurements were also conducted three times for each sample and the results were averaged. The kinematic viscosities were determined from Eq. (3) by dividing dynamic viscosity to density at same temperature: ν biodiesel = μ biodiesel ρ biodiesel (3) In Eq. (3), if μ biodiesel and ρ biodiesel are in the units of (mpa. s) and (kg/l), respectively, then ν biodiesel is obtained in unit of (mm 2 /s) (Gülüm and Bilgin, 2015). In this study, dynamic viscosities and densities were measured in Internal Combustion Engines Laboratory in the Mechanical Engineering Department at Karadeniz Technical University. The fatty acid methyl ester compositions of produced hazeulnut oil biodiesel was qualitatively and quantitatively analyzed by gas chromatography using a Hewlett-Packard HP-6890 Series GC system fitting with a HP-6890 mass selective detector (1909N-133 innowax capillary column of 30 m length, 0.25 mm I.D and 0.25 µm film thickness) in Science Research and Application Center at Mustafa Kemal University in 725 Tab. 2: Fatty acid methyl ester compositions of the hazelnut oil biodiesel Fatty acid Mass, % Palmitic (C16:0) Oleic (C18:1) Linoleic (C18:2) α-linolenic acid (C18:3) Arachidic (C20:0) Gadoleic acid (C20:1) Behenic (C22:0) Average molecular mass g/mol 1 Typical formula C 18.82H 35.62O Calculated from fatty acid distribution. II.4. Uncertainty analysis The results obtained from experimental studies are generally calculated from measured physical quantities. These quantities have some uncertainties due to uncertainties of measuring tools and measurement systems. Therefore, uncertainty analysis should be applied for proving reliability of the calculated results. In this study, uncertainties of the measured and calculated physical quantities such as dynamic and kinematic viscosities and densities were determined by the method proposed by Kline and McClintock given in (Holman, 2001). According to this method, if the result R is a given function of the independent variables x 1, x 2, x 3,..., x n and w 1,w 2, w 3,..., w n are the uncertainties of each independent variables, then the uncertainty of the result w R is calculated by using the equation: w R = [( R w x 1 ) 2 + ( R w 1 x 2 ) ( R 2 1/2 w 2 x n ) ] (4) n By using the method, the highest uncertainty was determined as %. Therefore, it can be said that the results have fairly high reliability.
281 III. Results and Discussions III.1. Effects of biodiesel percentage in blend on viscosity Fig. 1 shows the changes of kinematic viscosities of HOB-D blends with respect to biodiesel percentage in the blend for varying temperature. In this figure, the points correspond to the measured viscosity values for studied temperatures and biodiesel percentages, while the lines are plots of curve fit equations. It is clear that all the blends follow the same trend, i.e., viscosities of the blends increase with increasing biodiesel percentage in the blend for studied temperatures, as expected. In order to characterize these variations, rational model was fitted to the experimental data: ν = ν(x) = (ν 0 X/a + bx) (5) where ν is kinematic viscosity ( mm 2 s), a and b are regression constants and X is biodiesel percentage in blend. Table 3 list the measured viscosities, calculated viscosities from Eq. (5), errors between them, regression constants and correlation coefficients (R). As known, the correlation coefficient (R) is a quantitative measure of goodness-of-fit of the regression equation to the measured data. For a perfect fit, for example, R becomes 1 that the equation explains 100% of the variability of the measured data [27]. For HOB-D blends, the maximum absolute error rate computed from Eq. (5) is % with the lowest R value of Moreover, as seen in Fig. 1, the rational model provides a suitable fit for the kinematic viscosities of HOB-D blends. Fig. 1. Changes of kinematic viscosity values of HOB-D blends with respect to biodiesel percentage in blend Table 3. For different temperatures, the measured viscosities of HOB-D blends, their calculated viscosities from Eq. (5), errors between measured and calculated viscosities, regression constants and correlation coefficients Temp. T ( ) Measured, ν (mm 2 /s) Blend, X (%) Table 3. (Continued) Measured, ν (mm 2 /s) Blend, X (%) Table 3. (Continued) Regression constants ν 0 (10 2 ) a (10 1 ) b (10 3 ) Table 3. (Continued) Calculated, ν (mm 2 /s) Blend, X (%) Table 3. (Continued) Calculated, ν (mm 2 /s) Blend, X (%) Table 3. (Continued) Absolute errors (%) Blend, X (%) Table 3. (Continued) Absolute errors (%) Blend, X (%) R 726
282 III.2. Effects of temperature on viscosities The effects of temperature on kinematic viscosities of HOB-D blends are illustrated in Fig. 2. It is clear that viscosities of the all blends follow the same trend: as the temperature is increased, the average intermolecular forces decrease which in turn reduces the resistance to flows and results in lower viscosity [21], as expected. The experimental data were correlated with hyperbolic model by applying the least squares method as: ν = ν(t) = (ν 0 T/a + T) + bt (6) where ν is kinematic viscosity (mm 2 /s), ν 0, a and b are regression constants and T is temperature ( ). The measured kinematic viscosities, calculated kinematic viscosities from Eq. (6), errors between them, regression constants and correlation coefficients are given in Table 4. For HOB-D blends, the maximum absolute error rate computed from Eq. (6) is with the lowest R value of These results and Fig. 2 indicate that the relation between kinematic viscosity with temperature is found to be well expressed by the hyperbola model. Table 4. (Continued) Regression constants ν 0 a b (10-2 ) Table 4. (Continued) Calculated, ν (mm 2 /s) Temp., T ( ) Table 4. (Continued) Absolute errors (%) Temp., T ( ) R IV. Conclusions Fig. 2. Changes of kinematic viscosity values of pure D and HOB, and their blends with respect to temperature Table 4. For different biodiesel percentages, the measured viscosities of HOB-D blends, their calculated viscosities from Eq. (6), errors between measured and calculated viscosities, regression constants and correlation coefficients Blend X (%) Measured, ν (mm 2 /s) Temp., T ( ) In this study, the effects of biodiesel percentage in blend and temperature on the kinematic viscosities of hazelnut oil biodiesel-diesel fuel blends were investigated. New one-dimensional regression models were proposed to predict kinematic viscosities of the blends for various blending ratios and at different temperatures. The following conclusions can be drawn from this study: The rational model (Eq. (5)) is found to be suitable to characterize the changes of kinematic viscosities with biodiesel percentage in blend for HOB-D blends. The kinematic viscosity-temperature relation for the HOB-D blends is observed to be well correlated by hyperbolic model (Eq. (6)). Nomenclature a,b CFPP K ball m total m pycnometer : Regression constants : Cold filter plugging point temperature : Coefficient of the viscometer ball (mpa s cm 3 /g/s) : Mass of the pycnometer filled with biodiesel (g) : Mass of pycnometer (g) 727
283 m water R t T w 1, w 2, w 3,..., w n x 1, x 2, x 3,..., x n Greek letters μ biodiesel ν biodiesel ρ ball ρ biodiesel ρ water Acknowledgements : Mass of pycnometer fille with pure water (g) : Correlation coefficient : Falling time of the viscometer ball (s) : Temperature ( ) : Uncertainties of independent variables : Independent variables : Dynamic viscosity of biodiesel (cp mpa. s) : Kinematic viscosity of biodiesel (cst mm 2 /s) : Density of viscometer ball (g/cm 3 ) : Density of biodiesel (kg/m 3 ) : Density of pure water (kg/m 3 ) The authors express their gratitude to Karadeniz Technical University Scientific Research Projects Fund for financial support received (Project No: 9745). References Wang M., Nie K., Yun F., Cao H., Deng L., Wang F., Tan T., Biodiesel with low temperature properties: Enzymatic synthesis of fusel alcohol fatty acid ester in a solvent free system, Renewable Energy, 83, , (2015). for biodiesel production, Energy Conversion and Management, 79, , (2014). Benjumea P., Agudelo J., Agudelo A., Basic properties of palm oil biodiesel-diesel blends, Fuel, 87, , (2008). Agarwal D., Sinha S., Agarwal A.K., Experimental investigation of control of NOx emissions in biodiesel-fueled compression ignition engine, Renewable Energy, 31, , (2006). Ullah Z., Bustam M.A., Man Z., Biodiesel production from waste cooking oil by acidic ionic liquid as a catalyst, Renewable Energy, 77, , (2015). Keera S.T., Sabagh S.M.E., Taman A.R., Transesterification of vegetable oil to biodiesel fuel using alkaline catalyst, Fuel, 90, 42-47, (2011). Farooq M., Ramli A., Naeem A., Biodiesel production from low FFA waste cooking oil using heterogeneous catalyst derived from chicken bones, Renewable Energy, 76, , (2015). Gülüm M., Bilgin A., Density, flash point and heating value variations of corn oil biodiesel-diesel fuel blends, Fuel Processing Technology, 134, , (2015). Maghbouli A., Yang W., An H., Li J., Shafee S., Effects of injection strategies and fuel injector configuration on combustion and emission characteristics of a D.I. diesel engine fueled by bio-diesel, Renewable Energy, 76, , (2015). Choedkiatsakul I., Ngaosuwan K., Assabumrungrat S., Mantegna S., Cravotto G., Biodiesel production in a novel continuous flow microwave reactor, Renewable Energy, 83, 25-29, (2015). Arreola E.S., Torres G.M., Ramirez J.D.L., Hernandez L.R., Gonzalez E.R.B., Bach H., Biodiesel production and de-oiled seed cake nutritional values of a Mexican edible Jatropha curcas, Renewable Energy, 76, , (2015). Verduzco L.F.R., Rodriguez J.E.R., Jacob A.D.R.J., Predicting cetane number, kinematic viscosity, density and higher heating value of biodiesel from its fatty acid methyl ester composition, Fuel, 91, , (2012). Yuan W., Hansen A.C., Zhang Q., Predicting the physical properties of biodiesel for combustion modelling, Transactions of the ASAE, 46, , (2003). Canakci M., Sanli H., Biodiesel production from various feedstocks and their effects on the fuel properties, Journal of Industrial Microbiology&Biotechnology, 35, , (2008). Al-Hamamre Z., Yamin J., Parametric study of the alkali catalyzed transesterification of waste frying oil 728 Nogueira C.A., Feitosa F.X., Fernandes F.A.N., Santiago R.S., Ana H.B.D.S., Densities and viscosities of binary mixtures of babassu biodiesel+cotton seed or soybean biodiesel at different temperatures, J. Chem. Eng. Data, 55, , (2010). Feitosa F.X., Rodrigues M.D.L., Veloso C.B., Cavalcante C.L., Albuquerque M.C.G., Ana H.B.D.S., Viscosities and densities of binary mixtures of coconut+colza and coconut+soybean biodiesel at various temperatures, J. Chem. Eng. Data, 55, , (2010). Vasudevan P.T., Briggs M., Biodiesel production-current state of the art and challenges, Journal of Industrial Microbiology&Biotechnology, 35, , (2008). Sharma Y.C., Singh B., Development of biodiesel: Current scenario, Renewable and Sustainable Energy Reviews, 13, , (2009). Tesfa B., Mishra R., Gu F., Powles N., Prediction models for density and viscosity of biodiesel and their effects on fuel supply system in CI engines, Renewable Energy, 35, , (2010). Nita I., Geacai S., Iulian O., Measurements and
284 correlations of physico-chemical properties to composition of pseudo-binary mixtures with biodiesel, Renewable Energy, 36, , (2011). Fahd M.E.A., Lee P.S., Chou S.K., Wenming Y., Yap C., Experimental study and empirical correlation development of fuel properties of waste cooking palm biodiesel and its diesel blends at elevated temperatures, Renewable Energy, 68, , (2014). Gülüm M., Experimental investigation of the effect of various production parameters on the some fuel properties of produced biodiesels from corn and hazelnut oils, Master s Thesis, Department of Mechanical Engineering, Karadeniz Technical University, Trabzon, TURKEY, (2014). Esteban B., Riba J.R., Baquero G., Rius A., Puig R., Temperature dependence of density and viscosity of vegetable oils, Biomass and Bioenergy, 42, , (2012). Holman J.P, Experimental methods for engineers, 7th ed., New York, McGraw-Hill, (2001). Alptekin E., Canakci M., Determination of the density and the viscosities of biodiesel diesel fuel blends, Renewable Energy, 33, , (2008). Chapra S.C., Canale P.R, Numerical methods for engineers with software and programming applications, 3rd ed., America, Mc-Graw-Hill, (1998). 729
285 Experimental Investigation of the Effects of Water Adding to the Intake Air on Diesel Engine Performance and Heat Release Analysis Zehra Sahin 1 *, Orhan Durgun 2, Mustafa Tuti 3 1 Karadeniz Technical University, Faculty of Engineering, Mechanical Engineering Dep.,Trabzon 2 Avrasya University, Mechanical Engineering Dep. Trabzon 3 Karadeniz Technical University, Faculty of Marine Science, Naval Architecture and Marine Eng., Trabzon * [email protected] Abstract In the present study, the effects of water injection (WI) into intake air on the performance and NOx emissions have been experimentally investigated in a Renault K9K 700 type turbocharged common-rail direct injection automotive diesel engine. Experiments have been performed at different loads and 3500 and 4000 rpms, for various water ratios (WRs). The water was injected into intake air by a carburetor, which main nozzle section is adjustable to give approximately 2%, 4%, 6%, 8% and 10% (by vol.) water ratios. It was determined from the experimental results that WI at specified ratios into intake air decreases significantly NOx (nitrogen oxide) emissions at selected engine speeds. Peak heat release rate (HRR) values are higher than that of NDF at 3500 rpm for selected WRs. On the other hand, brake specific fuel consumption (bsfc) decreases at this engine speed. However, peak HRR values are lower than that of NDF for (2, 4 and 6) % WRs and they are nearly equal to NDF for 8 % and 10 % WRs at 4000 rpm. At this engine speed, bsfc increases at 115 Nm for lower WRs. But bsfc decreases at the other selected loads. Keywords: Water injection into intake air, NOx emissions, Engine characteristics, Heat release rate I. Introduction Today s diesel engines are established as the dominating powertrain solution in the world market (Hountalas et al. 2006). Especially by developing and widespread using common-rail injection system, diesel engines are also widely used on the current small vehicles and in other numerous applications. However, conventional diesel combustion subjects to a wide range of local in-cylinder equivalence ratios and temperatures which can result in NOx and soot formation. To solve this problem, water using in diesel engine helps to control combustion temperature, pressure and also unwanted emissions (Adnan et al. 2012). It has also been shown by Selim et al. (2007) that adding water may help to improve atomization and mixing, which is attributed to droplet micro-explosions. The improved mixing assists in to reduce NOx emissions and also to increase engine performance. Till today, several different methods of water using in diesel engine have been studied in literature (Hountalas et al. 2006; Adnan et al. 2012, Selim et al. 2007; Subramanian 2011; Alahmer et al. 2010; Şahin et al. 2014; Ithnin et al. 2015). However, the methods of water-diesel fuel emulsion and water introduction into the intake air are the most preferring techniques. By using these techniques in diesel engine NOx and smoke reduce simultaneously without loss of power and any negative effect on fuel consumption (Hountalas et al. 2006; Adnan et al. 2012, Selim et al. 2007; Subramanian 2011; Alahmer et al. 2010; Şahin et al. 2014; Ithnin et al. 2015). As a different method, in the present study, the effect of WI into the inlet air 730 manifold of a modern four cylinder, turbocharged, water cooled, common rail direct injection automotive diesel engine, which is been using on Renault Kangoo and Clio automobiles, was studied with respect to the engine performance, combustion and NOx emissions. II. Experimental Facility II.1 Experimental setup The experimental work was carried out in a 4 cylinder, 4-stroke, turbocharged, common-rail injection, L Renault DI automotive diesel engine (model K9K 700). The specifications of the test engine are given in Table 1. Test system used in the experiments was produced by Cussons and its technical drawing was given in Fig.1. Here; loading of the engine was done by a water brake, the brake moment was determined electronically, the fuel consumption was measured by mass. NOx concentration in the exhaust gases were determined by MEXA-720 NOx gas analyzer produced by Horiba. Cylinder gas pressure was measured by using of an AVL GH12P type quartz pressure sensor without cooling. The signal outputs of the pressure sensor were amplified by P4411 type Cussons electronic indicating system. Here a computer and NI PCI-6221 data acquisition card which has 16-bit resolution and 250 (ksample/s) sampling were used in order to convert signals from analog to digital and to record the obtained data. Charge amplifier output of Cussons electronic indicating system, which is proportional to cylinder gas pressure and angles determined by using
286 top dead center (TDC) signal taken from a magnetic pick-up, were stored for one cycle with a sampling time 25 (s). Cylinder gas pressure was acquired using pressure transducer at averagely 0.5 degree of crank angle (CA) resolution. In each test, pressure values for about 100 consecutive cycles were collected and averaged. Moving average filtering method was applied to the measured cylinder gas pressure data to reduce noise effects. Tab. 1: Main technical specifications of the test engine Engine Renault K9K 700 turbocharged automotive diesel engine Displacement liter Number of cylinder 4 Bore & stroke 76 & 80.5 mm Compression ratio 18.25: 1 Maximum power rpm Maximum torque rpm Connecting rod length 130 mm Injection system Common rail injection system * Number of nozzle holes 5 Nozzle hole diameter 0.12 mm *The injection pressures up to 2000 bar carburator venturi pipe (diffuser) air air main jet 13 needle 3 5 n-butanol 2 4 n-butanol screw termocouples, 18-exhaust gas calorimeter, 19-gas analyzer (NOx analyzer), 20-ossiloscope, 21- electronic indicating system, 22-data acquisition card, 23 computer, 26- n-butanol tank, 27-scaled glass bulb, 28- flexible hose, 29-carburator II.2. Water adding system Here, an elementary carburetor was mounted on the inlet manifold, before turbocharging unit, and it was employed to introduce water into inlet air. The air and gas throttles of the carburetor were dismantled and the other auxiliary equipments of the carburetor were left out of order. The carburetor air inlet was connected to the air consumption measuring box by a flexible hose. Water flow rate was adjusted and thus water ratios (WRs) were varied by a fine threaded screw which can change the main jet section. This screw was designed by authors and it was manufactured in Trabzon industry. Technical drawing of the used carburetor and this main jet adjustment screw used in the experiments was presented in Fig. 1. During WI tests, 6 different carburetor main jet openings were chosen to obtain 6 different water ratios of (2, 4, 6, 8, 10, 12 %, by vol.). II.3. Operating conditions The effects of water addition on engine performance, combustion and NOx emissions were experimentally studied for various operating conditions; that is, for different loads and speeds. In the present study, experiments were conducted at two different engine speeds of (3500 and 4000) rpms for six WRs (approximately 2, 4, 6, 8, %, by vol.) Experiments were performed at six different loads of (120, 106, 92, 77, 63 and 49) Nm at 3500 rpm and (115, 100, 86, 72, 57 and 43) Nm at 4000 rpm. Experiments were firstly carried out with NDF to obtain a database for comparison with those obtained for each WR. After NDF tests have been completed, the adapted carburetor, which main features are given above, was mounted through the intake manifold of the engine. Also, as shown in Fig.1, a small water tank, a scaled glass bulb and a flexible pipe were used to introduce water into intake air and to measure it. Any other adaptation on the engine and on the experimental system was not done. Also, the engine mainly operates due to diesel principle. Experimental procedure applied in the present study is given briefly in the following paragraph. intake channel (air/n-butanol mixture) Fig.1a: Schematic view of the test system. 1-fuel measurement unit, 2-digital display for temperatures, 3-speed, 4-force, (5,6)-loading unit, 7-start switch, 8- inclined manometer, 9-coolant flow meter, 10-oil temperature, 11-inlet manifold pressure, 12-gas throttle, 13-hydraulic dynamometer, 14-engine, 15- coaling package,16-inference unit for gas pressure, fuel line pressure and crank angle pick-up sensors, 731 At the beginning, all of the experiments were started after running the engine during approximately 30 minutes until it reached steady state conditions and cooling water temperature became 70 o C ±5 for warming. At 3500 rpm, firstly the load of the engine was adjusted as 120 Nm (420 N loading force). Then, carburetor mean jet opening was adjusted to the 1st opening and it was fixed. This opening gives approximately 2 % water ratio. After this tests with approximately 2 % WR were performed for loading moments between (120-49) Nm; by reducing the engine load at 15 Nm (50 N) steps and simultaneously
287 adjusting gas throttle levels suitably to obtained constant 3500 rpm engine speed. Thus, tests for 2% water ratio at 3500 rpm were carried out at six different engine loads. After that, carburetor main jet opening was adjusted to the 2 nd opening and it was again retained fixed at the same 3500 rpm engine speed. This opening gives approximately 4 % WR and tests for this WR was performed at above given six different engine loads. Then, tests for 3 rd, 4 th, 5 th and 6 th main jet openings (for approximately 6%, 8%, 10% and 12% WRs) carried out by applying the same procedure and doing above explained adjustments. Similar experiments were repeated at engine speeds of 4000 rpm. Thus, the performance characteristics, NOx emissions, HHR, cylinder gas pressure and temperature values were determined at different WRs and the results were compared with each other and NDF. Where, dq/d is the rate of the heat release (J/deg.), is the ratio of specific heats, p is the in-cylinder gas pressure and V is in-cylinder volume. Here to calculate HRR it is assumed that the cylinder gas content consists of a homogeneous mixture of air and combustion products. It is also assumed that pressure waves, large temperature gradients, fuel vaporization and leakage through the piston rings do not occur. Thus, HRR analysis calculations have been performed along the crank angles during the interval of from inlet valve closure to exhaust valve opening. Instead of these approximations, there are some studies in which gross heat release rate is calculated by taking in to account the rate of heat transferred to the walls of the combustion chamber in literature (Rakopoulos et al., 2010). III.3. Error analysis and uncertainties III. Evaluation of Experimental Measurements III.1. Calculation of engine characteristics In this section, the principles of the calculation of engine performance parameters for NDF and water adding tests are summarized. The details of the calculation process can be found in Durgun (1990). Effective power output from the engine crankshaft was converted to the standard conditions and corrected for ambient air humidity by using the following relation N e(kw) T ω 0,1013 b p 0 T 0 /293X hum where is angular velocity of the crankshaft, Tb (Nm) is brake torque, T0 (K) and p0 (MPa) are ambient air temperature and pressure respectively, Xhum is the humidity correction factor and it is determined depending on dry and wet thermometer temperatures. Here, consumption duration of 30 gr diesel fuel was measured and the fuel consumption determined by mass. The amount of the water consumed during this time interval was determined by using a scaled glass bulb. By this way, brake specific fuel consumption (bsfc) was calculated as follows: m3600 b e, NDF (kg/kwh) (2a) 1000 Δt N e (30 V w ρ w ) 3600 b e, WI (kg/kwh) (2b) 1000 Δt N e Here, m is the mass of consumed diesel fuel during t (s), t (s) is the duration of consumption of 30 [g] of diesel fuel, Vw (ml) is the volume of water added during t (s) and w (kg/m 3 ) is the density of water. III.2. Estimation of heat release rate (HRR) The heat release rate (HRR) was calculated by using the method given by Heywood (1988). By applying the first law of thermodynamics, the heat release rate can be modeled as follows. dq dv 1 dp p V (3) dθ 1 dθ γ1 dθ (1) 732 In the present study each value was measured 3 times. By applying Kline and Mc.Clintock s method, given by Holman (2001), error analysis was applied to these measured values and uncertainties were determined. Here, as being measured each value 3 times, Student s t-distribution must be applied to the experimental data. Errors in various terms were determined by applying well known method of evaluation of experimental data. For example, uncertainty interval of torque values is determined as ( ) %. Error analysis for derived values such as effective power, bsfc and effective efficiency was also performed. At the end of the error analysis, it was determined that for example the uncertainty in effective power values is in the interval of ( ) %. By examining all of the other error analysis results, it was seen that probable errors of the measured main values and also uncertainties in the bsfc and effective efficiency were in the interval of ( ) %. From these results, it can be said that the errors in the measuring of the principle values and the probably uncertainties in the derived values would not affect significantly the uncertainties of the results. IV. Results and Discussions In the present study, water is injected into the intake manifold by using a simple carburetor. This mixture is compressed during the compression process and diesel fuel is injected in to this mixture through to the end of the compression process. Air-water mixtures instead of pure air are entrained in to fuel spray during ignition delay and combustion processes. During the ignition and combustion processes, water vapor entertained in spray may cause micro-explosions. These micro-explosions would create additional gas motions and secondary atomization of the fuel spray, which enhances the mixing of diesel fuel, injected after this instant, with air more fastly and homogenously. Improving fuel-air mixing by this additional gas motions and more atomization of fuel means that combustion process would get better and engine performance could be improved and exhaust pollution would be reduced (Heywood, 1988, Tesfa et al. 2012).
288 HRR versus crank angle for different WRs at 3500 and 4000 rpms are given in Fig.2a and Fig.3a, respectively. As can be seen from Fig. 2a and Fig. 3a that the tendencies of HRR variations are fairly similar and fallow the same typical characteristics for different WRs and NDF. At 3500 rpm for selected WRs, peak HRR values are higher than that of NDF, which indicates that the micro-explosion of the water droplets can accelerate the combustion process, thereby a more efficient and complete combustion occurs. This explains why bsfc for water adding in intake manifold is lower than NDF and this can be observed in Fig.4b. In due to Fig. 2a, there is not important increase in ignition delay (ID) for 2 % and 4 % WRs. However, after 4% WRs, ID increases slightly. This observation is in the agreement with the previous researchers (Tesfa et al. 2012, Ithnin et al. 2015). At 4000 rpm, peak HRR values are lower than that of NDF for (2, 4 and 6) % WRs. However, peak HHR values are nearly equal to NDF for 8 % and 10 % WRs. This is also confirmed by the bsfc trend as will be inspected in Fig. 5b. This figure shows that bsfc increases for (2, 4 and 6) % WRs and it decreases for 8 % and 10 % WRs. Figs. 2. (a, b and c): Heat release rate, temperature and in-cylinder pressure versus crank angle for NDF and different WRs at 3500 rpm. In the present study, gas temperature (bulk gas temperature) was calculated from the average pressure with respect to crank angle for 100 cycles. As shown in Figs. 2b and 3b, gas temperature increases progressively with the increase of WRs at 3500 and 4000 rpm. This is due to the fact that water, premixed with the ambient air, is progressively entrained inside the combustion zones during the combustion stage through expansion stroke and thus, the effect of water dissociation on gas temperature increases progressively during the expansion stroke. (Hountalas et al. 2006). Also, as can be seen in Figs. 3a and 4a that HRR values during diffusion controlled combustion phase are slightly higher than that of NDF at 3500 and 4000 rpms for selected WRs, so higher gas temperature values are occured. 733
289 rpm 0 NO/NO* Nm 92 Nm 77 Nm 49 Nm Water ratios, %, (a) 3500 rpm b e /b e * Figs. Fig. 3 (a, b and c): Heat release rate, temperature and in-cylinder pressure versus crank angle for NDF and different WRs at 4000 rpm. As shown in Fig. 2c; at 3500 rpm, for NDF the peak pressure is bar and it occurs at 6.82 o CA, while for water adding of 2.142%, 3.689%, 6.402%, 8.050%, %, by vol. the peak pressures become , , , and bar and they occur at 6.307, 6.842, 6.564, and 6.822) o CAs respectively. It can be observed from Fig. 2c that, incylinder pressure values for water adding are generally slightly higher than that of NDF. Similar variations for in-cylinder pressure values were obtained at 4000 rpm as shown in Fig. 3c. At 4000 rpm for NDF the peak pressure is bar and it occurs at 5.99 o CA, while for water adding of 1.860%, 4.468%, 5.705%, 8.321% and 9.236%, by vol. the peak pressure values become , , , and bar and they occur at 5.400, 5.705, 5.705, and o CAs respectively Nm 92 Nm 77 Nm 49 Nm Water ratios, %, Fig.4 (a and b): Variations of the variation ratios of NOx emissions and bsfc versus different WRs for four different loads at 3500, respectively. It can be observed from Fig. 3c that in-cylinder pressure values for water adding are generally slightly lower than that of NDF. However; in Figs. 2c and 3c, it can be seen that the peak cylinder pressure values show only minor differences in magnitude for different WRs at given operating conditions. Subramanian (2011) also reported that water injection into intake manifold reduced the peak cylinder pressure. NOx emissions are one of the major concerns of diesel engine. Figs. 4a and 5a show the NOx of the different WRs and NDF at 3500 and 4000 rpms. As can be seen from the figures, the NOx emissions decrease for WRs higher than 6% at these engine speeds. It generally increases for WRs lower than 6 %. Also, decrement ratios of NOx at high loads are lower that of low loads. At high WRs, the intensity of the microexplosion seems to become vigorous and the duration of the explosion is elongated. As a result, the effect of micro-explosion promotes better atomization and formation of air fuel mixture, which results in lower NOx (Ithnin et al. 2015). The reduction in NOx may be caused by the following reasons.1) micro explosion phenomena, (2) improved air-entraining in the spray due to the additional gas motions and better atomization, (3) slightly longer premixed combustion due to ignition delay, (4) increase in excess of air ratio due to the presence of water in the fuel (Ithnin et al. 2015, Subramanian, 2011). (b) 734
290 NO/NO*100 b e /b e * Nm 86 Nm 72 N 43 N Water ratios, %, (a) 4000 rpm 4000 rpm 115 Nm 86 Nm 72 N 43 N this engine speed. However, bsfc increases at low WRs and it decrease at high WRs at 4000 rpm at 114 Nm. But it was observed that bsfc decreases under the other loads at 4000 rpm. 4. Based on the above conclusions it can be stated that water adding into intake air can be effectively employed in the existing diesel engine to reduce NOx emissions and bsfc. To apply this method, an adapted carburetor was used to introduce water into intake air and any other modification on the engine was not required. Thus, this method can be applied easily and economically. Nomenclature be, bsfc : Brake specific fuel consumption (kg/kwh) CA : Crank angle (degree) HRR : Heat release rate (kj/degree) NDF : Neat diesel fuel WI : Water injection WRs : Water ratios References Water ratios, %, Fig.5 (a and b): Variations of the variation ratios of NOx emissions and bsfc versus different WRs for four different loads at 4000, respectively. As shown in Fig. 4b; bsfc decreases for selected loads and WRs at 3500 rpm. As observed in Fig 5b, bsfc generally increases for 115 Nm at lower WRs at 4000 rpm. However, it decreases the other selected loads and higher WRs. The reduction of bsfc is result of improvement of combustion process as described above paragraph. V. Conclusions In the presented study, the effects of adding water in to the intake air on the combustion characteristics and NOx emissions were investigated and compared to NDF in a turbocharged, common-rail injection DI automotive diesel engine. From the experimental results, the following conclusions could be drawn. 1. The water adding in to the intake manifold does not indicate any significant difference on the peak cylinder pressure and heat release rate of this engine. The results show that the water adding increases the mean gas temperature. 2. The water adding into the intake manifold provides significant reductions in NOx emissions. The obtained reduction ratios of NOx emissions are 8.73 % for 8 % WR at 120 Nm and % for 9 % WR at 114 Nm at 3500 and 4000 rpms respectively. 3. The water adding in to intake manifold reduces the bsfc at selected loads at 3500 rpm and it decreases approximately 2.88 % for 120 Nm at (b) 735 Adnan A., Masjuki H.H., Mahlia T.M.I., Performance and emission analysis of hydrogen fueled compression ignition engine with variable water injection timing, Energy 43, (2012). Alahmer A., Yamin J., Sakhrieh A., Aamdan M.A., Engine performance using emulsified diesel fuel, Energy Conv. Manag. 51, (2010). Durgun O., Experimental methods in engines. Lecturer notes for laboratory, KTU Engineering Faculty, Mech. Engineering Department (1990). Heywood J.B., Internal combustion engine fundamentals. New York: McGraw- Hill (1988). Holman J.P., Experimental methods for engineers. 7th ed. New York: McGraw-Hill (2001). Hountalas D.T., Mavropoulos G.C., Zannis T.C., Mamalis S.D., Use of water emulsion and intake water injection as NOx reduction techniques for heavy duty diesel engines, SAE paper (2006). Ithnin A.M., Ahmad M.A., Bakar M.A.A., Rajoo S., Yahya W.J., Combustion performance and emission analysis of diesel engine fuelled with water-in-diesel emulsion fuel made from low-grade diesel fuel, Energy Conversion and Management 90, (2015). Rakopoulos CD, Rakopoulos DC, Giakoumis EG, Dimaratos AM. Investigation of the combustion of neat cottonseed oil or its neat bio-diesel in a HSDI diesel engine by experimental heat release and statistical analyses, Fuel 89, (2010). Sahin Z., Tuti M., Durgun O., Experimental investigation of the effects of water adding to the intake air on the engine performance and exhaust
291 emissions in a DI automotive diesel engine. Fuel 115, (2014). Selim, M.Y.E., Ghannam M.T., Performance and engine roughness of a diesel engine running on stabilized water diesel emulsion, SAE paper (2007). Subramanian K.A., A comparison of water diesel emulsion and timed injection of water into the intake manifold of a diesel engine for simultaneous control of NO and smoke emissions, Energy Conv. Man., 52, (2011). Tesfa B., Mishra R., Gu F., Ball A.D., Water injection effects on the performance and emission characteristics of a CI engine operating with biodiesel, Renewable Energy 37, (2012). 736
292 Emission due to Pollution from Ships Main Engine and Auxiliary Machinery Munir Suner 1* 1 AffiliationIstanbu Technical University, Maritime Faculty, Marine Engineering Department, ITU Maritime Faculty Marine Engineering, 34940, Tuzla /Istanbul, Turkey * [email protected] Abstract Emission is one of the most issue for the future of world. It has threaten all of living thing, life and of future of earth since According to United Nations Climate Change Conference Paris 2015, the world gives alarm from due to sera effect. Also, all participating countries will have aimed reduction the emission 50 % caused by fuel. The ships are the most used vessels in transportation on the world. So they are consumed a huge amount of energy. Approximately 3 % of total energy are consumed by ships, and these vessels energy source is fuel. Therefore very important that ships are environmentally friendly and energy efficient. This paper provides the analysis of emission in ship main engine and auxiliary machinery. The effect of emission due to pollution from the main engines and auxiliary are the best of our knowledge reported thoroughly for the first time in literature. The concepts put forward here have been demonstrated as based on data recorded 474 (for 79 days) times before and after cleaning process. It was observed that when the factor of pollution was eliminated, the total emission from the cylinder jackets, sea water circuit, in scavenger circuit, fresh water circuit went down considerably to the average ton, the average NOx and SOx total emission went down kg. Keywords: Energy efficiency, pollution effect, ship, main engine, fuel oil, emission I. Introduction If emissions problem is not solved in near future, it will lead to a lot of disaster such as floods, mass death, drought, migration, the extinction of many species. Used the general energy in today originated is fossil sources. Almost all of the transport are provided with ships in the world. The energy consumed in the ships is very important, and it is has a huge partial. The ships used in maritime transport is equipped with a large portion of the diesel engine. These structures of the machine in order to provide the power required is very large. It occupies an important place in the exhaust gases emitted air pollution by ships. IEA (International Energy Agency) statistics indicate that 220 Mtp energy used for transport by sea in This value represents 9% of the total transportation. It is about 83% of the rest of the international transport has been calculated from the national transport International Energy Agency (2009). In ships is used fossil based energy. These are internal combustion vehicles. Internal combustion contains high amounts of toxic components in the emissions emitted by fuels used in this system and it is also very environmental damage. These emissions includes carbon dioxide (CO2), sulfur dioxide (SO2) sulfur trioxide (SO3), nitrogen monoxide(no), nitrogen dioxide, (NO2), water vapor (H2O), and nitrogen (N2). Especially NOx, and SOx are very danger, and have high toxic. Emissions are one of the biggest challenges of the future. In addition, energy resources are limited, and used them is costly. Therefore, systems must be provided for operating at peak efficiency. 737 Unfortunately, despite all the improvements in energy efficiency in ships, this vessels efficiency is very low, and was below 60%. Mechanical and heat energy losses in the energy efficiency of the ship is very important. The less energy losses, the high energy efficiency Therefore, to reduce the loss of energy will contribute to energy efficiency, and will led to less fuel consumed. These energy losses in the ships are very high, and a significant portion of they are occurs in the circuits, in the main engine and auxiliary machinery. Pollution has an important place in these losses. It increases friction losses. Also inhibits the heat transfer in cooling and heating systems. So more energy is spent for systems. Pollution has an important place in these losses. It increases friction losses. Approximately 70% of the amount of energy consumed in the world is obtained by the use of fossil fuels (Ergeneman M. et al (1998). Also inhibits the heat transfer in cooling and heating systems. So more energy is spent. Consequently more fuel is consumed for systems. This increases emissions emitted by the fuel used. Emissions are one of the biggest challenges of the future. In this study, the effect of pollution on emission in main engine and auxiliary is determined. As is known, emissions that are harmful to all living organisms, damage to health and even poisoned creatures, and sometimes enters with air to chemical reactions in the atmosphere, is very dangerous consequences. Unfortunately, not enough adequate measures be taken. The fuel used in ships are both row and contain high levels of emissions. Even if an improvement of 1% can be done, it is very important. According to a study (Çakıroğlu M. et al., 1996), A large part of the pollution in cities is caused by cars. Properties and
293 densities of these contaminants are dependent on engine type, engine setting, and the mode of use, the fuel composition, and atmospheric conditions. The importance of energy efficiency has increased intensively in recent years making it a prime objective in engineering in the 21 st century. Energy efficiency, which affects all walks of life, starts from design to management and practice to theory for the maritime transport sector which is responsible for transportation of the 80 % of merchandise of world trade (UNCTAD, 2013). Ocean-going merchant vessels transport almost 90 percent of all trade by volume to and from the 25 members of the European Community, and nearly 80 percent by weight of all goods is shipped in and out of the United States. The shipping sector has been growing on average by 5% every year over the last three decades (ICCT, 2007). According to various estimates, global marine fuel consumption is predicted to be over 300 million tons. Shipping is estimated to have emitted 1,046 million tons of CO2 in 2007, which corresponds to 3.3% of the global emissions during International shipping is estimated to have emitted 870 million tons or about 2.7% of the global emissions of CO2 in 2007 (IMO, 2009). The energy generated by engines and the boiler is consumed in propulsion, in heating, in pumping, in compression and in some auxiliary engine operations as well as mechanical and heat losses. Each element of every ship system has certain efficiency which affects the overall energy efficiency of the ships. Thus, reducing the energy loses will improve the fuel economy and decrease harmful effects on the environment (Kılıc A. and Suner M., 2011). However, despite studies reported on the level of the emission, pollution, and efficiency systems; there have been no studies reported on the emission from the vital systems, such as the effect of the, main engine and auxiliary machinery etc. so. Choi B. C. and Kim Y. M. (2013) illustrated that the energy and exergy efficiencies of the dual loop system were larger than those of the single loop trilateral cycle in thermodynamic analysis of a dual loop heat recovery system. According to the study the volumetric expansion ratio of the turbine could be considerably reduced to an adequate level to be employed in the practical system. The propulsion efficiency of 2.824% was improved, this resulted in about 6.06% reduction in the SFOC and specific CO2 emissions. The study of Larsen U. et al (2015) results suggested that increased system complexity can lead to lower fuel consumption and NO x. Fuel consumption reductions of up to 9% with a 6.5 % NO x reduction were achieved using a hybrid turbocharger and organic Rankine cycle waste heat recovery system. The other study of Larsen U. et al.( 2013) depicted design point, the requirements of process simplicity, low operating pressure and low hazard resulted in cumulative reductions in cycle efficiency. The research was conducted on a framework to bridge the energy efficiency gap in shipping by Jafarzadeh S. and Utne I. B. (2014). Çelek A. (2013) examined the 738 effect of pollution, corrosion and cavitation which cause energy loss in his project titled How to avoid energy losses on vessels in In one study, Suner M. and Birdal M.(2013) illustrated the impact of cavitation on ships with a view on emissions. Arteconi et al. (2010) focused on assessing the emissions of GHG alone, comparing the use of liquefied natural gas (LNG) as a fuel in heavy-duty goods vehicles instead of diesel normally used in such vehicles. In this study, diesel and LNG fuels were compared for use in heavy-duty vehicles in terms of greenhouse gas (GHG) emissions throughout their life-cycle, in the setting of the European market (EU-15). Baldi F., and Gabrielii C. (2015) focused on a feasibility analysis of waste heat recovery systems (WHR) for marine applications, and in this study exergy efficiency is used as independent variable, according to this method fuel savings of 5% 15% can realistically. Behrangrad et al. (2011) investigated that the objective function was social-cost minimization, including the costs associated with energy provision, reserve procurement, expected interruptions and environmental pollution. Moreno-Gutiérrez J. et al revealed (2015) on emissions and energy consumption from ships in their study, and they had used nine methods and compared them regarding study the engine's maintenance an uncertainty factor. Chua et al. (2013) reviewed the most recent developments concerning innovative cooling technologies and strategies stating that such techniques could potentially lower the kw/r tones of cooling systems. In a survey conducted by Ballou et al. (2008), models represented powerful tools that could aid in fuel saving. An exemplary case is the voyage and vessel optimization system (VVOS), proven to reduce fuel consumption and related GHG emission through optimization of vessel operation reference to ocean environment parameters while recognizing ship performance criteria and safe operating limits. In the study by Harrould-Kolieb et al (2010), their forecasts demonstrated that the present IMO mitigation policy didn t reduce emissions in the short-run. Policies regulating carbon dioxide emissions from ships were yet to see implementation by IMO regardless of their immense emission reduction potentials achievable via available operational and technical measures. Hochkirch and Bertram (2010) stated that the energy consuming equipment on the ship could be reduced by adopting a number of approaches. Energy savings could be achieved by adopting efficient electronically controlled pumps, HVAC ventilation system, and energy saving lighting. Mewis and Hollenbach (2007) illustrated that the typical fuel savings was 13% for bulkers or tankers, 16-19% for containerships, for a speed reduction of 5%. Hollenbach and Friesch (2007) demonstrated that the high-efficiency rudders such as a twisted rudder with a Costa bulb might lower power consumption by 4%. In fact, 3% of the world emissions reductions (44 Gt CO2 per year) that is pivotal to stabilization of temperature under 2 0 C must be provided by the Shipping sector (Kontovas, C. and Psaraftis, H. N., 2011). Technologies revolving

294 around refinement of mission, hull resistance reduction, prime mover and propulsion, and low carbon new fuels are crucial recipes for mitigating maritime emissions. The design of vessels to achieve fuel efficiency is practicable for new ships as well as those yet to be constructed by manufactures. Apparently, historic vessels already in use prove difficult or most probably do not lend themselves easy to engineering modifications (Vergara J. et al., 2012). Adopting short-run simulations, Corbett et al. (2009) found out that speed reductions may result in emission reduction across a range of containership routes up to 70% and lower speeds provide CO2 reduction on most routes with higher costs when additional ships are added to maintain scheduled frequency. England. The Liberian Flaggedand IMO numbered vessel has been operated by Makro Shipping and Ship Management Limited since The heat rate is seen in table.1 In this study, the effect of pollution on emission observed from ship main engine and auxiliary have been dealt with together and the best of our knowledge is being reported for the first time in literature. Real samples have been studied and solutions to such problems are offered. II. Methodolgy As it is known fuel oil is derived from crude oil by distillation. Fuel oil is evaluated according to ISO 8217 assessment. It is much less fluent, because the viscosity is high. Mass density at 15 C is kg / m 3. Flame degree, forming a flammable mixture, is the lowest temperature at which fuel air generates steam. It is used to determine the safety value of the fuel. Pour point can be defined as the temperature at which fuel begins to flow in the fluent conditions. Flow test is important to determine the low temperature properties of a fuel. A significant portion of the sulfur, when it is released or remain combined with heavy hydrocarbons, remains in the distillation result in heavy fuel oil. Burning fuel with sulfur creates SO3. Fuel combined with water, formed in combustion, and this result sulfuric acid is formed. Corrosive effect of the sulfuric acid may be controlled by a suitable arrangement of the use of lubricating oil burning and local temperature. CO is toxic, odorless and heavy gas. This gas consists of one mole of carbon and one mole of oxygen. Internal combustion engines cannot provide high oxygen content of the air necessary for combustion, and the transformation to CO2 happens in a short time. So, effective combustion does not occur, and the amount of CO in exhaust gas increases. In combustion, the excess air coefficient is 1.8, and sulfur ratio is 2.5, and lower heat value of the fuel has been kjoule kg/kg fuel. When the theoretical amount of available oxygen and air is used, required minimum amount of oxygen is mol (O2) / kg (fuel) and required real the quantity of air is 2606,011 kg (air) / kg (fuel). In Fig. 1 is seen the Infinitivity ship engine room. M/V Infinity 1985 is a dry cargo vessel constructed in 739 Fig. 1. Mv Infinitivity main engine room Table 1. The general average heat transfer values determined according to average recorded; from October 22 nd, 2013 to November 24 th, 2013 (case1), from to (case2), from January 3 rd, 2014 to April 4 th, 2014(case3) Case Before aground After aground After cleaning Q (Watt) Scavenger Q (Watt) Main engine jacket water Q (Watt) Sea water Q (Watt) Fresh water III. Result and Discusions CO2 emission change is illustrated in the Fig. 2a, SO2 emission change is illustrated in the Fig. 2b, SO3 emission is illustrated in Fig. 2c, NO emission change is illustrated in Fig. 2d, and NO2 emission change is illustrated Fig.2e. As it is seen in Fig.2a, 2b, 2c, 2d, 2e after fulfilling cleaning emissions in all circuits has decreased dramatically. With contamination resulting total emission from four circuit is ton, SO2 emission is kg, kg SO3 emission, kg NO emission, kg NO2 emission, and after fulfilling cleaning the total emission decreased down ton.the largest effect of pollution on emission was observed in sea water circuit. CO2 Emission from the circuits in one hour is shown in Fig.2a, and it is very high. After full filling cleaning the CO2 emission decreased down ton.
295 (a) (b) 740

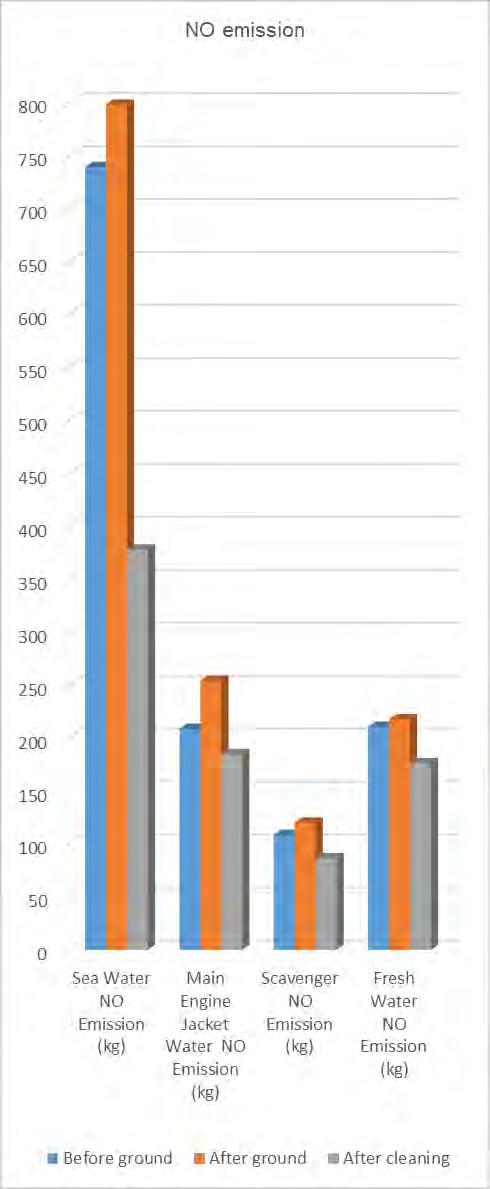
296 (C) (d) 741

297 considerably to the average ton, the average NOx and SOx total emission went down kg. Acknowledgements The data, images and photographs used in this study are compiled by the Tankut Yildiz during the long term marine training voyage, on board the M/V Infinity Vessel, from October 2013 to April Thank to Tankut Yildiz I would like to offer our heartfelt gratitude to Tankut Yildiz, and all of the seafarers and to the owner of the Makro Maritime Lines Limited, for their valuable contribution. Nomenclature Q : Heat Transfer (Watt) (e) Fig. 2 Change in emissions of four circuit for before ground, after ground, and after cleaning a) CO2 emissions, b) SO2 emissions, c) SO3 emissions, d) NO emissions, e) NO2 emissions IV. Conclusions In this study, the effect of on pollution emissions has been determined. The biggest effect of pollution was seen in sea water circuit. Due to the effects of pollution, emissions increases in all circuits. Pollution seems to lead to increased emissions and can be reduced in the whole circuit. In emissions carbon dioxide and nitrogen monoxide emitted it is very high. After fulfill cleaning the total average emission from four circuit decreased by rate of % ton. Component emissions ratios are % O2, 7.423% CO2, 0.15 % SO2, % SO3, % NO, % NO2, 3.742% H2O, and %. When the factor of pollution was eliminated, the total emission from the cylinder jackets, sea water circuit, in scavenger circuit, fresh water circuit went down 742 References A. Arteconi, C. Brandoni, D. Evangelista, F. Polonara. Life-cycle greenhouse gas analysis of LNG as a heavy vehicle fuel in Europe, Applied Energy, 2010, Volume 87, Issue 6, Baldi F., Gabrielii C. (2015) A feasibility analysis of waste heat recovery systems for marine applications, Energy, Volume 80, 1 Pages Ballou, P. Chen, H. and Horner, J.D. (2008). Advanced methods of optimizing ship operations to reduce emissions detrimental to climate change. Oceans, Kobe Japan Çakıroğlu M. (1996) Motor vehicle exhaust emissions in traffic, 1 National Transportation Symposium, Istanbul, (In Turkish) Celek Ahmet. Energy losses occurring in the ship, and what to do to prevent, Thesis (2013), ITU, Turkey. (In Turkish) Choi B. C., Kim Y. M.( 2013) Thermodynamic analysis of a dual loop heat recovery system with trilateral cycle applied to exhaust gases of internal combustion engine for propulsion of the 6800 TEU container ship, Energy, 58, Corbett, J. J. Wang, H. and Winebrake, J. J. (2009). The effectiveness and costs of speed reductions on emissions from international shipping. Transportation Research Part D: Transport and Environment, 14(8), Erdöl, E. (1198) Effect of injector parameters Engine Exhaust Emissions, Istanbul Technical University, Institute of Science and Technology, (In Turkish) Ergeneman, M., Arslan, H., Mutlu M.(1998) Vehicle pollutants resulted from the exhaust is celebrate, O.A. (Editor), Birsen Press, İstanbul, 4-8.
298 Harrould-Kolieb, E. and Savitz, J. (2010). Shipping solutions: Technological and operational methods available to reduce CO2. Oceana. Hochkirch, K. and Bertram, V. (2010). Engineering Options for More Fuel Efficient Ships. GreenTech, Montreal, Canada Hollenbach, U. and Friesch, J. (2007). Efficient hull designs What can be gained, 1 st International Conference on Ship Efficiency. 8-9, Hamburg, Germany ICCT (The International Council on Clean Transportation). Air pollution and greenhouse gas emissions from ocean-going Ships (2007). IMO (International Maritime Organization). Prevention of air pollution from ships. Second IMO GHG Study (2009). Jafarzadeh S., Utne I.B. (2014) A framework to bridge the energy efficiency gap in shipping, Energy, 69, Measures to reduce energy consumption in ship operation. Hansa, 144(5): Moreno-Gutiérrez J., Calderay F., Saborido N., Boile M., Valero R. R., Durán-Grados V., Methodologies for estimating shipping emissions and energy consumption: A comparative analysis of current methods, Energy, Volume 86, 15 June 2015, Pages Suner M., Birdal O. Effect of Cavitation in Ships on the Environment. 2013; Causes Impact and Solution Spinger, Newyork. International Energy Agency (2009) Transport, Energy and CO2 Moving Toward Sustainability UNCTAD (2013) / Review of Maritime Transport, New York and Geneva. Vergara J., McKesson C., and Walczak, M. (2012) Sustainable energy for the marine sector. Energy Policy, 49, K.J. Chua, S.K. Chou, W.M. Yang, J. Yan (2013). Achieving better energy-efficient air conditioning A review of technologies and strategies, Applied Energy, Volume 104, Kılıc A. Suner M.(2011) Operational and environmental costs of a certain ship due to possible energy loses, Proceedings of the Global Conference on Global Warming. Lisbon, Portugal. Kontovas, C. and Psaraftis, H. N. (2011). Reduction of emissions along the maritime intermodal container chain: operational models and policies. Maritime Policy & Management, 38(4): Küçükşahin, F. (2013) Environmental and Gas Emissions, Birsen Publications, Istanbul Larsen U., Pierobon L., Baldi F., Haglind F., Ivarsson A. (2015) Development of a model for the prediction of the fuel consumption and nitrogen oxides emission trade-off for large ships, Energy, 80, Larsen U., Pierobon L., Haglind F., Gabrieli C., Design and optimisation of organic Rankine cycles for waste heat recovery in marine applications using the principles of natural selection, Energy, Volume 55, 15 June 2013, Pages Mahdi Behrangrad, Hideharu Sugihara, Tsuyoshi Funaki. Effect of optimal spinning reserve requirement on system pollution emission considering reserve supplying demand response in electricity market. Applied Energy, Volume 88, Issue 7, July 2011, Pages Mewis, F. and Hollenbach, U. (2007). Hydrodynamic 743
299 POSTER PRESENTATIONS 744
300 Heat and Mass Transfer in a Composite Fluid-Porous Layer Noureddine Hadidi 1*, Ziane Farouk 1, Rachid Bennacer 2, Yacine Ould-amer 3 1 University of Medea, FST, Process engineering and environment, 2600 Medea, Algeria 2 ENS Cachan, Civil engineering, F Cachan Cedex, France 3 USTHB, FGMGP, Department of Energy, Alger, Algeria * [email protected] Abstract In this study we focus on the heat and mass transfer generated in a composite fluid-porous layer. porous layer is considered homogeneous, isotropic and saturated aqueous solution. The domain right and left vertical walls are considered at uniform different temperature and concentration. The influence of the main parameters of double diffusive convection is investigated, namely thermal conductivity ratio and diffusivity ratio on the flow structure and heat and mass transfer. The numerical results are presented and analyzed in terms of streamlines, isotherms, isoconcentrations lines and for the average and are mainly analyzed in terms of the average heat and mass transfers at the walls of the enclosure. Keywords: Double diffusive, porous midium, composite, fluid-porouslayer. I. Introduction The study of heat and mass transfer in saturated porous media takes place more and more important due to the considerable challenge that it represents in new problems related to competition effects of heat and mass. The importance of porous media in the industrial and technological phenomena and processes is now well established. However, despite the rise of ways to study, gaps still exist in terms of basic knowledge, especially understanding the phenomena of heat transfer and mass transfer in systems include porous media. Therefore, studies of the thermosulotal convection in the presence of a porous medium are currently the subject of an ever increasing interest. This interest is due to many practical applications relating thereto, in various applications industrial and natural medium such as the diffusion of pollutants in soil, drying of agricultural products and pharmaceuticals, diffusion of the radioactive substances in the underground deposits reserved for nuclear waste, diffusion of the chemical elements in reactive porous beds (coal gasification), environment, storage of agricultural products, chemical processes Baytas et al (2009), Beghein et al (1992), Ostrach (1980) and Viskanta (1985). More Recently numerical and analytical studies of double-diffusive convection in bi-layered and inclined porous enclosure and for three dimensional in cubical enclosure partially filled by vertical porous layer, the numerical results are presented and analyzed in terms of streamlines, isotherms, isoconcentrations lines and average Nusselt and Sherwood numbers. A scale analysis is used to characterize the effect of the permeability ratio on the heat and mass transfer in case two dimensional analyzed by Hadidi et al (2013),(2015) and (2016). It should be noted that most studies concerned with the double diffusion convection in porous medium are made using a layer of porous medium, while in practice, porous medium do not consist of a single layer, but several layers forming the structure, they are generally designated by multilayer. It is the case for example ground water exposed to the contamination, so does the dispersion of chemical contaminants through water saturated soil, or moisture migration in grain storage systems. II. Mathematical formulation The considered physical problem in the present work is shown in Fig. 1. The cavity contains porous and fluid layers arranged verticalally. It is considered infinitely long, square cross-section. In this case a twodimensional and laminar convection thermosolutal established in the porous walls. The density is considered constant except in terms of thrust (Boussinesq hypothesis). A local thermodynamic equilibrium occurs between the fluid and the porous medium.the model considered is the Darcy Brinkman. Fig. 1: Physical model and coordinates system. 745
301 The governing equations written in dimensionless form are written mathematically as follows: U i Vi 0 (1) X Y 1 U i U i Pi Pr U i Vi U i i X Y. 2 X Dai (2) 2 2 U i U i Rv Pr. Ra i NSi X Y Pr Vi Vi Pi Pr. 2 U i Vi U i i X Y Y Dai (3) 2 2 Vi V i Rv Pr. Ra Pr[ ] 2 2 i NSi X Y r V. ( ) (4) r V 2. D (5) i The index denotes the porous layer, it takes the values 1 or 2. The parameters appearing in these equations are defined in the nomenclature. At side of the boundary conditions, one associates also the conditions of continuity the interfaces. The setting in no dimensional from of the governing equations gave rise to a group of dimensionless parameters, namely, the Darcy number ( ) of porous layer, the Rayleigh number ( ) and the Prandtl number (Pr ). III. Numerical procedure Ra Da The set of differential equations governing free convection in the porous cavity is transformed into a system of algebraic equations with the use of the control volume approach. A staggered grid of nodes was selected on the basis of a grid sensitivity study presented in Table 1. The present code was validated by comparing the results obtained with our code for with those Bennacer et al (2003), Goyeau et al (1996) and Trevisan and Bejan (1985). Good agreement was observed, i.e. see for instance Tables 2. Tab.1:Grid sensitivity for Ram=100, Da 10 4, Pr 0.71, N=1, Le=10. Ra m Bennacer et al. Nu Sh Trevisan and Bejan Nu Sh Goyeau et al. Nu Sh present code Nu Sh Tab. 2: Comparison of Nusselt number in the case of regime Darcy-Brinkman for Pr 0.71, Le 10 Grid x102 2 Nu % error Sh % error and N=0. IV. Results and discussions In this study we present a set of numerical results that physical explanations are made. Numerical simulations cover a wide range of parameters in the case of a composite porous-fluid layer. We consider an aqueous solution as a fluid saturating the porous layers ( Pr 7 ). Porosity, Lewis number) are respectively set to 0.5, 10 and and the buoyancy ratio (N)10 and 3. We placed in the domain cooperating buoyancy forces (N0). First, we have analyzed the effect of permeability ratio on the transfers independently of other parameters. The numerical simulation results are represented as curves and include the shape of the streamlines, isotherms and isoconcentrations lines. The flow structures, isotherms and isoconcentrations lines are presented in Figures 2 to 4. For a situation presenting a low value of, equal to ( Da ) a significant resistance to the flow in the first layer is noted. This behavior is due to the low permeability of the porous layer.for this purpose, the fluid circulation in second layer is more favorable and the thermosolutal convection is more pronounced in fluid layer.indeed,the isotherms are distorted and an intensive temperature gradient takes place in the second layer whereas the isoconcentrations lines are distorted in both layers with formation of a solutal boundary layer on the lefet vertical wall and in both vertical walls at Da 10 2 because the Lewis number is high ( Le 10 ). Da Da 10 6 The isotherms in the first layer ( ) are parallel to the vertical walls, indicating that the heat transfer tends to a diffusive situation. For high permeability ( Da 10 2 )The isotherms are distorted and take place on the diagonal for the entire cavity, the thermal boundary layer tends to be formed, located respectively on the lower and upper parts of the lateral walls.the isoconcentrations lines are, also distorted and take place the entire cavity with a significant tightening on the vertical walls of the cavity and a solutal boundary layer takes place on the lateral walls because the Lewis number is high. The others parameters variation effect are analyzed as the relative (porous Media/fluid) thermal r 1 conductivity ratio ( ) from 10 to 10, the 746


 1 D r r a) 1 10 1, D r r b) 10 Fig.")
 10 Fig.")

 at different values of is")
 and Sherwood number ( )")

 on the heat")
.")
 this behavior is due to the")
302 molecular diffusivity ratio ( D (Da) r ) from to 10, while the Darcy number varied to the results indicate that the effect of thermal conductivity ratio on the flow structure, isotherms and isoconcentrations lines is more significant at different values of Darcy number (Da) varied from 10 6 to D r r a) 1 D r r a) , D r r b) 10 Fig. 2: Streamlines representation for various values, of Da 10 6, Da 10 2 Da , D r r b) 10 Fig. 4: Isoconcentrations representation for various values of Da 10 6, Da 10 2 The evolution of heat and mass transfer of the entire cavity versus the thermal conductivity ratio ( ) at different values of is presented in Figs.5and 6. The Nusselt number ( Nu ) and Sherwood number ( ) increase with increasing the Darcy number Sh Da ( Da ) and a convective regime for high value of Da where Nu and Sh reach a maximum. the effects λ r of conductivity ratio ( ) on the heat transfer is noticeable but it remains weak on mass transfer (for the considered parameters). The transfers are mainly 6 diffusive at low values of Darcy number ( Da 10 ) this behavior is due to the resistance to flow in porous layer. r D r r a) 1 r b) 10 1 r, D 10 Fig. 3: Isotherms representation for various values of Da 10 6, Da 10 2 Fig. 5: The effect of different Da, N 10 r on the Nusselt numbers for 6 and Ra
303 structure, isotherms, isococentrations and transfers. The presence of the porous layer has a strong effects on the heat and mass transfer and the modification of the flow structure, these effects 5 depends essentially on permeability of porous layer and of the parameters related to the double diffusive natural convection characteristics, previously cited. Nomenclature Fig. 6: The effect of for different Da, r on the Sherwood numbers N 10 and Ra 10 The effect of the mass Diffusivity ratio at different values of the on the heat and mass transfer is presented in the Figure 7. The above results show the mass transfer is decrease drastically to reach lower values than 1 and increases for intermediate values of D of r Da for up to a critical value of r D r D cr D r. For high values,the mass transfer ( Sh ) reach a maximum and found to be independent of the, this behavior induces asymptotic mass transfer. The heat transfer is not sensitive for the decreasing low values ( <1) and increase with increasing mass Diffusivity ratio ( ) according to the values of Darcy number ( Da ) because the mass transfer is accompanied by heat transfer. D r D D r r 6 D r D r Mass diffusivity,( m 2 s 1 ) Dai Darcy number of layer i, Ki permeability of layer i, (m2) Le Lewis number, Nub average Nusselt number, N Buoyancy ratio, Pr Prandtl number, Ra Rayleigh number, r Conductivity ratio, Shb average Sherwood number (u,v,w) Velocity component in (x,y,z) direction, (m/s) (U,V,W) Dimensionless velocity component in (X,Y,W) direction, (x,y,z) Horizontal and vertical coordinate,[ m] (X,Y,W) Dimensionless horizontal and vertical coordinate References Baytas A.C., Baytas A.F., Ingham D.B., Pop I., Double diffusive natural convection in an enclosure filled with a step type porous layer: non-darcy flow, International Journal of Thermal Sciences, 48, (2009). Beghein C., Haghighat F., Allard F., Numerical study ofdouble-diffusive natural convection in a square cavity, International Journal of Heat and Mass Transfer, (1992). Bennacer R, Beji H,Mohamad A.A. Double diffusive convection in a vertical enclosure inserted with two saturated porous layers confining a fluid layer Int J of Thermal Sciences, 42, ,(2003). Fig. 7: The effect of r D on the Nusselt and Sherwood numbers for different Da, N 3 6 Ra 10 V. Conclusions and In this article we have presented a numerical study for the contribution to the enrichment of knowledge and response elements to the problems of heat and mass transfer in a composite fluid-porous layer. The present study showed that the permeability of the of porous layer has significant effect on the flow Goyeau B., Songbe, J.P. and Gobin D., Numerical study of double-diffusive natural convection in a porous cavity sing the Darcy-Brinkman formulation, Int. J. Heat MassTransfer, 39, , (1996). Hadidi N., Ould-Amer Y., Bennacer R., Bi-layered and inclined porous collector: Optimum heat and mass transfer, Energy 51, (2013). Hadidi N., Ould-Amer Y., Bennacer R., Twodimensional thermosolutal natural convective heat and mass, transfer in a bi-layered and inclined porous enclosure, Energy 93, (2015). 748
304 Hadidi N., Bennacer R., Three-dimensional double diffusive natural convection across a cubical enclosure partially filled by vertical porous layer, Int. J. Therm. Sci. 101, (2016). Ostrach S., Natural convection with combined driving forces, PhysicoChemical Hydrodynamics, 1,4, (1980). Trevisan O.V., Bejan A., Natural convection with combined heat and mass transfer buoyancy effects in a porous medium, Int. J. Heat mass transfer, 28, , (1985). Viskanta R., Bergman T.L., Incropera F.P., Double diffusive natural convection, in: S.Kakac, W. Aung, R.Viskanta (Eds.), Natural Convection: Fundamentals and Applications, Hemisphere, Washington, DC, (1985). 749
305 Fuzzy Control of the Compression System by the Throttle and Coupled Valves in Petroleum Companies Razika Zamoum Boushaki 1*, Tarik Boushaki 2, Farida Kessal 3 1*,3 Institut de Génie Electrique et Electronique, Laboratoire de recherche Signaux et systèmes, 2 Faculté des sciences de l ingénieur, Université M hamed Bougara, Avenue de l indépendance, Boumerdes, Algeria. * [email protected] Abstract Centrifugal compressors are widely used in industrial fields especially in oil and natural gas processes. One of the major control problems is associated with this type of compressors is the pressure fluctuation or what is called surge. Recently, many methods and techniques are designed and applied in the field to reduce the pressure fluctuation and ameliorate the overall stability of the compression system. This paper presents the application of fuzzy logic active control of surge in centrifugal compressors based on the Moore-Greitzer model. A compression system equipped with a close-coupled valve (CCV),throttle control valve (TCV) and secondary throttle control valve (STCV). The PI fuzzy controller is developed, to control the CCV and STCV at the same time. The combination of the two valves proves helpful in suppressing surge and assists in overcoming the drawbacks of each valve when it is used individually. A switching mechanism is developed for the compressor with both valves that stabilizes the system, extends the stable optimize the operating functioning of the compressor beyond the surge line. Keywords: Centrifugal compressor; Recycle valve; Throttle valve; Fuzzy logic; Active surge; I. Introduction Compression systems employed in industrial fields, and especially in gas processing plants provide vital function to the overall operation of the plant, and therefore, must be vigilantly attended to in order to ensure a high level of operational reliability. The majority of these compression systems employ centrifugal compressors. The general topic of this work is applying some techniques on a compression system, to allow the centrifugal compressor operates in the stable region with maximum performance. The performance and operating range of centrifugal compressors is limited by the occurrence of an aerodynamic instability called surge. Surge is an unstable operating mode of a compression system, characterized by large oscillations in compressor flow and pressure rise. Surge reduces compressor performance and the resulting thermal and mechanical loads can cause structural damage. The surge can create noise that may interfere with the controller or other the equipment and results in malfunction. So the surge control operation makes the compression system more versatile and it allows the machine to run at the most efficient operating points, which are usually located near the surge initiation point. In addition, centrifugal compressors are very sensitive to changes in operating conditions and have a limited operational range, and if exceeded the compressor can be damaged beyond further use. For those reasons, compressors must be controlled properly as by Hansen (2008). So we will deal with the model of centrifugal compressor and the technique of control by fuzzy logic. We will apply this algorithm to show the performance of the system by controlling the recycle and the secondary throttle valves at the same time. This proposition permits to avoid recycling a big quantity of gases and functioning centrifugal compressor with maximum pressure ratio. II. The Model of the Centrifugal Compressor In this work, we will deal with the centrifugal compressor and three cases of such a compressor and its surrounding system will also be presented. A multispeed model for centrifugal compressors is presented in this paper. When the speed is assumed constant, the model reduces to the model of Greitzer (1976). Fig.1 shows the modelled compression system, with a compressor, a duct of length L, a plenum of volume Vp, a throttle, and a drive unit imparting a torque on the compressor. The expressions for the pressure, the mass flow, the shaft dynamic are gotten from the mass balance applied on the plenum. The momentum balance applied on the duct, the angular momentum relationship, respectively. The model of compression system is:. a2 P p p ( QQt ) (1) Vp. Q ( c( Q, N) P 01 P 2 ) L A (2). N 1 ( m c) (3) J 750
. III.")
306 The model (Eq.1)-(Eq.3) was first presented in Gravdahl and Egeland (1999), and the whole model is presented in Fink (1992) but the two first equations are the model of Greitzer. Fig.1: Compression system retrieved from Egeland and Gravdahl (2002). III. Compressor Characteristic The stable part of the steady-state compressor characteristic can be measured for different rotational speeds by throttling down the compressor towards the surge line and measure the mass flow and pressure difference while keeping the speed constant. To measure the true steady-state performance of the compressor, time between measurements must be sufficiently long to allow the system to reach a thermodynamic equilibrium. The measured compressor map for the system under study is shown in Fig.2. Note that, in contrast to Greitzer (1976), the compressor map shows no evidence of rotating stall. Fig.2:The measured compressor map of the centrifugal compressor given by Pignone (1998). IV. The origin of the compressor characteristic In this model which uses the pressure ratio of the compressor c. The compressor characteristic derived from enthalpy transfer in Egeland and Gravdahl (2002) is:. r2n2 (1/2) r2 ( N Q) 2 k Q2 (, ) f c Q N cpt01 k k1 (4) This expression is also valid in the unstable regime to the left of the surge line. The constant α determine the point of the null loss and it is given by: Nsurge_ line Qsurge_ line (5) V. Throttle characteristic In addition to the compressor characteristic, the dynamic model also includes two valve characteristics that describe the mass flows leaving the plenum. Greitzer (1976) and many others have used a simple quadratic characteristic to describe the resistance or load in the compression system. The general relation between the throttle flow and the duct area and the pressure difference.the formula of the flow through the throttle valve is: Qt tanh( ( P2 P01)) kt * ( P2 P01)tanh( ( P2 P01)) Ct ( P 2 P01) (6) VI. Simulation Results of the Compressor Model Fig.3 shows the results from simulation of the two state Greitzer model of the centrifugal compressor in our test apparatus. The compressor is initially operating at a stable point and the throttle valve is 100% open. The design mass flow rate for this compressor is kg/sec. As the throttle valve closes (starting from t = 2 sec), the operating point of the compressor moves towards lower mass flow rates but it is still stable due to the decrease of the charge on the compressor blades until the operating point reaches the surge point. Further closing the feed forward valve (the valve is totally closed i.e. 100%) or closing the trottle valve causes the compressor to enter the surge cycle. The surge cycle has a frequency of approximately 6 Hz. The suction pressure becomes zero furthermore the discharge pressure, the rotating speed of the compressor and the pressure ratio increase to a higher value. The increase in the discharge pressure and speed are due to the small loads applied to the wheels of the compressor, the system then becomes unstable and starts oscillating. The results are summarized as: The mass and throttle flows increase to stabilize at kg/s, but after closing the throttle valve the flows decrease and oscillate between positive and negative flows. The compressor speed increases to stabilize at 1750 (rad/sec), but after the closing of the throttle valve decreases to 3700 (rad/sec); and this is due to the higher mass flow load applied on the impellers. The discharge pressure increases to stabilize at 1.17 *10 5 Pa, after closing the throttle valve, it oscillate beyond 1.2*10 5 Pa. The suction pressure decreases to stabilize at 3.5 *10 4 Pa, after closing the throttle valve, it oscillate beyond 3000 Pa. After closing the throttle valve, the compressor enters in the surge phase, the operating point oscillates between negative (-1.33 kg/sec) and positive flow (1.35 kg/sec). 751
307 throttle flow(kg/s) Flow (kg/s) t(s) (a): Throttle Flow (b): Mass Flow t(s) Pressures (Pascal) 12 x Discharge pressure Suction presssure Speed(rad/s) t(s) (c): Discharge and Suction Pressures (d): Compressor Speed t(s) Pressure ratio Pressure ratio Flow (kg/s) Flow (kg/s) (e): Operating point (f): Zoom of Operating point Fig.3: Simulation results of the compression system in open loop. The harmonics at the starting of the compressor, the mass flow and the speed are due to the automatic starting of the compressor. To avoid this phenomenon, we have to start the system manually, i.e. place a small valve in parallel with the feed flow valve and let the gas pass through it until a small pressure difference is gotten. VII. The Fuzzy Logic Controller Fuzzy logic is widely used in machine control, fuzzy logic has the advantage that the solution to the problem can be cast (given or found) in terms that human operators can understand, so that their experience can be used in the design of the 752 controller. This makes it easier to manage tasks that are already successfully performed by humans. Pr Lotfi Zadeh defined fuzzy sets for incomplete information with single fuzzy membership functions presented by Venkata (2013). Fig.4 represents the fuzzy logic used in machine control. Although neural networks and other algorithms, such as: genetic algorithms can perform just as well as fuzzy logic in many cases.
 to provide a basis for approximate reasoning.")
308 of production rules such as: VII.1. Fuzzy Sets Fig.4: Fuzzy logic process Fuzzy sets are sets whose elements have degrees of membership functions. Linguistic Variables The concept of linguistic variables was introduced by Zadeh (1973) to provide a basis for approximate reasoning. The input space defined by the membership function is sometimes referred to as the universe of discourse. A linguistic variable was defined as a variable whose values are words or sentences. VII.2. Fuzzy Operations Where A and B are two sets on the universe X and x A, x B their respective membership functions [10]. Union (Or) The union of two fuzzy sets A and B is a fuzzy set defined as. It is given by: A B (7) Intersection (And) The intersection of two sets A and B is a fuzzy set defined as A B. It is given by: Fuzzification The fuzzification stage consists of a passage from the real (physical) size variables to a fuzzy logic variables which are linguistic variables with the use of the membership functions to represent the input and output variables by the fuzzy notations. VIII. Control of the Compression System by Recycle (CCV) and Throttle (STCV) Valves The compression system curve is characterized by three levels protection lines (DSL, DSLL and SCL) left to the surge lines (DSH) shown by Fig.5 of Chetate et al (2013). The DSH (surge limit) is measured by the manufacturer. The SCL is shifted downstream by the distance margin 4% to DSH; The DSLL is shifted downstream by the distance margin 2% to SCL; The DSL is shifted downstream by the distance margin 5% to SCL; The purpose of this study is to open the principal throttle valve at 100% and control the opening of the recycle valve with the second throttle valve at the same time by referring to three protection lines (DSL, DSLL and SCL) right to the surge line (DSH). Fig.5.This controller is established to decrease the loss of the recycle flow (the recycled gas is already compressed), in such a way that we minimize the opening of the recycle valve by 20% and compensate this quantity by opening the secondary throttle valve. (8) Complement (Not) The complement of a fuzzy set A is a fuzzy set defined as A. It is given by: (9) Fuzzy if then Rules A fuzzy if-then rule (fuzzy rule, fuzzy implication, or fuzzy conditional statement) is expressed by Ross (2004) as follow: If x is A then y is B. Where A and B are linguistic values defined by fuzzy sets. The basic of the rule base is to represent in a structured way the control policy in the form of a set Fig. 5: Compressor s operating point of Algerian Company The controller is a Mamdani-type fuzzy logic controller with a typical IF-THEN rule structure, this controller consists of two inputs and two outputs as shown in Fig 6. The second output is added to gradually opening the second throttle valve ( 5% for each membership function) until it reaches 20% opened, and the first output will open gradually the recycle valve ( 5% for each membership function)until it reaches 80% opened. 753

 opens the recycle valve and the secondary throttle (both gradually) to compensate the flow in the suction plenum and reduce the quantity of gases in the discharge plenum in order to")
309 IX. Results and analysis To demonstrate the advantages of using the PI fuzzy controller with two outputs of control, we have followed these steps: Fig.6: Structure of the controller in Matlab toolbox Fig.7: Recycle valve membership function First, we start our system then wait for its stabilization. Second, At t=2 second, the feed flow valve is closed to create a disturbance on the compression system Fig.9.b. At this moment the tuned PI Fuzzy controller (with a Kp =0.9 and Ki =1) opens the recycle valve and the secondary throttle (both gradually) to compensate the flow in the suction plenum and reduce the quantity of gases in the discharge plenum in order to stabilize the system. As a consequence: The mass flow decreases from kg/s to stabilize kg/s Fig.9.a ; The suction pressure decreases from x 10 4 Pa and stabilizes at 5.83 x 10 4 Pa Fig.9.f.; The discharge pressure decreases from x 10 4 Pa and stabilizes at x 10 4 Fig.9.f. The compressor rotational speed increases from 862 rad/s until it stabilizes at 1084 rad/s without causing any overshoot because the valves are opened progressively Fig.9.e. The operating point is kept in the stable region Fig.9.e Zamoum et al (2014). X. Conclusion Fig.8: Secondary throttle valve membership function The control action that needs to be taken in this case is to open the recycle valve gradually (closed, Small Open :SO, Middle Open :MO, Great Open :GO and FAST OPEN ). And to open the secondary throttle valve (OPEN, Small Closed :SC, Middle Closed :MC, Great Closed :GC and FAST CLOSE). Hence, the PI fuzzy controller is the result of fifteen rules to open the recycle valve and the secondary throttle valve, the result is summarized in table I: Tab. 1: Fuzzy controller rules Flow Kg/s DSH Region SCL DSLL flow CCV STCV CCV STCV CCV STCV P GO OPEN MO OPEN SO SC Z GO OPEN MO OPEN SO SC N OPEN FAST OPEN GO SC MO MC Flow Kg/s flow DSL Safe Region CCV STCV CCV STCV P CLOSE MC CLOSE GC Z CLOSE MC CLOSE GC N SO GC CLOSE CLOSE FAST CCV: Close Coupled Valve. STCV: Secondary Throttle Control Valve. G: Great; M: middle; S: Small; C:Close; O: Open. In this paper we introduced a new idea for the system to be controlled, an additional output has been included to control the stability of the compressor and the system is stabilized in a smaller amount of time. The PI Fuzzy logic with two outputs control the recycle and secondary throttle valves, which guarantees a robust control in terms of performance and economic by avoiding to recycle a big quantity of gases. Economically, a considerable amount of money will be saved by reducing the amount of compressed gas to be recycled. In other words, optimize the amount of the gas fed to the suction plenum or recycled; because, the PI Fuzzy logic controller is programmed to operate in such a way that it responds to every change in the mass flow of the compression system. Meaning, for any location of the operating point of our centrifugal compressor, the fuzzy logic controller with two outputs is able to control the opening of the two valves in order to achieve the desired targets. Finally this technique is successfully used to model and solve the problem of surge in centrifugal compressors by keeping the system at its stable region with optimum recycled gases Zamoum et al (2014). 754
310 Flow(kg/s) Undershoot of 1.29 % t(s) Flow(kg/s) t(s) Flow(kg/s) t(s) (a ) Mass flow (b) Zoom of the mass flow (c) Zoom of the undershoot Speed(rad/s) Feed & Recycle flows (kg/s) Recycle Flow Feed Flow t(s) (d) Feed and recycle flows t(s) (e) Speed of the compress (f ) Suction and discharge pressures (g) Zoom of suction pressure (e ) Operating point (f) Throttle & Secondary throttle flows Fig.9: The recycle system simulation results with PI fuzzy logic controller of two valves 755
311 Acknowledgements I owe a debt of gratitude to Mr Smail Guessoum Expert Engineer at Sonahess Company and Mr Rabah ALIOUA Director of Conocophillips (Ex. Manager Soahess Company). Nomenclature Q : The mass flow (kg/s) Q f : The feed flow (kg/s) Q t : The throttle flow (kg/s) a p : The speed of sound (m/s) c p : Specific heat at constant pressure (J/kg K) V p : Suction/discharge plenum volumes (m 3 ) P 01 : Ambient pressure (Pa) P P : Section/ Discharge plenum pressure (Pa) T 01 : Ambient temperature ( C) A : Duct area (m) L : Duct length (m) ( Q, N ) : The pressure rise : Drive torque : Compressor torque : Energy transfer coefficient r 1 : Inducer perimeter radius (m) r 2 : Impeller perimeter radius (m) : Constant of incidence loss friction constant k t : Gain of the opening of the throttle k : Constant N : The speed (rad/s) J : The impeller inertia (kg m 2 ) DSL : Low Deviation to the Surge line DSLL : Low Low Deviation to the Surge line SCL : Surge Control line DSH : High Deviation between operating point and SCL m c Zadah L., Outline of a new approach to the analysis of complex systems and decision processes, IEEE Trans. Systems, Man and Cybernetics, 3, (1973). Ross J. T., Fuzzy logic with engineering applications, John Wiley & Sons Ltd (2004). Chetate B., Zamoum R., Fegriche A., Boumdin M., PID and Novel Approach of PI Fuzzy Logic Controllers for Active Surge in Centrifugal Compressor, Ajse, Springer 38, 6 (2013). Zamoum Boushaki R., Zamoum Y., Chetate B., Adaptive Fuzzy Inference Control of the Recycle Compression System, International Review of Automatic Control (IREACO) 7, 3 (2014). Zamoum Boushaki R., Chetate B., Zamoum Y., Artificial Neural Network Control of the Recycle Compression System, Studies in Informatics and Control 23, 1 (2014). References Hansen, Dynamic Simulation of Compressor Control Systems, Aalberg Univ, Esbjerg (2008). Greitzer E. M, Surge and rotating stall in axial flow compressors, part 1: Theoretical compression system model, In Journal of Engineering for Power (1976). Gravdahl J. T., Egeland O., Centrifugal compressor surge and speed control, IEE (1999). Fink D. A., Cumpsty N. A., Greitzer E. M, Surge dynamics in a free-spool centrifugal compressor system, In Journal of Turbomachinery (1992). Egeland O., Gravdahl J.T., Modeling and simulation for control, Marine Cybernetics, Trondheim, (2002). Pignone N., compresseur centrifuge (1998), National Institute of Technology, Rourkela (2007). Venkata Subba Reddy P, Generalized fuzzy logic for incomplete information, IEEE Xplore (2013). 756
312 Experimental Study and Energy Optimization of a Solar Domestic Refrigerator Incorporating a Phase Change Materials Tetbirt Ali 1*, Mokrane Mehdi, Abbas Mohammed, Berdja Mohand, Ferhat Yahi 1 Unité de Développement des Equipements Solaires (UDES)/ EPST-Centre de Développement des Energies Renouvelables (CDER), Bou-Ismail, Tipaza, CP 42000, Algérie * [email protected] Abstract The aim of this work is to study the energy efficiency and optimization of electrical energy consumed by a domestic solar refrigerator of capacity 350 liters, by integrating two types of Phase Change Materials (PCM); pure water and ethylene glycol at 25%. The stored cold by latent heat using a PCM during slow periods will be used during a period of high consumption or most expensive, in this experiment we research to optimize the electrical energy consumption, and allow a significant reduction of the installed power of the refrigerating machine. The refrigerant used in the installation is HFC R134a, the masses of PCMs are variables, filled in small plastic boxes with thin thickness, the average mass in pure water case is 11 grams the average mass in ethylene glycol case is 140 grams. The PCM is placed inside the evaporator chamber attached to the wall. The volum interior of the refrigerator (without evaporator) is divided into three levels: low; middle and top. To measure the variation of the temperature at different levels, thermocouples type K and sensors are placed and connected to a Data-loger, FLUKE brand, the device is connected to a PC, the melting temperatures of both solutions are between 0 C and C., so in this paper the experiment results are processed and discussed. We have observed in this investigate a slight increase in the energetic performance coefficient (COP) in using water and ethylene glycol; we have also observed a decrease in the operating time of the compressor. Keywords: Phase change material, energy efficiency, cooling system, latent heat. I. Introduction The Industrial applications of cold production are many; we can mention for example the air conditioning industry, commercial refrigeration, industrial refrigeration, automotive air conditioning, industrial and refrigerated transport processes the production of cold can occur by melting the ice by vaporizing a liquid by expanding a compressed gas, Peltier (thermoelectric cooling), paramagnetic demagnetization of a material. All these applications are contrary to another important parameter, which is the optimization of energy, electric (minimize compressor running time) or thermal (good thermal insulation) and thus the choice of refrigerant. In terms of optimizing the consumption of electric energy in cold production facilities by electrical energy (conventional or solar) and/or heat that will be for industrial and domestic use, laboratories scientific research interested in energy storage systems discovered several phase change materials (PCM) as they developed others for cold storage and use during critical times. The application of phase change materials is based on the phase transition between the crystalline state and the amorphous state. According to the thermal and electric solar energy derivatives, place it there's mention of the solar cooling that is as best application for the storage of food and pharmaceutical products taking account of periods of sunlight available to our country, it is necessary and important to exploit this resource of free energy especially in the field of production and cold storage. Theoretical and experimental studies using the PCM for improving the production and cold storage, present the fatty material of several researchs in literature, we can include as example of works: a study of free cooling of a low-energy building using a Latent-Heat Thermal Energy Storage (LHTES), they observed that the Numerical simulations study showed that a PCM with a melting temperature between 20 and 22 C, is the most suitable for free cooling in the case of a continental climate and The analyses of the temperatures in a low-energy buildin showed that the free cooling with an LHTES is an effective cooling technique, done by Arkar and Medved (2007). Numerically investidate of a model of the whole plant witch can be used to choose the adequate operation mode and optimizing the energy production by using hierarchical control strategies, they required a simplified models for solving the control problem in a suitable time-window using systems such as Programmable Logic Controllers (PLCs) or microcontrollers, this model has been validated in an ample range of temperatures, working properly throughout the PCM operational range, producing an adequate trade-off between complexity and modeling accuracy, achieve by Gallego et al. (2013). We can also cited a detailed review of work conducted by different researchers on PCM based free cooling, 757
313 they noted that a major challenges being faced in the design of PCM based free cooling system such as phase change materials; their thermo-physical properties and the geometry of encapsulation are elaborated and discussed in detail. Also the parameters effecting the charging and discharging of PCM, effect of phase change temperature and climatic conditions on thermal performance of the free cooling system are also discussed. Potential reduction in CO2 emissions due to the applicability of free cooling systems in residential and commercial buildings are also discussed in this article. This paper also provides a comprehensive list of the PCMs currently being used and that can be used potentially for free cooling applications. At last, this paper also presents some current problems needed further research in this area, presented by Waqas and Ud Din (2013). Experimental investigation of preparation and thermal performances of paraffin/bentonite composite phase change material (PCM) are conducted. Paraffin/bentonite composite PCM are prepared by a solution inter calation process. Its composition and structure are characterized by X-ray diffraction (XRD) and scanning electronic microscope (SEM) method, the heat storage and release performances are characterized with differential scanning calorimeter instrument (DSC) curve and temperature time curves, the results show that the layer distance of bentonite has been increased from nm to nm through organic modification. Paraffin can be intercalated into the layers of bentonite and be made into form stable composite PCM. The latent heat capacity of the composite PCM is J/g. The maximum adsorption ratio of the paraffin in the composite PCM is 44.4 %. DSC curve shows that the melting and freezing point of the composite PCM is 41.7 C and 43.4 C, respectively, which are approximate to that of paraffin. In addition, the heat transfer rate of prepared paraffin/bentonite composite PCM was enhanced by bentonite. The prepared composite PCM can be used in construction energy saving and medical care investigated by Li and Wu (2011). We can also cited studies which focuced on the high temperature thermal energy storage (TES) using phase change materials (PCM) to be applied on cooling and refrigeration systems by solar cooling. In the first, a pilot plant with a working temperature range between 150 & 200 ºC was designed and built at the University of Lleida (Spain). Hydroquinone was selected for the specific application from different PCM candidates as the most suitable material after a literature review and a differential scanning calorimetry (DSC) analysis. This PCM has a phase change temperature range between 166 ºC and 173 ºC and a melting enthalpy of 225kj.kg -1. Two storage configurations were evaluated using the same PCM to have preliminary results before the final storage tank design. From the pilot plant results and experience, a 5 Tn PCM storage tank was designed and built to work in a real solar cooling installation in Seville (Spain). They observed that at the beginning of the charging process, the use of fins gives higher heat transfer rates and therefore energy can be 758 stored quicker but as the quantity of PCM is less due to the fins volume at the end of the process less energy can be stored in the storage tank with fins. Therefore when a partial charging or discharging processes are expected the implementation of fins is beneficial but this is not the normal scenario of a TES system operational mode, therefore the implementation of fins is not recommended for the geometry analysed here. Moreover, the addition of fins represents an increase of the money and time investment and a decrease of the PCM quantity that can be stored in the storage system. For those reasons the implementation of fins in real applications is rejected. in the other hand, during the discharging process the already solidified PCM near the tubes prevents heat transfer between the melted PCM at corners or at central part and the HTF due to its low thermal conductivity, and therefore, the energy stored by that PCM cannot be released again. Therefore, it is important to avoid possible dead PCM volumes in real storage tank designs. When laminar HTF flow were under analysis the benefit of using fins was greater than in turbulent HTF flow. Therefore, this phenomenon has to be taken into account in the design stage since in many applications the HTF works in turbulent flow. After pilot plant scale analysis, a 5 Tn hydroquinone as PCM cylindrical storage tank was designed and built. The design follows the pilot plant scale preliminary design avoiding dead volumes as corners; the storage tank consists on a cylindrical vessel with longitudinal tube bundle inside it. It was placed on the roof of the Engineering School of Sevilla building to give thermal storage in a real solar cooling application. This application is expected to be run during spring/summer 2013, investigated by Gil et al. (2013). In the second experience, the same research team implement and test a thermal energy storage (TES) system using different phase change materials (PCM) for solar cooling applications, materials was designed and built, the working temperature range is from100 to 400 C. Two different PCM were selected after a deep study of there quirements of a real solar cooling plant and the available materials in the market through literature review and DSC analysis. Finally D-mannitol with phase change temperature of 167 C and hydroquinone which has a melting temperature of C was used at pilot plant scale. For both PCMs, no hysteresis was detected, and at pilot plant only D-mannitol showed subcooling even though both showed it during the DSC analysis. An effective heat transfer coefficient between the storage material and the heat transfer fluid (HTF) was calculated. For the same boundary conditions, the energy stored by D-mannitol was higher than that for hydroquinone. Moreover, D-mannitol has polymorphism that needs to be taken into account when the material is used as PCM, but experiments in this paper showed that polymorphism did not interfere its performance as PCM, Gil et al. (2013). Other researchers studied the application of PCM s to an industrial Evaporative Cooling System to enable the capture and storage of night-time sensible


314 free-cooling, as a means of reducing energy costs and improving demand-side management. The stored cooling is subsequently utilised in the Cooling Water system during a day-time peak demand to achieve the required cooling capacity at the required temperature, resulting in a reduction of the day-time refrigeration requirements. A computer model has been created using Matlab/Simulink, to simulate the operation with and without the PCM. The PCM Chiller and Circulation Pump were simulated using manufacturer s data. The Cooling Tower performance was approximated from historical weather data and recorded electrical data. The output of the model demonstrates that the system is functional and successfully achieves a 67% reduction in chiller peak-time operation and saving less than 2% in electrical cost, leads to the conclusion that the installation is not justifiable on a commercial basis alone; however this is a tariff-dependant determination. The PCM offers significant potential to manage energy consumption and provide environmental benefit; however, the expense is prohibitive. Whilst achievement of a cash-flow, Walsh et all (2013). In our study we will analyse experimentally the energy efficiency and numerical study of the temperature distribution inside evaporator chamber in using two different types of PCMs, giving some results regarding the consumption of electrical energy, the performance coefficient and the number of on/off cycles of compressor. II. Materials and methodology The prototype used in the experiment is a domestic refrigerator (Figure1), with a capacity of 350 liters, using the vapor compression system, the refrigerant R134a, has a proper weight of 300 grams the condensation is carried out naturally by the air, the electric power consumed by the compressor at startup is between 350 to 400 watts. The acquisition system (Figure 4) consists of a energy-meter measures the electrical consumption, thermocouples type k (sensors) and recording device is fluke hydra-data-logger connect to microcomputer. Freezing chamber Fig. 1: Refrigerator domestic 350 liter, used in experience 759 The both PCM using in experience were trapped in plastic packs, close to the circuit-face of the evaporator in freezing chamber and the other side of PCMs is exposed in contact with air. The PCMs are a polyethylene glycol at 25 % with an initial melting temperature at C, boiling temperature 197,3 C, density 1,1135 g cm -3 (20 C) 1,1065 g cm -3 (30 C) and pure water (Figures 2 & 3). Freezing chamber thermocouples Ethylene-glycol-PCM in contact with evaporator Fig. 2: thermocouples and polyethylene glycol (PCM) in contact with Evaporator circuit Pur-water-PCM in contact with evaporator circuit Fig. 3: thermocouples and pur-water (PCM) in contact with Evaporator circuit First, the experience on the refrigerator is started without using PCMs in order to acquire the base consumption of the electric energy, as data threshold of comparison, taking into account the thermostat positions: 1 and 3 and 5. Subsequently we launched the experiment using pure water as cold storage material (Figure 3), the amount of water during the first experiment was 565 gr, distributed in thin plastic crates, and the thickness of each unit is about 0.7 cm, placed close to evaporator circuit in freezing chamber of the refrigerator. Generally, for the PCM-ethylene glycol, we kept of the experiment the same conditions and parameters (measuring devices, location and mass of PCM and thermostat positions).

 Experiment performance Coefficient (COPexp). b c COP exp = Q cc / W (4) Theorical performance Coefficient (COPth) COP th = T c / (T c T ev ) (5) Tab.")
 Q c (kj/gr) Q cc (kj/gr) T ev ( C) T c ( C) 51.799 194.81 143.15-19.45 37.25 2.76 COP exp Tab. 3: experiment data in using polyethylene glycol 25%.")
315 III. Results and discussions In order to analyze and discuss the results acquired by the experimental, we selected the average room temperature of C, recorded by the Fluk-Data-Loger and the temperatures of the various organs of our refrigerator relating to the first position of the thermostat and the air flow in the evaporation chamber is considered permanant diet (without opening and closing the door) and no load. Cooling capacity. Q cc = h e,out h e,in (2) Amount of heat evacuated by the condenser. Q c = W + Q cc (3) Experiment performance Coefficient (COPexp). b c COP exp = Q cc / W (4) Theorical performance Coefficient (COPth) COP th = T c / (T c T ev ) (5) Tab. 1: experiment data without using PCMs W (kj/gr) Q c (kj/gr) Q cc (kj/gr) T ev ( C) T c ( C) COP exp Tab. 2: experiment data in using Water-PCM W (kj/gr) Q c (kj/gr) Q cc (kj/gr) T ev ( C) T c ( C) COP exp Tab. 3: experiment data in using polyethylene glycol 25%. W Q c Q cc T ev T c COP exp (kj/gr) (kj/gr) (kj/gr) ( C) ( C) Fig. 4: a) Acquisition system connected with mirocomputer, b) thermocouples type-k, c) Eclectrical energy-meter. Data acquisition was carried out by a (Fluke Hydra-Logger 2700), connected to a computer via a graphical interface for communication, in using a graph plotter (fast track) with time, the acquisition system allows to visualize the instantaneous variation in temperature. The results of the measured temperatures and collected by thermocouples are recorded in an Excel file each 30 seconds. IV. Coefficient of performance (COP) and consumed Electrical energy data IV. 1. Calculate of the COP We calculated the energy performance associated to the system namely, the work or power provided by the compressor, evaporator power, the amount of heat removed by condenser, evaporation and condensation temperatures in circuit (Te, Tc) are given by. Compressor power. W = h c,out h c,in (1) In analyzing the different COP values calculated in different steps of experiment, we were noticed a slight increase in the COP of the refrigeration machine after using PCM-water by 7.4 % and PCM-polyethylene glycol by 1.6 %. Then, we can observe a slight rise in temperature of evaporator chamber and a decrease in the condensation temperature. IV. 2. Electrical energy data consumed During the experiments, energy meter was set in aim to measure the refrigerator power consumed in position 1, 3 and 5, of thermostat (table 4). Tab. 4: electric energy (EE) consumption in three positions of thermostat, without and with using PCMs. EE consumption (kw/h/day) Without PCMs Position 1 Position 3 Position With PCM-Water With PCM-ethylene glycol 25 % V. Numerical simulation of the temperature distribution within the freezing chamber In order to equate the temperature distribution within 760
316 the evaporation chamber (30 cm x 30 cm) and more accurate the contact region (interface) between the PCM and the evaporator circuit, a mathematical model was computed under Matlab, accordingly results of figures were discussed. Y Fig. 5: temperature distribution in freezing chamber without using PCMs Wide cold region close to evaporator circuit X that the temperature fluctuation was reduced in the freezing chamber 1.6 C for the PG and 3.5 C for water, we were also observe an increase in COP for both experiments. Nomenclature hc,in : enthalpy of condenser input-circuit (kj/kg) hc,out : enthalpy of condenser output-circuit (kj/kg) he,in : enthalpy of evaporator input-circuit (kj/kg) he,out : enthalpy of evaporator output-circuit (kj/kg) Qc : Amount of heat evacuated by the condenser (kj/kg) Qcc : Cooling capacity (kj/kg) Tc : everage temperature of condenser ( C) Tev : everage temperature of evaporator ( C) W : compressor power (kj/kg) Subscripts COP : coefficient of performance COPth : theorical performance coefficient COPexp : experiment performance coefficient EE : electrical energy PCM : phase change materials 0.02 wide Cold region close to evaporator circuit References Y Arkar C., Medved S., Free cooling of a building using PCM Heat storage integrated into the ventilation system, solar energy, 81, (2007), X Fig. 6: temperature distribution within freezing chamber with using water-pcm. Gallego A. G., Ruiz-pardo A. Cerezuela-Parish A., Sanchez J., Martin-Macareno C., Cabeza L. F., Camacho E. F., Oro E., Mathematical Modeling of a PCM storage tank in a soilar cooling plant, Solar Energy, 93, 1-10 (2013). Waqas Adeel, Ud Din Zia, Phase change material (PCM) storage for free cooling of buildings-a review, Renewable and Sustainable Energy Reviews, 18, (2013). Y wide zone but not so cold, close to evaporator circuit Li Min, Wu Zhishen, Kao Wingtao, Tan Jinmiao, Experimental investigation of preparation and thermal performances of paraffin/bentonite composite phase change material, Energy converetion and management, 52, (2011) X Fig. 7: temperature distribution within freezing chamber with using polyethylene-glycol-pcm. VI. Conclusion We presented in this paper, an energy study of a solar domestic refrigerator, with and without the integrating of PCMs, in order to show the utility of storage and use of the cold stored by the phase change materials and its energy performance. We can conclude in using water and polyethylene glycol 761 Gil Antoni, Oro Eduard, Miro Laia, Peiro Gerard, Ruiz Alvaro, Manuel Salmeron José, Cabeza Luisa F., Experimental analysis of hydroquinone used as phase change material (PCM) to be applied in solar cooling refrigeration, International Journal of Refrigeration, 39, (2014). Gil Antoni, Oró Eduard, Peiró Gerard, Álvarez Servando, Cabeza Luisa F., Material selection and testing for thermal energy storage in solar cooling, Renewable Energy, 57, (2013). Walsh Brendan P., Murray Sean N., O'Sullivan D. T. J., Free-cooling thermal energy storage using phase change materials in an evaporative cooling system, 59, (2013).
317 Removal of Ions Pb 2 + and Cd 2 + from Aqueous Solution by Containment Geomaterials Souhila Ait Hamoudi 1,2 *, Boualem Hamdi 2, Jocelyne Brendle 3 1 Centre de Rechercher scientifique et technique en Analyse Physico Chimique (CRAPC), BP248 Alger RP Algérie 2 Laboratoire de Physico Chimie des Matériaux et Application à l Environnement LPCMAE, faculté de chimie, Université des Sciences et Technologies Houari Boumediene USTHB, BP32 Al Alia, bab ezzouar, Alger, Algérie 3 Equipe Matériaux à Porosité Contrôlée, Institut des Sciences des Matériaux de Mulhouse, CNRS LRC 7228, Université de Haute Alsace, ENSCMu 3 rue Alfred Werner Mulhouse Cedex France. [email protected] Abstract Industrial activity generates huge amounts of waste, whose storage can lead to serious problems of groundwater pollution by infiltration of landfill leachates. Geomaterials used as water barriers may be a solution to this problem. This work is devoted to the elaboration of new geomaterials called GM1, GM2 and GM3 based on Algerian clay, activated carbon, cement and polymer for containment of stored waste and the study of their performances towards inorganic pollutants. The higher clay content (80%) was used in preparing GM1.The retention properties towards lead and Cadmium were assessed by the adsorption isotherms of geomaterials. Keywords: Geomaterials, activated carbon, lead. I. Introduction The large-scale production of various chemicals, energy and other industries development produces huge amounts of waste into the environment as solids, liquids and gas. The wrong elimination of these wastes can lead to air (volatilization of dust), surface water (surface runoff water), groundwater (infiltration) and soil (due to the erosion) contamination (Du and Hayashi, 2006). A leachate is mainly composed of major mineral ions, xenobiotic organic compounds, xenobiotic organic compounds and ions of heavy metals (Christensen et al., 1994) among which we distinguish lead. Most concentrations of lead that occur in the environment result from human activities. Lead can come from various sources such as battery manufacturing, paper and pulp, fuel boats and ships, printing press, automobile exhaust, paints and varnishes, metal products and cables (Moore and Ramamoorthy, 1994). It spreads into the environment through soil and groundwater and accumulates in the food chain, causing a risk to human health or the environment (soil, air, water) because of improper management (Jun et al., 2009). It is therefore imperative to find a solution to eliminate these pollutants from landfill by quantitative retention. Understanding the adsorption mechanism requires the characterization of interfaces studied either at surface, porosity or chemical nature of adsorption sites of materials (Tuncer, 2003). One of the ways to face meet the problem of hazardous waste accumulation is controlled landfills sites (Bilitewski et al., 1997). The aims of waste containment are to ensure: the reduction of inflows 762 and outflows of water from the site, furthermore, the efficient drainage of the leachate to reduce leaches through the soil (Cuevas et al., 2009). To reach these aims, Technical Landfill Centres storage requires the existence of a security barrier that constitutes the guarantee of long-term storage installation. The sealing of the barrier must be optimal to ensure the protection of natural environment, preventing groundwater and surrounding soil from polluting leachate (outflow), and also the arrival of groundwater in the site (inflow) (Erto et al., 2011). The primary function of sealing is characterized by the permeability of the material forming the safety passive barrier, whose sealing must be durable and resistant to mechanical stress during the implementation operation and possibly the chemical action of leachate. The passive barrier must also submit a high retention capacity and be able of trapping organic and inorganic pollutants (Selim and Amacher, 2001). Numerous studies have shown that clay is largely used as a landfill barrier and that it had a considerable effect on heavy metals adsorption (Sauvé et al., 2000a; Sauvé et al., 2000b; Houari, et al., 2007). Clay minerals, due to their small particle s size and complex porous structure, constitute a natural material with lowest permeability. Their high specific surface area allows strong physical and chemical interactions with fluids and dissolved species which are subjected to electrostatic repulsion, sorption or specific cation exchange reactions (Karanfil and Dastgheib, 2004). These interactions are responsible for the retention of
318 leachate components (Michael et al., 2002; Li et al., 2008). A notable trend in the development of activated carbon, an adsorbent with its large porous surface area, controllable pore structure, thermostability and low Acid/Base reactivity has been promulgated (Foo and Hameed, 2009). In most cases, activated carbon adsorption has revealed the prominence in removing an essential amount of organic compounds such as polyaromatic hydrocarbons and VOCs from the leachate samples (Karanfil and Dastgheib, 2004). This preferential adsorption is due to main types of interactions: adsorbate activated carbon, adsorbate solution and activated carbon solution (Wibowo et al., 2007), due to the attraction occurring between the orbital on the carbon basal planes and the electronic density in the polyaromatic hydrocarbons rings ( interactions) (Hamdi et al., 2004). Our literature review showed that several studies have used either clay or activated carbon as a barrier. The novelty of our study is to gather clay and activated carbon performances to elaborate new geomaterials with improved physico-chemical properties intended to be used as an engineered barrier to lead removal from an environmental polluted with this metal. In terms of environment and pollutant removal, clay has a high capacity to trap heavy metals by cation exchange, and activated carbon plays a very important role in the retention of organic pollutants. In terms of cost, clay is abundant in nature and is not expensive to treat, compared to activated carbon which treatment and activation are more expensive. Thus, we elaborated a range of geomaterials based on Algerian bentonite from Maghnia (ATMa) and activated carbon (AC), which mechanical properties have been improved by adding cement. The adherence of these three components is reinforced by PVA polymer (Hamdi et al., 2004). It is important to note that in geomaterials prepared in this work the weight percentage of clay is larger than the mass percentage of activated carbon. II. Synthesis Purified Clay and the geomaterial constituents were blended with different weight percentages with 100 ml of distilled water, under constant magnetic stirring for 48 h. The mixture was then centrifuged and dried at room temperature and the final product was crushed and sieved to obtain geomaterial. II.1. Characterization II.1.1. N2 Adsorption-desorption The specific surface of our materials was determined by the BET method (Brunauer et al., 1938). Measurements were carried out at 77 K on the Micromeritics ASAP 2040 apparatus. Before the analysis, samples were degassed for about 15 h. II.2. Adsorption experiment Adsorption kinetics were studied at 25 C by introducing separately 0.3 g of solids (geomaterials) in 50 ml of Pb2+ and Cd2+ aqueous solution (100 ppm) at ph 4.5 for lead and ph 5 for cadmium, by using various times of contact (0.5, 1, 1:30, 2, 3, 4, 5, 6, 7, 8, 16 and 24 h), each bottle was subjected to a stirring with a speed of 130 oscillations / min. The samples were taken from separate bottles, and at the desired contact time each sample was filtered and the supernatant were analysed by atomic absorption spectroscopy. The adsorption isotherms were studied by introducing 0.3 g of solids in 50 ml of Pb2+, Cd2+ aqueous solution at different concentrations (25, 50, 100, 150, 200, 300, 400, 500, 600, 700 and 800 mg/l for 24 h. These experiments were carried out under the same operating conditions (ph 4.5 and fixed stirring speed at 298K. III. Results and discussion III.1. Characterization In order to determine specific surface areas and porous volumes, geomaterials, and their mineral constituents were characterized by the BET method. Table 1 gathers the various characteristics of studied materials. Table 1: Geomaterials composition and characteristics Geomatérials GM1 GM2 GM3 ATMa Cement AC PVA % % % % SBET (N2/77 K) Vp, (cm3. g 1 ) CEC meq/100g III.2. Adsorption kinetics of Pb2+ on GM1, GM2 and GM3 Figure 1 shows the ion adsorption kinetics Pb2+ on the prepared geomaterials (GM1, GM2 and GM3). The Pb2+ uptake was rapid for GM1, adsorption equilibrium is reached after 30 min and 60 min for both GM2 and GM3. The adsorption capacity of GM1 (Qa = mg / g) is very close to that of GM2 (Qa = mg / g). That obtained on GM3 is relatively slightly lower with Qa of 9 mg / g. Equilibrium is reached faster, 30 minutes indicating that the initial adsorption for GM1 was very fast and the maximum adsorption was reached within 30 minutes and, subsequently increasing the adsorption remained almost constant. This is due to the decrease of the adsorption sites on the adsorbent gradually interacted with the metal ion (Ruthven, 1984). 763
319 The adsorption capacity of Pb2+ GM1 (Qa = mg / g) was greater than that other geomaterials. For this, GM1 was selected to study the adsorption kinetics of cadmium (Cd2+). Qa, mg/g C 0 =100 mg/l GM1 GM2 GM t, min Fig.1. Adsorption kinetics of Pb2+ on geomaterials GM1, GM2 and GM3 at 25 C and solution ph (ph 4.5) III.3. Adsorption kinetics of Cd2+ on GM1 On Fig.2 are compared the adsorption kinetics of GM1 obtained with Pb2+ and Cd2+ when they are in a mono-ionic solution. The figure clearly shows that the retention of Pb2+ ions (Qa = mg / g) is substantially greater than that of Cd2+ ions (Qa = 6.04 mg / g). The difference between the adsorption capacity Pb2+ to that of Cd2+ on GM1, is generally attributed to differences in characteristics of the metal ions and the resulting affinity for adsorption sites (McBride, 2000; Appel and Ma, 2002). III.4. Adsorption isotherm of Pb2+ and Cd2+ on GM1 Fig 3 shows that the lead is adsorbed on GM1 compared to cadmium this is interpreted by Qa is 77.4 mg/g for lead and is mg/g for Cd2+, for residual concentrations Ce 2 and mg/l, respectively for Pb2+ and Cd2+. Qa, mg/g 14,0 10,5 7,0 3,5 0,0 C0=100 mg/l Pb 2+ Cd t, min Fig2. Adsorption kinetics of Pb2+ and Cd2+ on GM1 at 25 C and solution ph (ph = 4.5 for Pb2+, ph = 5 for Cd2+) Qa, mg/g Pb Ce, mg/l Cd 2+ Fig 3. Adsorption isotherm of Pb2+ and Cd2+ on GM1 at 25 C IV. Conclusion In this work, the behaviour of geomaterials developed was studied toward the metal ions Pb2+ and Cd2+. The adsorption kinetics of Pb2+ on GM1 is fast compared to that of GM2 and GM3. The geomaterial GM1 has a great capacity to retain lead compared to cadmium. This is confirmed with adsorbed amount for both metals, this result is also due to the characteristics of metal ions. References Appel, C., Ma, L., Concentration, ph, and surface charge effects on cadmium and lead sorption in three tropical soils, J. Environ. Qual. 31, (2002). Bilitewski, B., Hardtle, G., Marek, K., Weissbach, A., Boeddicker, H., Waste Management (Eds) Springer, Berlin. pp 699 (1997). Brunauer, S., Emmett, P.H., Teller, E., Adsorption of gases in multimolecular layers. J. Am. Chem. Soc, 60: (1938). Christensen, T.H., Kjeldsen, P., Albrechtsen, H.J., Bjerg, P.L., Holm, P.E., Attenuation of landfill leachate pollutants in aquifers. Crit Rev. Environ. Sci. Tech, 24: (1994). Cuevas, J., Leguey, S., Garralón, A., Rastrero, M.R., Procopio, J.R., Sevilla, M.T., Jiménez, N.S., Abad, R.R., Garrido, A., Behavior of kaolinite and illite-based clays as landfill barriers. Appl Clay Sci, 42: (2009). Du, Y.J., Hayashi, S. A., study on sorption properties of Cd2+ on Ariake clay for evaluating its potential use as a landfill barrier material. Appl. Clay Sci, 32: (2006). Erto, A., Lancia, A., Bortone, I., Di Nardo, A., Di Natale, M., Musmarra, D., A procedure to design a Permeable Adsorptive Barrier (PAB) for 764
320 contaminated groundwater remediation. J. Environ. Manag, 92: (2011). Foo, K.Y., Hameed, B.H., An overview of landfill leachate treatment via activated carbon adsorption Process. J. Hazard. Mater, 171: (2009). Hamdi, B., Houari, M., Ait Hamoudi, S., Kessaissia, Z., Adsorption of some volatile organic compounds on geomaterials. Desalination, 166: (2004). Houari, M., Hamdi, B., Brendle, J., Bouras, O., Bollinger, J.C., Baudu, M., Dynamic sorption of ionizable organic compounds (IOCs) and xylene from water using geomaterial modified montmorillonite. J. Hazard. Mater, 147: (2007). Jun, D., Yongsheng, Z., Weihong, Z., Mei, H., Laboratory study on sequenced permeable reactive barrier remediation for landfill leachate-contaminated groundwater. J. Hazard. Mater, 161: (2009). Sauvé, S., Norvell, W.A., McBride, M., Hendershot, W. Speciation and Complexation of Cadmium in Extracted Soil Solutions. Environ. Sci. Technol, 34 (2): (2000b). Selim, H.M., Amacher, M.C., Sorption and release of heavy metals in soils: nonlinear kinetics. In: Selim, H.M., Sparks, D.L. (Eds.), Heavy Metals Release in Soils. CRC Press, Florida, pp 1 29 (2001). Tuncer Edil, B., A review of aqueous-phase VOC transport in modern landfill liners. Waste Manag, 23: (2003). Wibowo, N., Setyadhi, L., Wibowo, D., Setiawan, J., Ismadji, S., Adsorption of benzene and toluene from aqueous solutions onto activated carbon and its acid and heat treated forms: Influence of surface chemistry on adsorption. J. Hazard. Mater, 146: (2007). Karanfil, T., Dastgheib, S. A., Trichloroethylene adsorption by fibrous and granular activated carbons: aqueous phase, gas phase, and water vapor phase adsorption studies. Environ. Sci. Technol, 38: (2004). Li, W., Zhang, L.B., Peng, J.H., Li, N., Zhu, X.Y., Preparation of high surface area activated carbons from tobacco stems with K2CO3 activation using microwave radiation. Indus. Crops Prod, 27: (2008). McBride, M.B., Chemisorption and precipitation reactions, in: M.E. Sumner (Ed.), Handbook of Soil Science, CRC Press, Boca Raton, FL, pp. B265 B302 (2000). Michael, A., Malusis, M.A., Shackelford, D., Theory for reactive solute transport through clay membrane barriers. J. Contam. Hydrol, 59: (2002). Moore, J., Ramamoorthy, W.S., Heavy Metals in Natural Waters (Eds.) Springer-Verlag: New York, pp 18-57, 77-99, pp (1994). Ruthven, D.M.,. (Eds), Principles of adsorption and adsorption process, John Wiley & Sons, New york, pp.16 (1984). Sauvé, S., Hendershot, W., Allen, H.E., Solid- Solution Partitioning of Metals in Contaminated Soils: Dependence on ph, Total Metal Burden, and Organic Matter. Environ. Sci. Technol., 34 (7): (2000a).. 765
321 8 th International Exergy, Energy and Environment Symposium The Dissolution Behavior of Lead Oxide in Aqueous Organic Acid Solutions S. Bendebane*, S. Djerad, L. Tifouti Laboratory of Environmental Engineering, Department of Chemical Engineering, University of Annaba, P.O. Box 12, Annaba 23000, Algeria. * [email protected] ; [email protected] Abstract Processing industries generate metallic wastes that are not always recycled. Among these wastes, lead and its compounds are usually encountered in landfills leading to pollute the environment (Koller 2009; Chiffoleau et al. 2001). In fact, soil may contain organic products and corrosive substances that react with this metal and its compounds (Nduwayezu 2010; Cecchi Marie 2008; Schwab, Zhu, and Banks 2008; Denaix, Semlali, and Douay 2001). As a consequence, these solids are dissolved and soil, surface water and groundwater are polluted. In this study we were interested on the kinetic release lead oxide when contacting two organic acids usually present in the soil which are acetic and tartaric acids. The effect of acid concentration and temperature were investigated. The results have shown that the dissolution of lead oxide in contact with acetic acid is faster than with tartaric acid. The complexometric character of tartaric acid may be the cause of such behavior. Keywords: Organic acids, Release, Lead oxide, Wastes, Pollution. I. Introduction The development of urbanization and concentration of industrial and agricultural activities during the last two centuries has been accompanied by a general increase in pollution. Among the main pollutants generated by industrial activities, heavy metals are found everywhere in the nature (Koller 2009; Murat 1981; Turlan 2013). Lead remains one of the most widely used metals in the world (Aranguren 2008). It is used in different fields such as in pipes water distribution (Uchida and Okuwaki 1999), extraction, mining, automotive fuels, paints, processing facilities, recycling waste batteries (Zhu et al. 2013; Sonmez and Kumar 2009a; Sonmez and Kumar 2009b), solder, crimping, protection against radiation, firearms, etc... The presence of lead in waste in particular, can cause soil contamination (Ettler et al. 2009; Pérez-Esteban et al. 2013; Schwab, Zhu, and Banks 2008; Citeau et al. 2003; Denaix, Semlali, and Douay 2001)and reduces opportunities for recovery and recycling of waste. This poses an environmental problem because lead is classified as potentially toxic metal (M Gérard Miquel 2001). Once the soil contaminated, lead can be transferred to ecosystems and pose a hazard to human health. The aim of this work is to study the impact of organic acids present naturally in the environment on the dissolution of the metal deposits. In fact, citric and acetic acids are often present in organic wastes due to their fermentation. When metals or metal oxides come into contact with these organic acids then a certain amount is dissolved depending on the environmental conditions. In this study the behavior of lead oxide PbO in the presence of tartaric and acetic acids was investigated. Different parameters were tested such the effect of the acid concentration and temperature. II. Experimental Acetic acid (99.99%, Riedel de Haen) and tartaric acid (99%, Sigma Aldrich) were used as leaching reagents. Deonized water was used to prepare all aqueous solutions. Tests of lead were performed in a backer of 250 ml capacity. Agitation was carried out by chemical stirrer, and the temperature was kept constant using a thermostatic bath. The experiments were performed by contacting a certain mass of lead oxide ( g) with 250 ml of the desired solution. The volume of 250 ml was chosen not only to avoid the saturation of the solution but also to prevent the solubility-control phenomenon in the leachate. Pb 2+ present in aqueous solution was analyzed by a volumetric method using Eriochrome Black T as indicator (Mendham and others 2006). Lead dissolved was calculated in term of molar percentage using the expression: Yield (%) = n PbO n PbO0 100 (1) Where npb is the number of moles of Pb 2+ analyzed in the solution (mol), npb0 is the initial number of moles which is calculated as following: n PbO0 = m PbO M PbO (2) Where mpbo is the weight of PbO (0.1107g) and M is the molar mass of lead oxide (223.2g/mol). The concentration of solutions used for the dissolution of lead oxide was varied from to M and 766
322 8 th International Exergy, Energy and Environment Symposium the temperature from 25 C to 50 C under 350 rpm. III. Results and discussions concentration of 0.05 M and the temperature was varied between 25 and 50 C. The results are shown in figure 2. III.1 Effect of acid concentration The effect of the acid concentration on the dissolution of lead oxide with acetic and tartaric acids was study by maintaining constant the following conditions: stirring speed of 350rpm; liquid/solid ratio L/S of 2.5 L/g; temperature of 25 C and the concentration was varied between 0,005M and 0,05M. The results are shown in figure 1. The results show that the dissolution of lead oxide increases with increasing the concentration. The dissolution was faster with acetic acid compared to tartaric acid. In fact, it attained 100% with acetic acid at the concentration of 0.05 M after 5 min of contact while with tartaric acid it reached 85.47% under the same conditions. It should be noted also that in both cases the dissolution remained high even at low acid concentration. In fact, with acetic and tartaric acids at 0.005M the dissolution stabilized at 95.8% and 82% respectively. Thus, lead oxide is a highly dissolving compound. Fig. 2. Effect of temperature on lead oxide dissolution with acetic and tartaric acids. Operation conditions: Cacid =0,05M, liquid/solid=2.5l/g, agitation=350rpm. The results show that the dissolution of lead oxide strongly increases with the temperature in the presence of acetic acid. Indeed, total dissolution was observed at 25 C after 10 min of reaction. It decreases to 5 min at 45 C and 3 min at 50 C.This confirms the ease of dissolution of lead oxide in the presence of acetic acid (Aquatias et al. 2001). The dissolution behavior of lead oxide in the presence of tartaric acid was different from that obtained with acetic acid since a slow dissolution was observed. In fact, the dissolution increased with increasing the temperature. The highest release of lead oxide in the presence of tartaric acid was obtained at 50 C where 100% were dissolved after 45 min. After the same period of time 91.86% were dissolved at 25 C. IV.Conclusion Fig. 1: Effect of the concentration of acetic and tartaric acids on lead oxide dissolution. Operation conditions: liquid/solid=2.5l/g, agitation=350rpm, T=25 C. III.2 Effect of temperature To study the effect of temperature on the dissolution of lead oxide, tests with acids acetic and tartaric were made under the following conditions: stirring speed of 350rpm; liquid/solid ratio (L/S) of 2.5 L/g; 767 The results obtained during this study showed that metal depositing may have a serious negative effect on environmental pollution. In fact, organic acids are naturally present in soil and may react easily with several metals or metal oxides leading to dissolve them and pollute the environment. This was observed with tartaric and acetic acids when contacting lead oxide. Acetic acid dissolved rapidly the metal oxide at ambient temperature at the concentration of 0.05M after only 5 min of contact. Tartaric acid needed longer reaction time to dissolve PbO probably because of its chemical structure more complicated than acetic acid.
323 8 th International Exergy, Energy and Environment Symposium Nomenclature Y : Yeild (%) n PbO : The number of moles of Pb 2+ analyzed in the solution (mol) n PbO0 The initial number of moles of Pb m PbO the weight of PbO (0.1107g) M PbO The molar mass of lead oxide (223.2g/mol) References Aquatias, Sylvain, Jocelyne Arditti, Isabelle Bailly, Marie-Berthe Biecheler, Monsif Bouaboula, Jean- Claude Coqus, Isabelle Grémy, et al Cannabis : quels effets sur le comportement et la santé. Aranguren, Matías Miguel Salvarredy Contamination En Métaux Lourds Des Eaux de Surface et Des Sédiments Du Val de Milluni (Andes Boliviennes) Par Des Déchets Miniers Approches Géochimique, Minéralogique et Hydrochimique. Université Paul Sabatier - Toulouse III. Citeau, L., I. Lamy, F. Van Oort, and F. Elsass Colloidal Facilitated Transfer of Metals in Soils under Different Land Use. Colloids and Surfaces A: Physicochemical and Engineering Aspects 217 (1): Schwab, A. P., D. S. Zhu, and M. K. Banks Influence of Organic Acids on the Transport of Heavy Metals in Soil. Chemosphere 72 (6): Sonmez, M. S., and R. V. Kumar. 2009a. Leaching of Waste Battery Paste Components. Part 1: Lead Citrate Synthesis from PbO and PbO2. Hydrometallurgy 95 (1 2): Leaching of Waste Battery Paste Components. Part 2: Leaching and Desulphurisation of PbSO4 by Citric Acid and Sodium Citrate Solution. Hydrometallurgy 95 (1 2): Turlan, Tristan Les Déchets : Collecte, Traitement, Tri, Recyclage. Dunod.. Uchida, Miho, and Akitsugu Okuwaki The Dissolution Behavior of Lead Plates in Aqueous Nitrate Solutions. Corrosion Science 41 (10): 1977 Zhu, Xinfeng, Xiong He, Jiakuan Yang, Linxia Gao, Jianwen Liu, Danni Yang, Xiaojuan Sun, Wei Zhang, Qin Wang, and R Vasant Kumar Leaching of Spent Lead Acid Battery Paste Components by Sodium Citrate and Acetic Acid. Journal of Hazardous Materials : Denaix, L, R. M Semlali, and F Douay Dissolved and Colloidal Transport of Cd, Pb, and Zn in a Silt Loam Soil Affected by Atmospheric Industrial Deposition. Environmental Pollution 114 (1): Ettler, Vojtěch, Rŭžena Vrtišková, Martin Mihaljevič, Ondřej Šebek, Tomáš Grygar, and Petr Drahota Cadmium, Lead and Zinc Leaching from Smelter Fly Ash in Simple Organic Acids simulators of Rhizospheric Soil Solutions. Journal of Hazardous Materials 170 (2): Koller, Emilian Traitement des pollutions industrielles : Eau, air, déchets, sols, boues. Édition : 2e édition. Paris: Dunod. Mendham, John, and others Vogels Textbook of Quantitative Chemical Analysis. Pearson Education India. M Gérard Miquel Les Effets Des Métaux Lourds Sur L environnement et La Santé Rapport d information n 261( ). Murat, Michel Valorisation Des Déchets et Des Sous-Produits Industriels: Les Objectifs Scientifiques de Demain. Masson. Pérez-Esteban, Javier, Consuelo Escolástico, Ana Moliner, and Alberto Masaguer Chemical Speciation and Mobilization of Copper and Zinc in Naturally Contaminated Mine Soils with Citric and Tartaric Acids. Chemosphere 90 (2):
324 Effects of Parameters on the Extraction Yield of Acid Orange10 by Elm from an Aqueous Solution: Application of Plackett-Burman Design Farida Bendebane 1*, Lynda Bahloul 2, Hazem Meradi 2, Mohammed Saddek Lachgar 3, Abbes Boukhari 1, Fadhel Ismail 1,3 1 Laboratory LOMOP, Department of Chemistry University Badji-Mokhtar of Annaba, Annaba Algeria 2 Welding and NDT Research Center (CSC), BP 64 Cheraga - Algeria 3 Department of Process Engineering, University Badji-Mokhtar of Annaba, Annaba Algeria [email protected]; [email protected] Abstract The main objective of this study was to optimize the parameters that influence the extraction of a cationic dye acid orange 10 (C16H10N2Na2O7S2) from an aqueous solution (Pala, 2002), by an emulsified liquid membrane (ELM) consisting of Aliquat336 as the extractant, Span80 as the surfactant and cyclohexane as the diluents (Li, 1968; Li, 1971). The internal phase used was sulphuric acid. The extraction process parameters were studied using a statistical method of experimental Plackett-Burman design. Effects of parameters on the extraction yield were analyzed statistically and a mathematical model of the yield according to different parameters was developed, Main effects were studied and levels of all parameters correspondent to the best yield were determined. The concentration of span80 and the acidity of the internal, the composition and the proportion of the membrane were the most important factors for the extraction yield of AO10. Under optimized operator conditions deduced from main effects, a validation of the model was carried out; the extraction yields given by the polynomial models according to the coded and uncoded parameters and the extraction yields obtained experimentally, were very close comparatively. Keywords: Acid orange10, Design of experiments, Emulsified liquid membrane, Modeling, recovery. I. Introduction The water pollution is caused by the discharge of dyes from pickling, paper, pulp and dyes tuff industries, tanning, printing and textile eunit setc. (Rao, 1991). The treatment and disposal of dyes from contaminated waste waters is one of the most serious environmental problems engendered by the related industries. There are several methods for dyeremoval; biological treatment (Allegre, 2006; Pala, 2002; Kapdan, 2002) coagulation/flocculation (Allegre, 2006; Cooper, 1993), chemical oxidation and photocataly ticprocesses (Liu, 2006; Clark, 1994), adsorption (Gupta, 1997; Gupta, 2004) etc. Emulsion liquid membranes (ELM) are demonstrated to have significant potential as an effective tool for treatment of various industrial wastes since the irinvention (Li, 1968; Li, 1971). It is one of the potential lmethods for treatment of industrial waste water aiming recovery of various inorganic and organic solutes (Uddin, 2000; Brahmia, 2014). With the invention of the emulsion liquid membrane in late sixties, numerous mathematical models have been developed and applications of the semodels have been carried out. They were tested for extraction of various metalions, namely, silver (Lee, 1996), rare earth elements (Liu, 1997) chromium (Bhowal, 2001), cesium (El-Said, 2003), nickel (Chakraborty, 2003), zinc (Reis, 2004), arsenic (Huang, 2009), gold (Kargari, 2006) etc. The stability of the emulsified liquid membranes is very important and it must be optimized before their use. A good stability according to the composition of the membrane has being reported in some studies (Bechiri, 2008; Bahloul, 2013; Chiha, 2006; Djenouhat, 2008). Acid Orange 10 (C16H10N2Na2O7S2) is among the most of ten cationic dyes use din industries. The objective of this work wast or ecover this dye under optimal conditions using an extraction process by an emulsified liquid membrane. The method consisted to contact the aqueous phase to be treated with a wateroil emulsion (W/O) which was for medofan organic phase (membrane) and an internal aqueous solution. Before extraction, apreliminary study of the emulsified liquid membrane wases sential to deduce the favourable conditions for the emulsion stability. There covery of the membrane in order to another use wasal so important to study on carrying out a backextraction (desextration) of the dye. In this study an approach of design of experiment (DOE) (Phan-Tan- Luu, 2008; Dean, 1991) was applied to determine the parameters that have influence on the extraction of AO10 fromanaqueous solution. The DOE used was the fractional factorial design of Plackett-Burman (Plackett, 1946; Sado, 2000). The membrane was consisting of SPAN80 as the surfactant and Aliquat336 as the extractant. Statistical analysis of experimental results was studied an damodeling of the yield of extraction according to operating conditions was also achieved. 769
325 II. Experimental II.1. Materials and compounds AO10 (C16H10N2Na2O7S2) is an anionic dye supplied by Sigma Aldrich (Fig. 1). The emulsified liquid membrane used for the extraction of acidorange 10 consisted of SPAN80 (sorbitanmonooleate) as the surfactant, Aliquat336 as the extractant, cyclohexaneas the thin nerandsulfuricacid as the internalphase. The cyclohexane produced by Riedelde Haënwas use dasathinner, it was as table product underordinary conditions, its role was to improvemainly some physicochemical properties of the extractant and the surfactant. extractant, cyclohexane as the thinner andsorbitanmonooleate (SPAN80) as thesurfactant. This emulsifier was used to slightly acidic or alkaline and promoted an emulsion (W/O) with markedlipophilicity. The mixture was emulsified at 5000 rpm into a beaker tall form within 5 minutes. Then using a mechanical stirrer at150rpm, this emulsified membrane was dispersedinto a beaker containing 150mL of the solution to be treated. The ph variation of the external phase was monitore dusing a ph-metertype HANAHi8519N. The concentration of the residual complex AO10 at different reaction time sranging from 3 to15 minutes until equilibrium was determined by up taking samples of 2mL and measuring the absorption in tensity using a Jenway (6705UV/VIS) spectrophotometer. The optimal wave length was determined experimentally and was used in the same conditions. The samples were analyzed to determine the concentration of the residual complex AO10 from acalibration curve carried out a tordinary temperature. The extraction efficiency was calculated by Equation (1). Y(%) = [1 [(C fext V fext )/(C 0ext V 0ext )]]100 (1) Fig. 1: Acid orange 10 The trioctylmethylammoniumchloride (Aliquat336) (Fig. 2) was supplied by Sigma Aldrich. The sorbitan monooleate (SPAN80) (Fig.3) supplied by Sigma Aldrichisa nonionic surfactantty pester with lipophilic character (HLB =4.3), it was used for the stability of the emulsion. The homogenizer Ultra-TurraxT8 was a mechanical agitator type RW20 Junk&Kunkel, with a marine propeller; it was used to make the double emulsion W/O/W (water/oil/water). Fig. 2: Aliquat 336 where V0ext is the initial volume of the external phase, Vfext is the final volume of the external phase, C0ext is the initial concentration of AY99 in the external phase, Cfext is the final concentration of AY99 in the external phase and Y is the extraction yield. III. Results and discussions III.1. Experimental results The extraction of AO10 was conducted by varying eightfactors simultaneously listed in Tab. 1. The minimum and the maximum of level for each factor were chosen after a literature review and especially after performingpreliminary tests. Tab. 2 summarizes the different operating conditions of extractions using an emulsifiedliquid membrane according to a Plackett-Burmanexperimentsdesign.The experimental results of extraction yields are also presented. All the following statistical studies are based on these experimental data. Tab. 1: Parameters and levels Fig. 3: SPAN 80 II.2. Experimental procedures To extract the complex (C16H10N2Na2O7S2), the membrane was consisted of Aliquat 336 as the 770


326 Tab. 2 : Experimental results according to P-B Design III.2. Pareto chart The Pareto chart of effects is a useful field to identify the most important factors. It shows the estimated main plot against the horizontal effect. From Fig. 4, we can see that the most important factors in the decreasing order are the quantity of SPAN80, the acidity of the internal phase, the O/A ratio and the acidity of the external phase. The stirring velocity and the volume ratio Vex/Vem have a low effect. The extractant and the initial concentration of dye are the less important parameters. the other parameters. There are no interactions between the other parameters except for the couple [AO10]0 -[H2SO4] ext. Fig.5: Main Effects Plot of parameters for Y (%) III.5. Polynomial regression Fig.4: Pareto Chart of the Standardized Effects for Y (%) as response (Alpha = 0.05) III.3. Main effects The main effects plot is the most useful when there are several factors (Fig. 5). From level changes, we can deduce the influence of all factors on the extraction yield (Y). These effects may be positive or negative according to the slopes of the linear curves. From ANOVA (Analysiso variance), if the effect of a parameter is significant it is high probability (95%, 99%, or 99.9%) that the effect is "real" $ (Loukas, 2001; Lewis, 1999) P-value is a statistical parameter which indicates the importance of a parameter. The coefficients of the parameters presented in Tab. 3 were calculated from the Yates rating (Ruppert, 1988). The algebraic values of the coefficients measure the average change in extraction yield when the parameters change from level (-1) to level (1). III.4. Effects and interactions for Y (%) The achieved yields with the different interactions are presented in the Fig. 6. The emulsifier Span 80 does not present any interaction with the other parameters and its low concentration enhances the extraction yield. On the other hand, the extractant Aliquat336 and the stirring velocitypresent interactions with all parameters. Their optimal values must be determined according Fig. 6: Interaction plot of parameters for Y (%) 771
327 Tab. 3: Effects and coefficients of the estimated yield (codedunits). yield of about 100%. These conditions are summarized as below: - [H2SO4]int = 0.5 Mol/L in the internal phase - [ H2SO4]ext= 0.5 Mol/L in the external phase - Vext / V em = 3 - [AO10]0= 10 mg / L - Aliquat 336 = 6 % - Span80 = 6 % - Dilute cyclohexane = 88 % - Emulsification time = 5 min - O/A = 1 - Contact time = 10 min - Stirring Velocity = 150 rpm V. Conclusions To enable the prediction of response and system optimization, th method of experiment design on bothits design and structure allows a mathematical representation of the response (yield) according to all factors. The regressions are represented by polynomial equations 2 and 3 corresponding to the coded and uncoded parameters respectively. Y(%) = 91,846 3,162(Span80) + 0,541(Aliquat336) 1,386(SV) + 2,361 (H 2 SO 4 ) int 2,191 ( O Vex ) 1,379 ( ) 0,256(AO10) + A Vem 1,697(H 2 SO 4 ) ext (2) Y(%) = 111,043 1,58125(Span80) + 0,270417(Aliquat336) 0, (SV) + 11,8042(H 2 SO 4 ) int 1,46056 ( O Vex ) 0,91944 ( ) A Vem 0, (AO10) 0 + 8,48750(H 2 SO 4 ) ext (3) According to models deduced above, estimated yields were determined and compared to the experimental yields. Results were very close and this indicates that the model is veryrepresentative of the extraction process studied (Tab. 4). Tab. 4: Comparison between estimated and experimental yields The extraction of the anionic dye acid orange 10 (C16H10N2Na2O7S2) was the subject of this work. The study of an emulsified liquid membrane consisting of Span80 and aliquat336 as a surfactant and an extractantrespectivelyaccording to different important parameters showed that the stability of the emulsion W/O requires certainoperatingconditions. Using aplackett-burman design the extraction ofao10 (anionic dye) was carried out varying different operatorparameters simultaneously. Effects of parameters on the extraction yield were analyzed statistically and a mathematical model of the yield according to different parameters was developed. Main effects were studied and levels of all parameters correspondent to the best yield were determined. The concentration of Span80 and the acidity ofthe internal, the composition and the proportion of the membrane were the most important factors for the extraction yield of AO10. Under optimized operating conditions deduced from main effects a validati of the model was carried out; the extraction yields given by the polynomial models according to the coded and uncoded parameters and the extraction yields obtained experimentally was higher than 99.9%. It would be interesting to apply the membrane in a real wastewater and in a continuous system. With a regeneration of the membrane and its reuse according to the process outlined above. References A. Bhowal. S. Datta. Studies on transport mechanism of Cr(VI) extraction from an acidic solution using liquid surfactant membranes. J.Membr.Sci A. Kargari. T. Kaghazchi. B. Mardangahi. M.Soleimani. Experimental and modeling of selective separation of gold (III) ions from aqueous solutions by emulsion liquid membrane system. J.Membr.Sci III.7. Optimization of the model From main effects of the extraction yield. a primary optimized conditions can be deduced for an extraction 772 A. Pala. E. Tokat. Color removal from cotton textile industry wastewater in an activated sludge system with various additives. Water Res Bahloul L, Ismail F, Samar MEH. Extraction and
328 desextraction of a cationic dye using an emulsified liquid membrane in an aqueous solution. Energy Procedia 2013; 36: Bechiri O, Ismail F, Abbessi M, Samar MEH. Stability of the emulsion (W/O). Application to the extraction of a Dawson type heteropolyanion complex in aqueous solution. J Hazard Mater 2008; 152: BrahmiaN, Bouasla C, Ismail F, Samar MEH. Recovery of 4-chlorophenol from an aqueous solution by ELM pp. stability of the membrane, modeling, and optimization of the extraction using experimental designs. Des Water Treat 2014; 52: C.Allegre. P. Moulin. M.Maisseu. F. Charbit. Treatment and reuse of reactive dyeing effluents. J.Membr.Sci C.Huang, H. Fan, D. Zhou, A closed form solution for a mathematical model of emulsion liquid membranr, J.Membr, Sci. 339, 2009, C.S. Rao. Environmental Pollution Control Engineering. Wiley Eastern. India E.B. Dean, Taguchi approach to design optimization for quality and cost. Annual Conference of the International Society of Parametric, Analysts, G. Sado, M.C. Sado, Les plans d expériences, edition AFNOR. Paris, 2000, G.A. Lewis, D. Mathieu, R. Phan-Tan- Luu, Pharmaceutical experimental design. Ed. Marcel Dekker. Inc., New York, H-L. Liu. Y-R. Chiou. Optimaldecolorization efficiency of reactive red239 by UV/ZnOphotocatalytic process. J.Chin.Inst.Chem.Eng I.K. Kapdan. F. Kargi. Simultaneous biodegradation and adsorption of textile dyestuff in an activated sludge unit. Process Biochem L. Loukas, A Plackett-Burman screening design directs the efficient formulation of multicomponent DRV liposomes. J. Pharm. Biomed. Anal. 26, 2001, M. Djenouhat, O. Hamdaoui, M. Chiha, M.H. Samar, Ultrasonication-assisted preparation of water-in-oil emulsions and application to the removal of cationic dyes from water by emulsion liquid membrane - Part 1: Membrane stability, Sep. Purif. Techn. 62, 2008, M.Ruppert, J. Draxler and R.Marr, Liquid-membranepermeation and its experiences in pilot-plant and industrial scale, Sep. Sci. Technol. 23, 1988, M.Chakraborty. C.Bhattacharya. S. Datta. Effect of drop size distribution on mass transfer analysis of the extraction of nickel (II) by emulsion liquid membrane. Colloids Surf.A: physicochem. Eng. Aspects M.Chiha, M.E.H. Samar, O. Hamdaoui, Extraction of chromium (VI) from sulphuric aqueous solution by a liquid surfactant membrane (LSM), Desalination 194, 2006, M.S. Uddin. M.Kathiresan. Extraction of metal ions by emulsion liquid membrane using bi-functional surfactant: equilibrium and kinetic studies. Sep.Purif.Technol M.T.A. Reis. J.M.R. Carvalho. Modeling of zinc extraction fromsulphate solutions with bis(2-ethylhexyl) thiophosphoric acid by emulsion liquid membranes. J.Membrane.Sci N. El-Said. E. El-Sheref. E. Borai. Modeling of transport of Cs (137) by emulsion liquid membrane (18C6) in xylene promoted by ephedrine hydrochloride in stripping phase.j. Membr. Sci N.N.Li. Permeation through liquid surfactant membranes. AIChEJ N.N.Li. Separating hydrocarbons with liquid membranes. US patent P. Cooper. Removing colour from dye house waste waters a critical review of technology available. J. Soc.DyersColourists R. Phan-Tan-Luu, D. Mathieu, Planification d expérience en formulation: Criblage [Experimental Design in Formulation: Screening]. Techniques de l ingénieur. Paris, 2008, p. J J R.L. Plackett, J.P. Burman, The design of optimum multifactorial experiments. Biometrika 33, 1946, S.C. Lee. B.S. Ahn. W.K. Lee. Mathematical modeling of silver extraction by an emulsion liquid membrane process. J.Membr.Sci T. Clark. M.Bruce. S. Anderson. Decolorisation of extractionstage bleach plant effluent by combined hypochlorite oxidation andanaerobic treatment. Water Sci. Technol V.K. Gupta. S.K. Srivastava. D.Mohan. Equilibrium Uptake, Sorption Dynamics, Process Optimization, and Column Operations for the Removal and Recovery of Malachite Green from Wastewater Using Activated Carbon and Activated Slag. Ind.Eng.Chem.Res V.K. Gupta. Suhas. I.Ali. V.K. Saini. Removal of Rhodamine B, Fast Green, and Methylene Blue from Wastewater Using Red Mud, an Aluminum Industry Waste. Ind.Eng.Chem.Res X. Liu. X. Zhang. Simplified model for extraction of rareearth ions using emulsion liquid membrane. J.Membr.Sci
329 Effect of Biopolymer on the Properties of Oil-In-Water Microemulsions Nedjhioui Mohammed 1*, Moulai Mostefa Nadji 1, Tir Mohamed 1 1 Materials and Environmental Laboratory, University of Medea, Ain D Heb 26001, Algeria, * [email protected] Abstract The aim of this work is to investigate the effect of biopolymer addition on the formation of water-in-oil microemulsions. To this end, the effect of concentrations of anionic surfactant: (linear alkyl benzene sodium sulfonate: LABSNa), cosurfactant: Pentanol and water soluble polymer Polyvinylpyrolidone: PVP) on the phase behaviour of selected systems has been investigated. Results shows appearance of several domains when composition of each species in mixture is varied, these appearances in the phase diagram have been attributed to the formation of different Winsor systems. The effect of interactions of some selected systems is deduced from conductivity and rheology measurements. The results of the measurements showed an important effect on the conductivity and on the rheological properties of these systems. Key words: Phase diagrams, anionic surfactant, cosurfactant, biopolymer, conductivity. I. Introduction A considerable amount of immiscible oil and water solutions can be solubilized in the form of homogeneous, isotropic mixtures stabilised by surfactants, called microemulsions Mitra and Bidyut (2005). The microemulsions are transparent, thermodynamically stable dispersions colloidal of water in oil or oil in water droplets Prince, L. M. (1977). They are formed spontaneously and exhibit typical physicochemical properties, such as optical transparency, and low viscosity. The research and application of microemulsions has made a considerable progress because of their importance in various practical situations. In the last years, microemulsions have received increasing interest in several uses such as cosmetics, pharmaceutical formulations, as well as in food industries, as systems for drug encapsulations and allow solubility of high polar molecules. Polizelli and all, (2006), Bayrak, and Iscan (2005), Moulik, and Paul (1998). The field of existence of microemulsions is related to the nature of additives, also, to their concentrations in the formula. Winsor Winsor (1984) showed that these systems can present, at balance, four different states, bearing this name (WI, WII, WIII, and WIV). Recently, an interested in the incorporation of polymers in the formulation of microemulsions was developed in order to improve the rheological properties. The influence of solute and composition of the mixtures on the phase boundaries Testard and Zemb (2000), Wang and all (2000) and on the organization of surfactants in solution and at solid liquid interface have been well investigated Sahoo, L., J. Sarangi, and Misra, (2002), Sahoo and all (2002b), Misra, P.K., and P. Samosundaran (2004). Research on the combined effects between polymers and surfactants in microemulsions field can be done in two ways. In the first case, the polymer is considered to be influenced by the substance the surfactant, in the second case, the surfactant is considered to be influenced by the polymer substance. In the first case, the surfactant is adsorbed onto the polymer locations which prevent the formation of micelles. In the second case the association of the surfactant molecules with macromolecules facilitates the phenomenon of micellization. Merta and all (1999). A study of a biopolymer: the modified polyethylene glycol (PEG modified) and an anionic surfactant: sodium dodecyl sulfate (SDS), Salager and Andérez (1999), showed that for concentrations above the critical micelle concentration (cmc), the surfactant molecules attached to the modified polymer thus forming spherical micelles having the same size as the free micelles in solution. Research activities in the field of interactions between polymer, surfactant and electrolyte are classified according to the nature of the surfactant and polymer in several types Thomas and Farouqi (1992). There are: the ion / polymer interactions ionic surfactant (nonionic) (nonionic) / electrolyte and following the surfactant concentration, the mixtures were ranked by the value of the critical micelle concentration in three classes: surfactants complex polymers below, above the cmc Dickinson (1996). The study of the effects polymer nature on the water/surfactant /oil systems proves unimportant if it does not introduce the rheological parameters, in fact, the determination of the rheological properties of aqueous solutions containing a polymer, a surfactant and oil used to 774
330 identify the system and classified according to their use in formulations. The polymers are usually used in various applications to increase the viscosity of the solutions, for this reason they are known as thickening agents. It is therefore important to determine the influence of the polymer concentration of the surfactants in the aqueous solutions by measuring the rheological parameters of the systems according to the polymer concentration. The rheological study should provide a better understanding of the relationships between the properties of a material and its structure, and to deal with practical situations implementing this type of fluid Dickinson, E. (2001). Infield practice, the use of polymers with surfactants is of great importance. The polymer / surfactant systems have numerous industrial applications. In the field Agribusiness eg certain food emulsions (such as canned sauces), a low shelf life is often sufficient, while others (such as creams liqueurs) should remain stable for several years. Stability implies that no tendency to change structure is observed by the effect of physical or mechanical disturbances. Therefore, a food emulsion is stable if the number and organization of droplets change only slowly and over time imperceptible. The objective of the engineer in the food industry is to control the speed of the processes that are causing the instability of food colloids as creaming and / or coalescence Puvvada and Blankschtein (1990). To this end, several additives are recommended in the food industry, while trying to make a stable food colloid, among them the polymers are the most important. In the pharmaceutical field, where any drug product consists couple active ingredient/excipient, wherein the active ingredient must be in a usable form, or applicable manageable. This format is particularly important for products applied to the skin and mucous membranes. Formulators have raw materials more efficient for the production of forms adapted to strictly pharmacological parameters of the active ingredient, ie, allowing it to perform its role in the best conditions. This shaping will therefore depend on the nature and composition of the carrier Wesley, R. and T. Cosgrove (1999). Among the forms or pharmaceutical systems, emulsions, microemulsions, multiple emulsions and vesicular systems (liposomes) occupy a prominent place in their innovative performance. These systems are proving to be rich potentialities: chronoliberation, protection of sensitive and fragile molecules. The combined effects of surfactant / polymer such systems may increase their stability and / or improve its rheological characteristics. But the viscosity imparted is accompanied by a slowdown in the rate of diffusion of the active ingredient in the vehicle Jönsson and all (1999). For microemulsions, it is possible to modify their viscosities while maintaining their rheological characteristics by gelation. For example in the case of microemulsion/water can be used as gelling silicon oxide. But in microemulsions Oil Water may be used xanthan gum. This moderate increase in viscosity may allow better skin application, but will change the penetration options microemulsions. In the oil area, it is well known that the primary recovery phase during which allowed the oil flow, taking advantage of the only natural energy field only produces 5 to 15% of gross present in the deposit. The need to increase performance has imposed the development of new operating methods called "enhanced oil recovery or EOR" Koetz and all (1999), Le Yhuelic (1996) and Schübel and all (1996). II. Material and Methods II.1 Materials The anionic surfactant used in this work is the sodium dodecyl benzene sulfonate (LABSNa) for purities respectively of 90 and has been supplied by Fluka. In addition, and the hydrosoluble polymer selected is the polyvinyl pyrrolidone (PVP) is provided by Fluka. Thus, pentanol-1 is chosen as cosurfactant and is an alcohol widely used for various types of micellar formulations, it is supplied by Prolabo. The model oils used is the kerosene which is supplied by Naftal (Algeria). Nedjhioui and all (2005, 2007, 2009) II.2 Preparation of microemulsions The experimental study involves the determination of phase diagrams for different systems and to deduce the different domains of the microemulsion existence. Moreover this determination is implemented using the technique of grid that consists of scanning the plane of the phase representations by preparing a series of mixtures of different overall compositions in sealed tubes which are placed in thermodynamic conditions of work, and generate a point by point representation for different reconstructed areas at the equilibrium. II.3 Conductivimetric measurement The conductivities of solutions have been measured using a conductivity type LF 191 from WTW (Germany). III. Results and Discussion III.1. The ternary system water/surfactant/oil For solutions of selected concentrations, we determined the points that present different areas which are delineated, therefore the plots for ternary systems: water / LABSNa / Kerosen The use of kerosene, the phase behavior of this system is shown (in fig 1. This last shows the apparition of WIII. This can be of the tail of the molecule. 775
331 polymer PVP to our system leads the following conclusions: 1 - The obtained diagrams are depending on the amount of polymer introduced into the system. 2 - The change in the amount of polymer may interact with the constituents of our system and the phase diagram is modified. Fig.1: phase diagram of Water/LABSNa/Kerosen system The study of a ternary system water / surfactant /oil by the grid technique shows that it presents regions of different phases W IV, III W and WII. In the case of the studied systems, we can conclude that the diagrams show the same spaces with some changes as a result, the nature of surfactants and oil affect the phase behavior. III.2 Influence of a polymer addition This part is devoted to determine the nature of interactions between surfactant and polymer and highlight their influence on the phase behavior, thus hydro-soluble polymer: PVP is introduced and we determined the changes made by this polymer to the behavior of ternary systems. Fig.2and Fig.3 show the influence of PVP on the behavior of the system water / LABSNa / Kerosene where two concentrations of PVP were chosen i.e. 10 and 30%, it is noted that these concentrations are sufficient to vary the viscosity of the solution. The examination of these two diagrams shows that the introduction of a polymer changes the behavior of the system. In the case, we note that increasing the triphasic area WIII is located in the region that is rich in water with increasing content of PVP and a net decrease in two-phase zone W II as it is shown in these figures, it is evident that the monophasic area in these figures is substituted by a three-phase area; this appearance may be due to the introduction of the polymer that may interact with one of the components of our system, thus altering the studied diagrams. Fig.2: Phase diagram of water+10%pvp / LABSNa + Pentanol / Kerosene III.3. Conductivity measurements of systems The electrical conductivity measurement between the considered systems is prominent in the evaluation of electrostatic interactions existing in solutions; these electrostatic forces are highlighted as there are ionic substances in the solution i.e. ionic surfactant and charged polymers. III.4. Conductivity measurements of systems The electrical conductivity measurement between the considered systems is prominent in the evaluation of electrostatic interactions existing in solutions; these electrostatic forces are highlighted as there are ionic substances in the solution i.e. ionic surfactant and charged polymers. The obtained diagrams show that the same observations can be stated from Fig.2 and Fig.3, there is a change of triphasic region W III, the shorter is this area the higher is the percentage of PVP. Pseudoternary diagrams for these two figures show the existence of a two-phase region, where there is an area WI that is rich in oil and another area W II located in the aqueous phase. The introduction of a Fig.3: Phase diagram of water+30%pvp/labsna+pentanol/kerosene system 776
332 Conductivity measurements was used extensively to study the effect of charged polymer and surfactant on the phases diagram behavior, they are very significant for the evaluation of electrostatic interactions in solution, especially when they involve charged substances (ionic surfactant, charged polymers and electrolyte). This method was used by Goddard (1986) to investigate the effect of salt on the interaction between polymer (poly(ethylene oxide) and SDS, by Sovilj et al. (2006) to investigate the influence of hydroxypropylmethyl cellulose-sds interactions and by Nedjhioui et al.(2005, 2006, 2009) to study the interaction between xanthan gum and SDS. the specific conductivity of mixture containing the total sodium ΚNa + (the sum of free sodium and in SDS (C12H25SO4Na)), the free dodecyl sulphate ion C12H25SO4 - (DS - ), ΚDS -, free and the conductivity of charged polymer, XG, (ΚXG) and the conductivity of the nonionique compound (kerosene) is given in Eq. 1. Κ = Κ Na + + ΚDS - + ΚXG + K Kerosene (1) In the present context, only the total conductivity of mixture K is obtained from the conductivity measurements. Fig.4 shows the conductivity of the System Water / PVP / TA / Pentanol / Kerosene, and the examination of the conductivity curve in the case of the addition of charged polymer shows a decrease in conductivity against the increase in the concentration of PVP, there are also important initial values of the conductivity probably due to charges that are brought by the polymer. The introduction of kerosene in our system leads to a significant conductivity of the solution, this can be due to the same constitution of this hydrocarbon which can have charged compounds and therefore there is higher electrostatic force in our system. Otherwise this variation may also be resulting of the variation of polymer concentration and above all the dominating factor is the decreasing of electrostatic repulsion (polar heads) IV. Conclusions In this study, we set the main objectives of observation, analysis and interpretations of the different fields of existence of microemulsions and the changes made by certain additives (cosurfactant and polymer).to this end, we are interested to establish diagrams of ternary and pseudoternary phases using a grid technique. The results obtained show that they are in good agreement with previous work and show the existence of monophasic and triphasic areas more or less extensive depending on the nature of surface oil and also according the nature and concentration of the polymers. The obtained plots of the phase diagram have allowed drawing the following conclusions: The obtained areas are influenced in each case by the surfactant concentration and the oil. The results show the effect of co-surfactant on the phase behavior.the addition of a polymer also affects the changes made diagrams. Indeed: diagrams obtained show the existence of an interaction between the polymer and the added components of the studies systems, these interactions are confirmed by the conductivity of the curves giving the systems according to the nature and concentration of the polymer. Finally, the study on the phases diagrams gives a good approach to equilibrium between phases, but this approach is not sufficient if there is no means of analysis (microscopy, physic-chemical methods) and characterization of microemulsions. References Bayrak, Y. and M. Iscan (2005). J. Colloids Surf. A 268: Bourrel, M., C. Chambu (1982). Remarques sur les mécanismes de la solubilisation par les amphphiles, C.R. Acad. Sc. Paris, Série II, no.501, Dickinson, E. (1996). Les colloïdes alimentaires. Ed. Masson, Paris. Dickinson, E. (2001). Milk protein interfacial layers and the relationship to emulsion. stability and rheology, Colloids Surf. B: 20, 3, Fig.4: Influence of PVP concentrations on electrical conductivity of Water+PVP /LABSNa +Pentanol/ Kerosene system Goddard,E.D. (1986). Polymer/Surfactant interaction, Part I. Uncharged water-soluble polymers and charged surfactants, Colloids and surfaces, 19:
333 Harrison, I.M., F. Candau, R. Zana, (1999). Interactions between polyampholytes and ionic surfactants. Colloid Polymer Science, 277 : Jönsson, B., B. Lindmann, K. Holmberg, and B. Kronberg (1999). Surfactants and Polymers in Aqueous Solution, Ed. John Willey and Sons. Koetz, J. T. Beitz, and B. Tiersch (1999). Self assembled polymer-surfactant systems. J. Dispersion Sci. Technol : Le Yhuelic,D. (1996). Plastiques composites et élastomères dans les industries agro-alimentaires. Ed. CETIM. France. Merta, J., P. Stenius, and E. Perttinen (1999). Interactions between cationic starch and anionic surfactants: III. Rheology and structure of the complex phase. J. Dispersion Sci. Technol : Mitra, R.K., P. Bidyut (2005). Colloid Interface Sci. 291: Moulik, S.P. and B.K. Paul (1998). Adv. Colloid Interface Sci. 78: 98. Misra, P.K., and P. Samosundaran (2004). Organisation of amphiphiles. Part IV: A comparative study of the orientation of polyoxyethylated alkyl phenols at air-water and silica-water interface. J. Surfactants deterg. 7:373 Moulai-Mostefa N., Khalladi R., Nedjhioui, M. (2007), An investigation into the interactions between a polymer and a surfactant using viscosity, conductivity and surface tension measurements. Ann. Chim. Sci. Mat., 32: Nedjhioui, M., N. Moulai Mostefa, A. Bensmaili, and A.Morsli (2005). Combined effects of polymer/ surfactant/oil/alkali on physical chemical properties, Desalination 185: Nedjhioui, M., J.P.Canselier, N.Moulai Mostefa, A.Bensmaili, and A.Skender, (2007). Determination of micellar system behavior in the presence of salt and water soluble polymer using the phase diagram technique, Desalination, 206: Nedjhioui, M., J.P.Canselier, N. Moulai Mostefa and A. Bensmaili (2009). Investigation of combined effects of Xanthan gum, sodium dodecyl sulphate and salt on some physico-chemical properties of their mixtures using a response surface method. J.Disp. Sci. and Tec,30: Prince, L. M. (1977). Microemulsions: theory and practice, Academic Press, New York, Polizelli, M. A. V.R.N. Tellis, L.Q. Amral, E. Feitosa (2006). Colloids Surf. A 281: Puvvada, S. and D. Blankschtein (1990). Molecularthermodynamic approach to predict micellization, phase behavior and phase separation of micellar solutions. I. Application to nonionic surfactants, J. Chem. Phys.92: Reed, R.L. and R.N. Healy (1977). Some physicochemical aspects of microemulsion flooding: A review, Improved Oil recovery by Surfactant and Polymer Flooding, Ed. Academic Press, New York. Sahoo, L., J. Sarangi, and Misra, P.K (2002b). Organization of amphiphiles. Part 1: Evidence in favour of premicellar aggregates through fluorescence spectroscopy. Bull. Chem. Soc., 75(3):859. Sahoo, L., P.K. Misra, and P. Samosundaran (2002b). Indian. J. Chem., 41A: Salager, J.L. and J.M. Andérez (1999). Influence de la formulation sur les mousses. L actualité chimique. Schübel, D., O-D. Bedford, G.Ilgenfritz, and R.K.Eastoe Heenan (1996). Oligo-and polyethylene glycol in Water-in-Oil microemulsions, J. Phys. Chem. Vol.l, Seiller, M. (1999). Formes pharmaceutiques pour application locale, Ed. Lavoisier, Paris. Sovilj, V.J., L.B. Petrovic (2006). Influence of hydroxypropylmethyl cellulose-sodium dodecylsulfate interaction on the solution conductivity and viscosity and emulsion stability, Carbohydrate polymers, 64: Testard, F. and Th. Zemb (2000). Langmuir, 16 (2): 232. Thomas S., and S. M. Farouqi (1992). Micellarpolymer flooding: statutes and recent Advances, J. Canadian Pet. Technol. vol. 31 : 8. Wang., Ke. G. Oradd, M.Almgren, T.Asakowa, and B. Bergensthal (2000). Langmuir 16 (3) 1042 Wesley, R. and T. Cosgrove (1999). Interactions of polymers with surfactants. Langmuir, 5: 376, Winsor, P. (1984). Trans. Faraday society, 44:
334 Taguchi Optimization Approach for Methyl Orange Removal from Aqueous Solution Using Electrochemical Process Mohamed Tir *, Mohamed Nedjhioui Laboratory of Materials and Environmental (LME), Faculty of Science and Technology, University of Yahia Fares, Ain D' Heb, Medea- Algeria. * [email protected] Abstract The present work stadies the removal of Methyl orange (MO) from aqueous solution by electrocoagulation process. Taguchi method was applied to determine the optimum MO removal from aqueous solution by electrocoagulation using iron electrodes. An orthogonal array L16 (4 5 ) experimental design that allows to investigate the simultaneous variations of five parameters (applied current, initial ph of the solution electrolyte concentration, reaction time and electrode type) having four levels was employed to evaluate the effects of experimental parameters. Analysis of variance (ANOVA) was used to determine the most significant parameters affecting the MO removal efficiency. The optimum conditions were found as the four level of applied current intensity (0.8A), third level of ph (7), fourth level of electrolyte concentration (2gl -1 ), fourth level of reaction time (25min) and first level of electrode type (iron). Under these conditions, MO removal efficiency was predicted as 98,4% that was within the range of confidence limit of the observed value of 97,5%. Keywords: Methyl orange, removal efficiency, electrocoagulation, Taguchi method, Anova, optimization. I. Introduction Environmental pollution by colored substances has become one of the main problems facing developing countries like Algeria. Many synthetic dyes are commonly used in textile, pharmaceutical, paint, plastic and other industries. The textile industries discharge large volumes of dye effluents which constitute a significant category of environmental pollutants (Torrades and García-Montano, 2014). Some of these dyes are toxic and causes a serious threat to environment. Azo dyes are most widely used for natural and synthetic fiber dyeing and printing. Azo dyes, which contain at least one azo group (-N=N-) attached to substituted benzene or naphthalene rings, are the commonly used commercial dyes in the textile industries (Gutowska et al., 2007). Azo dyes are toxic to aquatic microorganisms, carcinogenic and mutagenic to humans (Ramirez et al, 2013). The degradation of these dye molecules in the environment by microorganisms is slow (Lakshmi et al., 2009). Furthermore, degradation of azo dyes produces smaller molecules such as amines that are also considered to be toxic. Therefore, it is necessary to find an effective method for wastewater treatment that is capable of removing color and toxic organic compounds from textile effluents (Chen, 2004, Rajkumar and Palanivelu. 2004). It is interesting to note that electrocoagulation is an effective method to degrade organic pollutants under the action of an external electric field. Electrocoagulation (EC), using iron or aluminum electrodes, has been effectively tested in the treatment of a variety of dye effluents (Martinez-Huitle et al, 2009, and Daneshvar et al, 2006). This technique is very attractive from an economical point of view since the equipment is easy to install and operate, it reduces the production of sludge, it does not use chemical products as coagulant agents. Electrocoagulation process involves three stages; coagulant formation through dissolution of metal ions of anode reactor electrode, destabilization of pollutants, suspended particles and de-emulsification, and aggregation of instable phases and floc-forming (Hyun Kim et al. 2002, Drouiche, et al, 2007). The mechanism of iron oxidation during electrocoagulation is shown below (Chou et al, 2009, Ben Hariz et al, 2013): At the anode 2 Fe Fe e Fe ( s) ( aq) 2 2 ( aq) 2OH( aq) Fe( OH) 2( s) At the cathode H O 2e H 2 2 ( l) 2( g) 2OH( aq) Overall: Fe H O ( s) 2 2 ( l) Fe( OH) 2( s) H 2( g ) The hydroxide flocks act as adsorbents and traps for organics and metal ions and so eliminate them from the solution. Simultaneously, the hydroxyl ions which are produced at the cathode increase the ph in the electrolyte and may induce coprecipitation of sulfide. This acts synergistically to remove pollutants from water with the Fe(OH)2 or Fe(OH)3 precipitate. 779
335 The removal of dye from aqueous solution by EC is affected by several parameters such as current density, initial dye concentration, initial ph, supporting electrolyte concentration, space between the electrodes, applied voltage, electrodes type etc. These parameters need to be optimized for attaining maximum dye removal. The experiments are, generally, conducted in such a manner so to optimize one factor at a time. This method overlooks the interactive affects of various factors on the EC process. Fractional factorial design based on Taguchi s orthogonal array can be a very effective methodology to investigate the effects of multiple factors as well as potential interactions between these factors in a time and cost effective manner (Taguchi, 1986). In order to attain the maximum removal efficiency of dyes, an optimization strategy is required to find the best experimental conditions. Recently, Statistical experimental designs described as design of experiments (DOE) can be used to investigate the effect of all the possible combinations of the conditions. In this context, the Taguchi method as a statistical technique is used to determine the optimum conditions. Moreover, the use of Taguchi method is to minimize the experimental runs by fractional factorial designs based on robust orthogonal arrays (OA) of factors. In this study, the electrochemical removal of methyl orange (MO) was investigated and a statistical experimental design method was used. In order to optimize the process variables, Taguchi method has been adopted and applied successfully in the present work to select the most influential parameters and their effect on removal efficiency. Five parameters namely, applied current, initial ph of the solution, Electrolyte concentration; reaction time and Electrodes type have been selected and varied in four different levels. Other parameters, such as, MO concentration, electrode gap, voltage supplied, agitation speed and temperature were kept fixed at levels decided based on our experience. II. Experimental II.1 Materials A sock solution of 1000 mg/l of methyl orange dye (MO,C14H14N3NaO3S, molecule weight g/ mol) was prepared by dissolving the appropriate amount of dye with distilled water. Aqueous solutions with different concentration of MO (5 200 mg/l) were prepared by successive dilution of the stock solution with water. The MO concentrations were determined using an absorbance at 464 nm of the solutions after getting the UV spectra of the solution with a spectrophotometer (Shimadzu UV spectrophotometer, UV-1240). The calibration curve was obtained from the spectra of the standard solutions (5 50 mg/l) at a specific ph (usually 5.8).The characteristic schematic structure is shown 780 in fig.1. The percentage of color removal efficiency (%RE) was calculated as follows: C RE(%) 1 C e 100 (1) Where, C 0 is the initial MO concentration (mg/l), C e is the final MO concentration (mg/l). Fig.1. Chemical structure of methyl orange (MO) II.2 Experimental method 0 The Electrocoagulation experimental apparatus consists of an electrolytic cell which was a Plexiglas reactor containing two iron electrodes plates were connected to a digital DC power supply (0-30V, 2.5 A) in monopolar mode. An ampermeter and voltmeter were used to measure the current passing through the circuit and the applied potential respectively. The electrodes were situated vertically in the cell and the gap between the electrodes is 10 mm. The volume of MO solution treated was 400 cm 3 and the total effective electrode area was 35 cm 2. Experiments were conducted at initial MO concentration of 50 mg/l. The ph and conductivity were adjusted to a desirable value using NaOH or HCl and NaCl respectively. After the each experiment of electrocoagulation, the iron electrodes were rinsed in the diluted HCl solution. II.3 Taguchi design experiments Taguchi method is a multi-parameter optimization procedure, which is very useful in identifying and optimizing dominant process parameters with a minimum number of experiments (Taguchi, 1986). This technique is based on an orthogonal array of experiments and includes data transformation into an accurate and desirable signal-to-noise (S/N) ratio (Zolgharnein et al, 2014). An orthogonal array is a minimal set of experiments with various combinations of parameter levels. The selection of a suitable orthogonal array depends on the number of control factors and their levels (Beril Gönder et al, 2010). In data analysis, signal-to-noise (S/N) ratios are used to calculate the response. There are three types of performance characteristics used for analyzing S/N: lower the better, larger the better and nominal the better. The larger S/N ratio corresponds to better performance characteristic. The use of ANOVA (analysis of variance) is to find out the percentage contributions of individual parameters. In this work, the variables chosen for this investigation are applied current (U1), initial ph of the solution (U2), Electrolyte concentration (U3), reaction time (U4) and Electrodes type (U5).The variables investigated and their levels were summarized in
336 Table 1. Tab.1. Parameters and their values corresponding to their levels studied in experiments. Factors Levels (U 1) Applied current, A (U 2) Initial ph (U 3) Electrolyte concentration, g.l (U 4) Reaction time, min (U 5) Electrodes type : Fe/Fe, Al/Al Fe/St, Al/St, Anode/Cathode (A) (B) (C) (D) St: stainless steel To analyze the significance of five factors at four different levels, a full factorial design require 4 5 (= 1024) experiments to find the influencing parameter while Taguchi design involves only nine experiments using an OA L9(3 2 ). Experimental plan table according to L16 (2 4 ) is shown in Table 2. Tab. 2. Experimental variables and results of conducted experiments corresponding to L16 experimental plan EXP Variables and their levels N U 1 U 2 U 3 U 4 U 5 RE, % S/N 1 0, (A) , (B) , (C) , (D) , (D) , (C) , (B) , (A) , (B) , (A) , (D) , (C) , (C) , (D) , (A) , (B) This ability is one of the advantages of the Taguchi method over the conventional experimental design methods. The variability is expressed by signal-to-noise ratio (S/N). For S/N analysis, an appropriate function must be chosen as the smaller-the-better, the larger-the-better, and the nominal-the better (Tan et al., 2005). In Taguchi method, the optimum conditions should be determined using the S/N ratio of the results obtained from experiments designed by orthogonal array technique. For optimization of color removal fficiency (RE,%), larger-the-better type of objective function has been used. In this case the exact relation between S/N ratio and the signal is given by Eq. (2). n 1 1 S/NL 10 log (2) 2 n i 1 Yi Where n is the number of repetition performed for an experimental combination and Yi is the removal efficiency (RE) of the ith experiment. III. Results and discussion III.1. Taguchi design analysis In this study, Taguchi method was used to identify the optimal conditions and to select the parameters having the most principle influence on the MO dye removal. Standard L16 OA table with four levels and five factors is shown in Table 2. Each row in the table represents a trial condition with the level of factors. Table 2 shows the removal efficiency (RE) and S/N ratio for decolorization of the solution containing MO calculated using equation (1) and (2) respectively. In order to evaluate the influence of each factor on the removal efficiency (RE), the S/N ratio for each factor should be computed. The S/N ratio averages for each factor at four levels are presented in Fig. 2. The effects of five parameters at four levels (applied current, initial ph, electrolyte concentration, reaction time and electrodes type) were investigated using the Taguchi approach. Sixteen trials were performed and evaluated in terms of MO removal percentage, which is represented by the S/N values listed in Table 2. Tab. 3. S/N ratio response. Level U 1 U 2 U 3 U 4 U Delta Rank The hierarchical order of significant factors that affects the MO removal efficiency are as follows: U4 (reaction time), U1 (Applied current), U3 (electrolyte concentration), U2 (initial ph) and U5 (electrode type) as shown in Table 3. According to the analysis, while the reaction time is the most effective parameter in the decolorization of methyl orange by EC process. Fig. 1 also shows the effect of the nature of the electrodes on the removal efficiency, four types of electrodes are used in this study such as: iron, aluminum and stainless steel. The highest MO removal efficiency is achieved with iron electrodes. Considering the highest value of the S/N ratio as the optimum, the optimum combination of conditions was determined to be (U1)4, (U2)3, (U3)3, (U4)4 and (U5)1. In other words, based on the S/N ratio, the optimal factors for MO dye removal are (Applied current) at level 4 (0.8 A), (initial ph) at level 3 (7), (electrolyte concentration) at level 4 (2g/l), (reaction time) at level 4 (25 min) and (electrode type) at level 1 (iron). Under these conditions of process variables optimized by Taguchi method, the predicted removal efficiency was estimated to be 98,4% is in good agreement with the value observed is 97,5%. The experimental variables, their levels and results of conducted experiments are given in Table
, initial ph (U2), electrolyte concentration (U3) and reaction time (U4) exhibits much variation which indicates that these are the factors having a major affect on")
337 Fig. 1 shows the graphical representation of the effect of different parameters on S/N ratio for effective MO removal. Therefore, the applied current (U1), initial ph (U2), electrolyte concentration (U3) and reaction time (U4) exhibits much variation which indicates that these are the factors having a major affect on the MO removal efficiency (RE). The influence of the interaction between applied current and reaction time with coded levels on the MO removal efficiency at initial ph 7, electrolyte concentration 2g.l -1 and iron electrodes is shown in the response contour plot of Fig. 3. As can be seen, the MO removal efficiency rises from about 70% to a maximum value of 98 % near to 0.8 A and 25min of reaction time, which can be taken as the optimum conditions for the removal efficiency of MO by EC. Fig. 3. Contour plots of MO removal efficiency showing the effect of current density and reaction time for EC treatment of MO concentration 50 mg/l, ph = On the other hand, the predicted values were compared with the experimental values and are shown in Fig 4. The predicted values are closer with experimental values for all runs. Also, the R 2 and adjusted R 2 values are 0,946 and 0,92 respectively. This confirms that good agreement between the predicted and the observed values in all cases.
338 RE (%) Predicted R 2 = RE (%) Observed Fig.4. Observed response versus predicted response for the EC of methyl orange dye Tab. 4. Results of ANOVA for MO removal efficiency Factor Degree of Freedom Sum of Squares Mean Squares Percent, %, P (DOF) (SS) (MS) Model A B C D E Error total III.2. ANOVA analysis In order to conduct an analysis of the relative importance of each factor more systematically, an analysis of variance (ANOVA) was applied to the data. The main objective of ANOVA is to extract from the results how much variations each factor causes relative to the total variation observed in the result (Daneshvar et al, 2007). Analysis of variance results for the Taguchi experimental design including the number of degrees of freedom (DOF), sum of squares (SS), Mean squares (variance), and contribution percentage (P) for the EC experiments are summarized in Table 4. Using ANOVA results, the reaction time and the applied current are the significant parameters that affect the removal efficiency. In contrast, initial ph, electrolyte concentration and electrode type were not significant at risk levels of 0.05 or It can be observed from the Table 4 that, experimental degree of freedom (DOF) is 15; while factors-dof is 3.The percentage contribution was calculated for each individual factor by the ratio of sum of squares to the total sum of the squares (Eq.3). The analyzed data showed that of all the parameters examined, reaction time had the maximum contribution (59.82%), at the individual level, followed by applied current (22.85%), electrolyte concentration (6.42%), ph (5.68%) and electrode type (5.19%). 783 SS P(%) 100 SS T IV. Conclusion (3) In this study, Taguchi design of experiment (L16) has been used to determine the optimum conditions for the MO dye removal from aqueous solutions by electrocoagulation. Effect of applied current, initial ph of the solution, electrolyte concentration, reaction time and electrode type on the electrocoagulation of MO has been investigated and effects of these parameters on the system performance have been evaluated based on removal efficiency. In addition, an orthogonal Taguchi L16(4 5 ) array is demonstrated to identify the significance of the experimental parameters. The larger-the-better S/N ratio was used to analyze the results of experiments. According to the obtained results, the reaction time is the most significant factor on the MO removal efficiency, and it contributes 59,82%. The second most significant factor is the applied current and its contribution percent to the decolorization efficiency is 22,85%. The results also indicate that utilization of the Taguchi method gives a suitable approach for optimization MO removal percentage by EC process. The optimal conditions for MO removal were found as the four level of applied current intensity (0.8A), third level of ph (7), fourth level of electrolyte concentration, fourth level of reaction time (25min) and first level of electrode type (iron). Under the optimized conditions 97,5% of RE was obtained. The predicted and observed MO removal efficiency values are close to each other with a high coefficient of determination value (R 2 ) of 0,946. This confirms that good agreement between the predicted and the observed values. References Ben Hariz I., Halleb A., Adhoum N., Monser L., Treatment of petroleum refinery sulfidic spent caustic wastes by electrocoagulation, Separation and Purification Technology, 107, , (2013). Beril Gönder Z., Kaya Y., Vergili I., Barlas H., Optimization of filtration conditions for CIP wastewater treatment by nanofiltration process using Taguchi approach, Separation and Purification Technology 70, , (2010). Chen G., Electrochemical Technologies in Wastewater Treatment. Separation and Purification Technology, 38, 11, (2004). Chou W L., Wang C T., Huang K Y., Effect of operating parameters on indium (III) ion removal by iron electrocoagulation and evaluation of specific energy consumption, Journal of Hazardous Materials (2009).
339 Daneshvar N., Oladegaragoze A., Djafarzadeh N, Decolorization of basic dye solutions by electrocoagulation: an investigation of the effect of operational parameters, Journal of Hazardous Materials, , (2006). Daneshvar N., Khataee A.R., Rasoulifard M.H., Pourhassan M., Biodegradation of dye solution containing Malachite Green: Optimization of effective parameters using Taguchi method, Journal of Hazardous Materials 143 (2007) Drouiche N., Ghaffour N., Lounici H., Mameri M., Electrocoagulation of chemical mechanical polishing wastewater, Desalination , (2007). Gutowska A., Czaplinska J., Jozwiak W., Degradation mechanism of reactive Orange 113 dye by H2O2/Fe 2+ and ozone in aqueous solution. Dyes and Pigments 74, 41-46, (2007). Hyun Kim T, et al., Decolorization of disperses and reactive dyes by continuous electrocoagulation process, Desalination 150, , (2002). Lakshmi U.R., Mall I.D., Srivastava V.C., Latye D.H., Rice husk ash as an effective adsorbent: Evaluation of adsorptive characteristics for Indigo Carmine dye, Journal of Environmental Management 90, , (2009). Martinez-Huitle C. A., Brillas E., Decontamination of wastewaters containing synthetic organic dyes by electrochemical methods: a general review, Applied Catalysis B: Environmental 87, , (2009). Rajkumar. D, Palanivelu. K, Electrochemical Treatment of Organic Wastewater, Journal of Hazardous Materials, 113, 123, (2004). Taguchi G., Introduction to Quality Engineering: Designing Quality into Products and Processes, Asian Productivity Organization, Tokyo, Tan O., Zaimoglu A.S., Hinislioglu S., Altun S., Taguchi approach for optimization of the bleeding on cement-based grouts. Tunneling and Underground Space Technology 20, (2005). Torrades F., García-Montano J., Using central composite experimental design to optimize the degradation of real dye wastewater by Fenton and photofenton reactions. Dyes and Pigments 100, , (2014). Zolgharnein J., Asanjrani N., Bagtash M., Azimi G., Multi-response optimization using Taguchi design and principle component analysis for removing binary mixture of alizarin red and alizarin yellow from aqueous solution by nano c-alumina, Spectrochimica Acta Part A: Molecular and Biomolecular Spectroscopy 126, , (2014). 784
340 Multilayer Perceptron Model for Predicting Acute Toxicity of Fungicides on Rats: Validation and Domain of Application Hamadache Mabrouk 1*, Benkortbi Othmane 1, Hanini Salah 1, Amrane Abdeltif 2 1 Université de Médéa, Faculté des sciences et de la technologie, Département du génie des procédés et environnement, Laboratoire des Biomatériaux et Phénomènes de Transport (LBMPT), 26000, Algérie. 2 Ecole Nationale Supérieure de Chimie de Rennes, Université de Rennes 1, CNRS, UMR 6226, 11 allée de Beaulieu, CS 50837, Rennes Cedex 7, France. * [email protected] Abstract Quantitative Structure Activity Relationship (QSAR) models are expected to play an important role in the risk assessment of chemicals on humans and the environment. In this study, we developed a validated QSAR model to predict acute oral toxicity of 91 fungicides to rats because a few QSAR models have been devoted to predict the Lethal Dose 50 (LD 50) of fungicides on rats. This QSAR model is based on 10 molecular descriptors, and is robust, externally predictive and characterized by a good applicability domain. The best results were obtained with a 10/11/1 Artificial Neural Network model trained with the Levenberg-Marquardt algorithm. The prediction accuracy for the external validation set was estimated by the Q 2 ext which is equal to Furthermore 98.9% of training and external validation sets is correctly predicted and the present model proved to be superior to models previously published. Accordingly, the model developed in this study provides excellent predictions and can be used to predict the acute oral toxicity of fungicides, particularly for those that have not been tested as well as new fungicides. Keywords: Acute toxicity, fungicides, QSAR, prediction, external validation. I. Introduction Large amounts of pesticides are applied worldwide. In this regard, pesticides are of paramount importance since they allow controlling insect or fungal infestations or growth of weeds, either to anticipate long-lasting problems (Regueiro et al., 2015). Among them, fungicides are used widely in grain crops such as wheat, rice, beans, and peanuts as well as food protection and for the production of crops of suitable quality and quantity (Costaa et al., 2015). More than 3600 fungicides have been globally registered (Li et al., 2016). Numerous monitoring studies throughout the world have demonstrated the potential of fungicides to contaminate environment. The consequences of this pollution are the widespread presence of residues in air, surface and ground waters, soil and foodstuffs (Regueiro et al., 2015; Fernandez et al., 2015; Kaushik et al., 2009; Papadakis et al., 2015; Nagel et al., 2014) In addition, they also pose a threat to the environment, humans, animals and other organisms. Fungicides may pose risk to human health and wildlife. Several studies have showed a connection between some chronic diseases and currently used fungicides. Recent studies suggest that exposure to certain agrochemicals, including fungicides such maneb and mancozeb, may be involved in the development of neurodegenerative disorders such as Parkinson's disease (Regueiro et al., 2015). In humans, it is suggested that the exposure to some pesticides, including fungicides, decreased sperm concentration and deregulated menstrual cycles (Costaa et al., 2015). Particular fungicides have been linked with oxidative stress and mitochondrial dysfunction (Nagel et al., 2014). Despite the likely ecological risks, fungicides have received relatively little attention in comparison with other types of pesticides, such as insecticides and herbicides [Wightwick et al., 2012]. More attention should be paid to risk of the fungicides to human health. It is evident that risk assessment for fungicides can provide a precaution against the corresponding pollution. One of the procedures currently used for human and environmental risk assessment is the determination of the acute toxicity of fungicides (Lagunin et al., 2007). Unfortunately, experimental determination of the toxicity takes time, requires a high expense and poses an ethical problem (demands to reduce or abolish the use of animals). The use of in silico predictive methods, based on computer tools, offers a rapid, cost-effective and ethical alternative to testing toxicity of chemical substances in animals (Sullivan et al., 2014). These methods include the Quantitative Structure Activity Relationship (QSARs) models. To establish a QSAR model, three elements are necessary. The first relates to the biological activity (eg toxicity) measured for a set of molecules. The second concerns the descriptors. Finally, the third must be a statistical learning method that is used to connect the first two elements. 785
341 Thus, this study aims to develop a QSAR model that could be used to predict oral acute (LD 50) toxicity of a diverse set of 91 fungicides on rats. The QSAR model established by using artificial neural networks and molecular descriptors satisfies the guidelines required by the Organisation for Economic Cooperation and Development (OECD). The basic requirements to develop a QSAR model were respected. The first work is to use fungicides with toxicity data with high quality obtained under the same experimental conditions (i.e., the same protocol). Selection of nonredundant and non-correlated descriptors is the second requirement. Third, the statistical tool used to derive the QSAR can be in some cases a source of mistakes and hence the commercial software Statistica was used. Finally, the model is evaluated both in terms of her robustness as well as in terms of her prediction performances and its applicability domain (AD). II. Materials and methods The methodology adopted for this research is illustrated in Figure 1. As seen in Figure 1, the process of QSAR model development can be generally divided into three steps: data preparation, data analysis and model validation. Acquiring a good quality QSAR model depends on many factors, such as the quality of biological data, the choice of descriptors, variable selection, statistical methods and validation (Aptula et al., 2005; He and Jurs, 2005). oral exposure) values were retrieved from Pesticide Properties Database [PPDB]. The LD 50 correspond to the concentration (mg/kg) of pesticide that lead to the death of 50% of rat. All values of oral acute toxicity were converted into mmol/kg. A total of 91 fungicides with experimental data were selected to form the final database. The basis of 91 fungicides was divided into 2 lots. The first with 75 fungicides was dedicated to develop the QSAR model. The second which included 16 fungicides that had not been used for the development of the QSAR model, was left for the external validation. II.2. Molecular descriptors One important step in obtaining a QSAR model is the numerical representation of the structural features of molecules, which were named molecular descriptors. Nowadays, there are more than 4000 of molecular descriptors which can be used to solve different problems in Chemistry, Biology and related sciences [Speck-Planche et al., 2012]. In the specific case of this study, for each molecule, 1664 molecular descriptors were calculated, which belong to many classes. All descriptors were obtained through the online program E-Dragon 1.0 (http: // org/lab/e-dragon). To avoid the phenomenon of overfitting, the number of descriptors must be reduced. Several methods to simplify a database are used. The method used to select the most significant descriptors was described previously [Hamadache et al., 2014]. For relevant descriptors selection, stepwise regression was then used [Xu and Zhang, 2001]. Finally, the number of descriptors selected to develop the model was 10: T(O...O), RDF020e, RDF030e, RDF080e, Mor15m, Mor26u, Mor16u, nhdon, C-008, TPSA (Tot). Fig. 1: Steps of QSAR development II.1. Rat LD50 data It is well known that high-quality experimental data are essential for the development of high quality QSAR models. If they are unreliable, the model will be unreliable. The rat lethal dose 50 (LD 50 - rat, male via 786 II.3. Model development In this work, all calculations were run on a Sony personal computer with a Core (TM) i3 and windows XP as operating system. The Artificial Neural Networks (ANN) which has extensive applicability in solving non-linear systems was employed to build the QSAR model between the molecular relevant descriptors and the toxicity of fungicides. A three-layer feed-forward neural network utilizing backpropagation algorithm was employed. The typical back-propagation network consists of an input layer, an output layer and at least one hidden layer. Each layer contains neurons and each neuron is a simple micro-processing unit which receives and combines signals from many neurons. The use of a neuronal regression goes through the choice of the input parameters but also by optimizing the architecture of the neural network itself. The optimization of both the distribution of the database, the number of hidden layers, the number of neurons per hidden layer, the transfer functions as well as algorithms was carried after extensive testing. The design of the neural model is to evaluate the
342 components of the network according to the desired performance modeling. Model performance is evaluated in terms of root mean square error (RMS). II.4. Model validation For the validation of the predictive power of a QSAR model, two basic principles (internal validation and external validation) are available. Recent studies (Wang et al., 2009) have indicated that the internal validation is considered to be necessary for model validation. In the present study, we took the leaveone-out (LOO) cross-validation (CV) for the internal validation to evaluate the internal predictive ability of the developed model, and its result was defined as Q2LOO, which could be calculated according to the following equation [Wang et al., 2009]: 2 = 1 i=1 (y i Q LOO training exp yi pred ) 2 training exp (y i y ) 2 i=1 (1) where y exp i, y pred i and y are the experimental, predicted, and average LD 50 values of the samples for the training set, respectively. A value of Q 2 LOO > 0.5 is considered satisfactory, and a Q 2 LOO value > 0.9 is excellent (Eriksson et al., 2003). Furthermore, the external validation is a significant and necessary validation method used to determine both the generalizability and the true predictive ability of the QSAR models for new compounds, by splitting the available dataset into a training set and an external prediction set. As mentioned above, the whole dataset in this work has been randomly divided into a training set with 75 compounds for model development, and a prediction set with 16 compounds for model external validation. The external predictive ability of the developed models on the external prediction set was evaluated by Q 2 ext, which could be calculated as follows (Wang et al., 2009): The AD is a theoretical region in the space defined by the descriptors of the model and the modeled response, for which a given QSAR should make reliable predictions. This region is defined by the nature of the compounds in the training set, and can be characterized in various ways. In our work, the AD was verified by the leverage approach (h). The leverage "h" is calculated with the software XLSTAT. III. Results and discussion III.1. QSAR modeling The main objective of this phase of the study is to find the optimal architecture of the neural network to predict the acute oral toxicity of fungicides on rats. A typical multilayer perceptron (MLP) three-layered network with an input layer, a hidden layer and an output layer is adopted in this work. Before training the network, the number of nodes in the hidden layer was optimized, because it is an important parameter influencing the performances of the ANN model. Thus, a { } network architecture was obtained after trial and error procedure. The main performance parameters of MLP-ANN model are shown in Table 1. Tab. 1: Performance of MLP-ANN model for fungicides Statistical Training set Validation set Parameters n R Q 2 LOO Q 2 ext Figure 2 shows the regression line of the model equation, i.e. predicted vs experimental results for the training and validation set highlighted by different symbols. 2 = 1 i=1 (y i Q ext prediction exp yi pred ) 2 prediction exp (y ytr i ) 2 i=1 (2) where y exp i,y pred i are the experimental and predicted LD 50 values of the samples for the prediction set, and y tr is the mean experimental LD 50 values of the samples for the training set. II.5. Applicability domain Even the most comprehensive and validated models cannot predict reliably properties for all existing compounds. The QSAR model is not intended to be used outside its domain of applicability, that is to say, outside of the chemical space covered by the training set. Also, the applicability domain (AD) of models must be defined and the predictions of the molecules in this area can be considered admissible. The determination of AD is therefore of great importance [OECD]. Fig. 2: Correlation between the predicted and the observed LD 50 for the training and validation set. Fig.2 indicates that there is a significant correlation between experimental values and predicted values of LD 50. As can be seen from Table 1, the non-linear MLP-ANN model give good results with higher correlation coefficients (R 2 and R 2 ext ), as well as better robustness (Q 2 ) in both training set and validation set, which indicated that the MLP-ANN not 787

343 only performed well in model development, but also had excellent prediction. This fact suggested a nonlinear correlation between the acute toxicity and the relevant descriptors. To see the importance of each descriptor for the prediction of LD 50 oral toxicity of fungicides towards rats, the relative contributions [Zheng et al., 2006] of the ten descriptors to the MLP-ANN model were determined and are plotted in Figure 3. The contribution of the descriptors decreased in the order: Mor16u > nhdon > Mor15m > Mor26u > RDF030e > RDF020e > RDF080e > C-008 > TPSA (Tot) > T (O,,O). Fig. 4: Projection of the training set and the validation set in the Williams plot. IV. Conclusions Fig. 3: Diagram of the contribution of the descriptors. III.2. Applicability domain The applicability domain of the model was analysed using a Williams plot (Figure 4), where the vertical line is the critical leverage value (h*), and the horizontal lines are 3s the cut off value for Y space. As seen in Figure 4, one observe a single fungicides compounds in the training set that has a leverage higher than the warning h* value of In the Williams plot, one fungicide can be considered as response outlier (in the Y-response space). In the validation set, one fungicide (Hexachlorophène) was underestimated, while another fungicide was overestimated underestimated. The one response outlier (in the Y-response space) could be associated with errors in the experimental values. It should be noted that 93.75% of the domain was covered by the model when it was applied to predict the acute oral toxicity of the 16 fungicides in the validation set. Thus, these results show that MLP- ANN model complies with the third principle of the OECD. Accordingly, the model developed in this study provides excellent predictions for 91 fungicides. It can be used to predict the acute oral toxicity of fungicides, particularly for those that have not been tested as well as new fungicides. The aim of the present work was to develop a QSAR study and to predict the oral acute toxicity of fungicides to rats. This study involved 71 fungicides with an additional external set of 16 pesticides modelled for their oral acute toxicity on rat based on the artificial neural network (multi-layer perceptron: MLP-ANN) with descriptors calculated by Dragon software and selected by a stepwise MLR method. The ten selected descriptors showed that the electronic properties and the structure of the molecule play a main role in the toxicity activity of the fungicides. The built MLP-ANN model was assessed comprehensively (internal and external validations). It showed good values of Q 2 LOO = 0.91 for the training set and high predictive Q 2 ext values (0.96) for the validation set. All the validations indicate that the built QSAR model was robust and satisfactory. The proposed QSAR model provided 97.8% predictions that belong to the applicability domain. In conclusion, the model developed in this study meets all of the OECD principles for QSAR validation and can be used to predict the acute oral toxicity of fungicides, particularly for those that have not been tested as well as new fungicides and thus help reduce the number of animals used for experimental purposes. References Aptula, A.O., Jeliazkova, N.G., Schultz, T.W., Cronin, M.T.D., QSAR & Combinatorial science, 24, (2005). Costa N.O., Vieira M.L., Sgarioni V., Pereira M.R.F., Montagnini B.G., Paccola Mesquita S.F., Ceccatto Gerardina D.C., Evaluation of the reproductive toxicity of fungicide propiconazole in male rats, Toxicology, 335, (2015). Eriksson L., Jaworska J., Worth A.P., Cronin M.T., McDowell R.M., Gramatica P., Methods for reliability and uncertainty assessment and for applicability evaluations of classification and regression-based 788
344 QSARs, Environmental Health Perspectives, 111, (2003). Fernández D., Voss K., Bundschuh M., Zubrod J.P., Schäfer R.B., Effects of fungicides on decomposer communities and litter decomposition in vineyard streams, Science of the Total Environment, 533, (2015). Hamadache M., Khaouane L., Benkortbi O., Si Moussa C., Hanini S., Amrane A., Prediction of Acute Herbicide Toxicity in Rats from Quantitative Structure Activity Relationship Modeling, Environmental Engineering Science, 31, (2014). He, L., Jurs, P.C., Journal of Molecular Graphics and Modelling, 23, (2005). Kaushik G., Satya S., Naik S.N., Food processing a tool to pesticide residue dissipation a review, Food Research International, 42, (2009). Lagunin A.A., Zakharov A.V., Filimonov D.A., Poroikov V.V., A new approach to QSAR modelling of acute toxicity, SAR and QSAR in Environmental Research, 18, (2007). Li D., Liu M., Yang Y., Shi H., Zhou J., He D., Strong lethality and teratogenicity of strobilurins on Xenopus tropicalis embryos: Basing on ten agricultural fungicides, Environmental Pollution, 208, (2016). Nagel D.A., Hill E.J., O Neil J., Mireur A., Coleman M.D., The effects of the fungicides fenhexamid and myclobutanil on SH-SY5Y and U-251 MG human cell lines, environmental toxicology and pharmacology, 38, (2014). OECD principles for the Validation for Regulatory Purposes of (Quantitative) Structure-Activity Relationship Models, (2009). Papadakis E.N., Vryzas Z., Kotopoulou A., Kintzikoglou K., Makris K.C., Papadopoulou- Mourkidou E., A pesticide monitoring survey in rivers and lakes of northern Greece and its human and ecotoxicological risk assessment, Ecotoxicology and Environmental Safety, 116, 1 9 (2015). PPDB (Pesticide Properties DataBase), sitem.herts.ac.uk/aeru/footprint/ (accessed 14/01/2016). Regueiro J., Olguín N., Simal-Gándara J., Suñol C., Toxicity evaluation of new agricultural fungicides in primary cultured cortical neurons, Environmental Research 140, (2015). Speck-Planche A., Kleandrova V.V., Luan F., Cordeiro M.N.D.S., Predicting multiple ecotoxicological profiles in agrochemical fungicides: A multi-species chemoinformatic approach, Ecotoxicology and 789 Environmental Safety, 80, (2012). Sullivan K.M., Manuppello J.R., Willett C.E., Building on a solid foundation: SAR and QSAR as a fundamental strategy to reduce animal testing, SAR and QSAR in Environmental Research, 25, (2014). Sun C., Cang T., Wang Z., Wang X., Yu R., Wang Q., Zhao X., Degradation of three fungicides following application on strawberry and a risk assessment of their toxicity under greenhouse conditions, Environmental Monitoring and Assessment 187: 303 (2015). Wang R., Jiang J., Pan Y., Cao H., Cui Yi., Prediction of impact sensitivity of nitro energetic compounds by neural network based on electrotopological-state indices, Journal of Hazardous Materials, 166, (2009). Wightwick A.M., Bui A.D., Zhang P., Rose G., Allinson M., Myers J.H., Reichman S.M., Menzies N.W., Pettigrove V., Allinson G., Environmental fate of fungicides in surface waters of a horticulturalproduction catchment in southeastern Australia, Archives of Environmental Contamination and Toxicology, 62, (2012). Xu L., W. Zhang J., Comparison of different methods for variable selection, Analytica Chimica Acta, 446, (2001). Zheng F., Bayram E., Sumithran S.P., Ayers J.T., Zhan C.G., Schmitt J.D., Dwoskin L.P., Crooks P.A., QSAR modeling of mono- and bis-quaternary ammonium salts that act as antagonists at neuronal nicotinic acetylcholine receptors mediating dopamine release, Bioorganic & Medicinal Chemistry, 14, (2006). Zhou J., Zhang J., Li F., Liu J., Triazole fungicide tebuconazole disrupts human placental trophoblast cell functions, Journal of Hazardous Materials, 308, (2016). Graftieaux L., Michard M., Grosjean N., Combining PIV, POD and vortex identification algorithms for the study of unsteady turbulent swirling flows, Measurements and Science Technology, (2001). Guerrouache M.S., Étude numérique de l instabilité de Bénard-Kármán derrière un cylindre fixe ou en mouvement périodique, Dynamique de l écoulement et advection chaotique, Ph.D. Thesis, Université de Nantes (2000). Natarajan N.M., Lakshmanan S.M., Laminar flow in rectangular ducts: prediction of velocity profiles and friction factor, Indian Journal of Technology, (1972). Sahin M., Owens R.G., A numerical investigation of
345 wall effects up to high blockage ratios on twodimensional flow past a confined circular cylinder. Physics of Fluids 16, (2004). Williamson C.H.K., Defining a universal and continuous Strouhal-Reynolds number relationship for the laminar vortex shedding of a circular cylinder at low Reynolds number, Phys. Fluids, 31, (1989). Yang Y., Shehata A., Modi V., West A. C., Mass transfer to a channel wall downstream of a cylinder, Int. J. Heat Mass Trans., 40, (1997). 790


346 Thermoeconomic and Enviroeconomic analysis of ISCCS in Algeria Tarik Boushaki 1, Pr. Kacem Mansouri 1 1 Faculté des Sciences de l Ingénieur, Laboratoire Energétique, Mécanique et Ingénieries, Université M hamad Bougara, Boumerdes, Algeria * [email protected] Abstract This work is a thermoeconomic and environmental analysis of an Integrated Solar Combined Cycle System (ISCCS) located in the Algerian SAHARA. The environmental aspect is treated by the evaluation of CO2 quantities emitted by the power station and the estimate of the gains in terms of costs relating to the reduction of the emitted CO2. A comparison is made with a conventional combined cycle with different values of carbon tax and fuel costs. Keywords: Integrate solar combined cycle; emission CO2; thermoeconomic; enviroeconomic. I. Introduction The limited reserves of fossil fuels and their negative effect on the environment, requires their replacement by renewable resources. The ISCCS present the most effective and economic system to convert thermal solar energy into electricity. The solar field integrated into a conventional combined cycle makes it possible to reduce the fossil fuel consumption during the periods of sunning. Positive impact on the environment results by the reduction of pollutant gas emission, and more particularly, the consequent reduction of CO2 emission which increase the return on the investment of the solar field. Algeria's renewable energy potential is strongly dominated by the sun. Potential wind energy, biomass and geothermal energy, are much smaller, while the hydroelectric potential is very low. Algeria solar potential is among the highest in the world estimated at TWh/y (Fig.1). However, electricity production in Algeria is based 98% on fossil fuels (Fig. 2). The solar/gas hybrid power plants are an effective way for a gradual transition to electricity production from solar energy. This study is a thermoeconomic and environmental performance analyze of the first ISCCS based in Hassi R'Mel in the Algerian Sahara with high estimated annual radiation of 2,300 kwh/y/m 2. Thermoeconomic analysis includes a comparison of ISCCS with a conventional combined cycle (CC) under the same operating conditions. The conventional combined cycle power plant considered has the same characteristics and performance as the combined cycle of ISCCS. Fig.1: Technical Potential for concentrating Solar Power Fig. 2: Electrical production techniques in Algeria for 2014 II. System description The ISCCS power plant is located in the industrial park of HASSI R' MEL, Algeria (latitude and longitude ). The plant represented in Fig. 1 consists of a solar field of parabolic-trough mirrors type Eurothrough ET-150 and a combined power cycle of two gas turbines MS6001C and one steam turbine SST-600. The system also contains two heat recovery steam generators (HRSG) with two pressure lines, an overheating of vapor and an aerocondenser. 791
347 III. Thermoeconomic model III.1. Thermodynamic model In the thermodynamic model of combined cycle Cooke (1985) and Ray (1980), the variation of efficiency and pressure losses of gas flow are considered. A standard composition of dry air is considered (CIPM-2007). The plant uses natural gas of Hassi R'Mel as fuel, an average composition of constituents of this gas is considered in the model. The specific heats of air, fuel and exhaust gas are formulated as function of temperature by polynomials. For water and steam, the thermodynamic properties according to the temperature and the pressure are given by XSteam of Matlab by mathworks (2013). Some technical data of the combined cycle are presented in Table 1. Tab.1: Technical data of power block plant (ISO) Gas turbine MS6001C Power output 45.4 MW Air flow rate 122 Kg/s Compression ratio 19.6 Compressor Isentropic Efficiency 0.90 % Turbine Isentropic Efficiency 0.89% Exhaust gas temperature 581 C Steam turbine SST-600 Power output up to 150 MW Live steam inlet pressure 165 bar Steam flow rate 80 Kg/s Controlled extractions (up to 2) Live steam inlet temperature 565 C Turbine outlet pressure bar The solar field formed by a set of Eurothrough-150 parabolic trough (table 2) has a reception total area of m2. For calculations, we consider the weather profile of the METEONORM database Fig.3: Schematic diagram of Hassi R Mel ISCCS 792 (version 7). A TMY data set used contains hourly values for the DNI, ambient temperature, pressure and relative humidity and wind speed for one complete year. The performed solar field model allows us to calculate the useful heat absorbed by the HTF. The model takes into account optical losses of the collector and the heat collector element (HCE), thermal losses of HCE, shadow losses and the losses of pipes carrying the HTF by Duffie (2006) and Padilla (2011). The heat absorbed by the absorber is given by: Φ abs θ. K..... Φ Φ DNI. A. cos col n loss pip (1) The heat flow lost by the absorber according to the temperature of the HTF is obtained by Price model with the following relation [34]: Φ loss A A T 2 3 T0 A2 THTF A3 THTF 2. K. T V. A A T HTF A DNI. cos T HTF w 5 6 HTF 0 (6) V w is wind speed (m/s) and the coefficients values Ai are given in Padilla (2011). Thermal losses from the piping leading to and from the loops in the solar field are given by the following empirical equation as Burkholder (2009): Φ pip T T T (7) T [ C] is the difference between the average field temperature and the ambient air temperature.
348 Tab.2: Geometrical and optical characteristics of EuroTrough ET150 Focal Length (m) 1.71 Absorber Radius (cm) 3.5 Aperture Width (m) 5.77 Aperture Area (m²) Collector Length (m) Number of Modules per Drive 12 Number of Absorber Tubes (4.1 m) 36 Peak optical efficiency 0.75 Mirror reflectivity Tracking error Geometry error Dirt on mirrors HCE Shadowing HCE absorptivity Glass transmissivity Dirt on HCE III.2. Economic model For economic viability, the Levelized Electricity Cost (LCOE) with a simple financial calculation method given by, International Energy Agency (1991). The LCE of energy technologies is based on the energy resource (F an), capital (I tot), carbone tax and operating (OM an) annual costs. The capital recovery factor fcr is a function of the real interest rate (k) and depreciation period (n) considered as 10 % and 25 years respectively. LCOE fcr. I tot OM n k. 1 k n 1 k 1 an F an Carbone Decommissioning E an (8) fcr (9) Main parameters used in LCOE calculation are presented in table 3. Cost investment values refer to year 2007 and are the real values of costs installation are presented. Power plant performances are calculated under on design contidions (P=0.93 bar, T= 35 C, relative humidity= 60% and DNI= 850 W/m² refer to 21 june at no one). Tab.3: Parameter for some of the Hassi R Mel ISCCS and considered combined cycle Plant type ISCCS CC Nominal power MWe Gas turbine power MWe Steam turbine power MWe Solar field power MWe 32 0 Plant efficiency % Solar field size m Annual Solar share % Investment Cost gas turbine steam turbine solar field HTF electric equipment auxiliaries taxes land civil Total O & M Cost Average fuel III. Simulation and results The figure 2 shows the DNI evolution for four different days (METEONORM Data), the DNI reaches high values of the order of 950 W/m². Note that during hours ranging from 09:00h to 16:00h (standard time), a DNI value higher of 700 W/m 2 is reached. The solar radiation received is about 7925 Wh/m 2 /day corresponding to 2890 kwh/m 2 /yr (figure 3). The thermal efficiency of collector almost reached a maximum value of 65% with an annual average of 50% mar 21 jun 21 sep 21 dec 700 DNI W/m² Standard time (h) Fig.4: Hourly DNI evolution (HassiR Mel) 793
 by eia.gov (2016).")
349 10 x Heat rate HTF Heat rate DNI 7 Heat rate W Number day of year Fig.5: Daily heat rate of DNI and absorbed by HTF For the year 2007, the natural gas cost was estimated at $ 7 / MMBtu ( / MMBtu) by eia.gov (2016). The LCOE was calculated for ISCCS and the CC for each hour of all days of year without carbon taxes, then with different values of the carbon tax, and finally for different values of fuel cost. In referring to year 2007 (the beginning of the installation work), and without considering the carbon tax, we obtain for the ISCCS a LCOE value equal to / kwh quite small compared with the LCOE value of a solar power plant (around 0.06 / kwh). However, the LCOE value of ISCCS is greater than that obtained for the LCOE of considered conventional combined cycle ( / kwh) (figure 6). By introducing different carbon taxes following: Fuel cost 2 = 2.92 / MMBtu (year 2009); Fuel cost 3 = 5.12 / MMBtu; (year 2007); Fuel cost 4 = 6.13 / MMBtu; (year 2008); Figure 7 shows an almost linear evolution of LCOE depending on fuel prices. The differences between the different values of LCOE remain almost constant for different fuel costs. Tax1 = 7 / ton CO2; Tax2 = 22 / ton CO2; tax3 = 56 / ton CO2; tax4 = 100 / ton CO2; This gives a lowering of LCOE of ISCCS proportional to carbon tax value (figure 6). A carbon tax of 100 /tonco2 (tax 4, ISCCS4) allows reduced by 15% the cost of electricity produced by ISCCS ( 0.02 / kwh) and therefore greater than the LCOE of combined cycle which is equal to / kwh. Fig.6: LCOE for different configurations & different Carbon taxes. Considering the following different fuel costs: Fuel cost 1 = 1.90 / MMBtu (year 2015); 794 Fig.7: LCOE for different configurations & different Fuel costs. IV. Conclusion The ISCCS is the most effective system to convert solar thermal energy into electrical energy. The electricity cost is cheaper than that of a solar thermal plant, but still higher than the cost of electricity produced by a conventional combined cycle despite the use of a very high carbon tax ( 100 / tonco2). It is also noted that the electricity cost of ISCCS and conventional combined cycle evolves practically in the same manner versus fuel cost. In this case, the low value of annual solar share (6%) can greatly reduce the price of electricity produced, but against Parties, the cost of electricity is practically insensitive to the carbon tax. Currently solar CSP Investment prices are lower, but remain higher than conventional power plants. The tax carbon reduced the gap, but does not provide a
350 competitive price of electricity produced by an ISCCS. Government policy could increase the growth of this sector by downgrades of fillers or by sustained electricity prices. References Cooke D. H., On Prediction of Off Design Multistage Turbine Pressure by Stodola's Ellipse, Journal of Engineering for Gas Turbines and Power, vol. 107, no. 3, pp , Ray Asok, Dynamic Modelling of Power Plant Turbines for Controller Design, Applied Mathematical Modelling, Vol. 4, pp , (1980). ge/9817, last accessed 18 December Duffie J. A., Beckman W. A., Solar engineering of thermal processes, third ed., New York, John Wiley and Sons, Inc Forristall R., Heat Transfer Analysis and Modeling of a Parabolic Trough Solar Receiver Implemented in Engineering Equation Solver, National Renewable Energy Laboratory Padilla R. V., Demirkaya G., Goswami D. Y., Stefanakos E., Rahman M. M., Heat transfer analysis of parabolic trough solar receiver, Appl. Energy vol.88, pp (2011). Burkholder F., Kutscher C., Heat Loss Testing of Schott's 2008 PTR70 Parabolic Trough Receiver, Technical Report NREL/TP May 2009 International Energy Agency (IEA). Guidelines for the economic analysis of renewable energy technology applications, last accessed 03 February
351 Effect of Pb Content and Heat Treatment on Thermoelectric Properties of AgPb18+xSbTe20 alloys Sheng-Long Lee *, Jo-Kuang Nieh, Yu-Chih Tzeng Department of Mechanical Engineering, National Central University, Jhongli, Taiwan * [email protected] Abstract AgPb18+X SbTe20 (x=0, 2, 4) were fabricated by the combination process of melting and hot pressing methods. The influences of Pb content and heat treatment on the thermoelectric performance, including electrical conductivity and Seebeck coefficient, were investigated in this work. For all of samples, the electrical conductivity and the Seebeck coefficient exhibited the typical n-type semiconductor behavior in the temperature ranges from room temperature to 427. Higher Pb content increases electrical conductivity, but mobility decreases at highest Pb content (x=4). Furthermore, after heat treatment for as-cast alloys at 800 for 10 hours, the sintered sample show better mobility, which resulted in higher power factor in all temperatures compared to non heat treatment ones. According to the results, for AgPb20SbTe20 and AgPb22SbTe20 which were hot pressed after heat treatment, has maximum power factor about W/mK 2 at 427. Keywords: Thermoelectrics, melting, heat treatment. I. Introduction Thermoelectric materials are thermal and electrical conversional media.to obtain excellent thermoelectric conversion efficiency to be combined with a high power factor with low thermal conductance. PbTe thermoelectric materials have high melting point, excellent chemical stability, high carrier concentration and low thermal conductivity, etc. It has been widely used in the middle temperature range of the thermoelectric material, ZT value of up to 0.8. by Hsu (1999) prepared by melting doped Ag, Sb of PbTe, expressed as AgPbmSbTem+2, also known as the LAST-m. When m = 18, to obtain the highest power factor of Wm -1 K -2 at 427 ; maximum of ZT value 2.1 occurs at 527. In this study, combined melting and hot sintering, to obtain the optimal composition of thermoelectric properties of AgPb18 + xsbte20 (x = 0, 2, 4) alloy.then, high temperature heat treatment in an attempt to change the distribution of precipitates and nanopatterns. Investigate the effect of Pb content and heat treatment on the microstructure and thermoelectric properties (carrier characteristics, conductivity, Seebeck coefficient). II. Experimental facility The pure Ag (99.99%), Pb (99.999%), Sb (99.99%) and Te (99.999%) according to the stoichiometry were filled in quartz tube. The tube to be sealed until evacuated and heated to 970 holding 8 hours and in the meantime to flip four times to increase homogeneity, then furnace cooled to room temperature. Alloy milled into powder after using 200 mesh sieve sieved (<75μm). The heat treatment conditions were set to maintain temperature of 800 x 10 hours, followed by air cooling to room temperature. The crystal structure is detected by the BRUKER Company D8AXRD. After the stainless steel alloy powder by a mortar to 200 mesh (<75 μm) mesh sieve, then the X-ray diffraction analysis. X-ray source of CuKα (λ = nm), the operating conditions of voltage 40 kv, current 40 ma, the diffraction angle ranging from 20 to 80, scanning speed of 0.05 deg/sec. After grinding, the analysis with an optical microscope (Olympus, BX60M) observed microstructure, and electronic micro-finders (EPMA, JEOL- JXA-8500F) for different phases polished alloy composition. The sintered block material ground and cutted into (10 * 10 * 1 mm) and (2* 2 * 12 mm) test pieces. These specimens were carrier characteristics, conductivity (σ) and the Seebeck coefficient (α) of measurement and use the formula to calculate the power factor. Conductivity and Seebeck coefficient of the thermoelectric performance by ULVAC Company detecting device (ZEM-3) measured. III. Results and discussions III.1. X -ray diffraction analysis and carrier characteristics Analysis of the crystal structure of the as-cast alloy as shown in Fig.1, the diffraction peaks concide the PbTe JCPDS structure by X- ray diffraction instrument. In AgPb22SbTe20 Pb can be observed diffraction peaks, show X-ray diffraction instrument detects excessive unreacted Pb alloy in the presence of elemental state. X-ray diffraction analysis of the sintered alloy also 796
352 listed in Fig.1 the main crystal are similar with AgPb22SbTe20 diffraction peaks. AgPb18SbTe20, AgPb20SbTe20 and AgPb22SbTe20 hot pressured material (as Pb18, Pb20 and Pb22 respectively) under room temperature carrier concentration (Carrier Concentration), mobility (Mobility) and relative density were shown as Table.1, all the alloys relative density are up to 96%. As the proportion of Pb (up from Pb18 to Pb22), carrier concentration increased from cm cm -3, upgrade approximately 247 times, the display will affect the content of Pb carrier concentration, this phenomenon discovery by Zhou (2008) etc. From X-ray diffraction analysis (Fig.1), AgPb22SbTe20, Pb can be detected, display containing an excessive amount of Pb, which are not involved in recombination reactions of Pb can supply electronic, thus increasing the carrier concentration this phenomenon is reflected in the performance of conductivity. Fig.1. X-ray diffraction patterns of all alloys. Table.1Carrier concentration, mobility and relative density of sintered sample at room temperature. Alloys Carrier Concentration Mobility Relative (cm -3 ) (cm 2 /V s) Density Pb % Pb % Pb % Pb20HT % Pb22HT % Fig.2 Temperature dependence of electrical conductivity Pb18 highest conductivity of only S/cm, Pb20 to S/cm, while Pb22 to S/cm. In addition, the observed changes Pb20 and Pb22 conductivity can be found, as the temperature increases, Pb20 more moderate upward trend, while Pb22 increased sharply after 277. The cast microstructure of Pb18, Pb20 and Pb22 were as shown in Fig.3 (a), (b) and (c). In fact, exist eutectic phase (indicated by arrow a). EPMA base composition analysis results Table.2 shown between three alloys base (PbTe) of Pb and Te content is not much difference. However, in PbTe theoretical phase diagram composition (61.9 wt compared to % Pb wt.% Te), three base alloy composition are biased pure Pb, should be added Ag, Sb of influence. PbTe added Ag, Sb quaternary alloy is formed, with the presence of a variety of temperature and composition range has been unable to complete the use of Pb - Te binary phase diagram shows, binary phase diagram is therefore presumed intermediary metal compound (PbTe) or eutectic point of the composition will change, resulting in three base Pb alloy content compared with the theoretical high value (that is composed of more biased in the direction of pure Pb). III.2. Conductivity The conductivity of Pb18, Pb20 and Pb22 from room temperature to 427 as shown in Fig.2, the electric conductivity of the three alloys at room temperature (27 ) are less than 20 S/cm, and as the temperature rises, except Pb18, the Pb20 and Pb22 show a significantly increased, showing the transmission properties of semiconductors. Fig.3 Morphologies of as-cast alloys. (a) AgPb18SbTe20, (b) AgPb20SbTe20, (c) AgPb22SbTe
353 Table.2 Composition of matrix of as-cast alloys (wt.%). Alloys Ag Pb Sb Te Total AgPb18SbTe AgPb20SbTe AgPb22SbTe III.3. Conductivity Fig.4 show the relationship between the Seebeck coefficient and temperature. After three alloys are higher than 100, Seebeck coefficient presents a negative value, the n-type semiconductor. It is worth mentioning that this study found that the test piece Pb18 slight twist of circumstances after the measurement is completed, may be measured when the interface of the Te-rich phase due to the instability in the heating process. In addition, the interface analysis to Ag and Sb content than the base, there may be within the eutectic phase complex undergoes a phase change due to the second phase. To further clarify its impact, when measured Seebeck coefficient, will return after the end of the room temperature (27 ) measured again, with a start value at room temperature compared to observe whether there is a significant deviation. At room temperature before and after the two measured values can be found, Pb18 gap of μv/k, is much larger than the other two alloys μv/k and μv/k, display specimen deformation has caused the amount of error measured. Moreover, Seebeck coefficient is affected by carrier concentration, while reducing the carrier concentration, Seebeck coefficient increases by Rowe (2006). The Table.1 shows that the lowest concentration Pb18 carrier, and should have the highest Seebeck coefficient value, but its value began to decline after 177, after 377 lower than the higher carrier concentration of Pb20 and Pb22, this phenomenon should specimen deformation due to the thermal process. III.4. Power factor ZT value by a formula (= α2σt / κ) shows that increasing the power factor (Power factor = α2σ) preliminary basis and reduce the thermal conductance (κ) Jieke enhance the thermoelectric performance, and therefore the power factor can be used as a judgment of the merits of thermoelectric conversion performance, to apply to the relevant material means, the power factor (W/mK 2 ) must reach 10-3 of magnitude, this study used as criteria by Kosuga (2005). The use of conductivity (σ) and Seebeck coefficient (α) obtained Power factor at each temperature point performance as shown in Fig.5. Fig. 5: The use of conductivity (σ) and Seebeck coefficient (α) obtained Power factor at each temperature point Pb18 to the highest value is only W / mk 2, Pb and reached the magnitude at about 300, then as the temperature increased to W/mK 2, while Pb22 maximum rose to W/mK 2. Pb20HT Pb22HT power factor and there are further performance. At 427 when, Pb20HT the power factor of W/mK 2, representing about 32% Pb20 upgrade, while Pb22HT although not significantly increased as compared with Pb22, but the performance overview of each temperature point, Pb20HT and Pb22HT are respectively compared with those without heat treatment at a lower temperature (227 and 177 ) of 10-3 order of magnitude of the standard, and the overall temperature range of power factor both by improved. IV.Conclusions In this study, combined the hot-pressing sintering and melting to produce AgPb18 + xsbte20 (x = 0, 2, 4) alloys, investigate the effect of Pb content and heat treatment on microstructure and thermoelectric properties, the analysis results are as follows: 1. AgPb18+xSbTe20 (x = 0, 2, 4) crystal structure are all major PbTe, and analysis showed trace Ag, Sb make intermetallic compound (PbTe) biased direction pure Pb (ie PbxTey (x > y)). Which can be detected AgPb18SbTe20, Te-rich eutectic phase, while AgPb22SbTe20 by X-ray diffraction analysis can to Pb diffraction peaks. 2. Cast AgPb18+xSbTe20 (x = 0, 2, 4) analysis thermoelectric material properties by block after the hot pressing results are as follows: (1)All alloy hot briquetting material relative density are up to 96%, and belong to the behavior of n-type semiconductors. (2)Pb content increases can enhance carrier concentration, but AgPb22SbTe20 highest Pb content of its mobility minimum The heat-treated after the AgPb20SbTe20 and AgPb22SbTe20 by hot pressing, analysis
354 thermoelectric properties as follows: (1)The heat treatment AgPb22SbTe20 its carrier concentration is lower than those without heat treatment, while AgPb20SbTe20 will remain at the same order of magnitude (1017), there was no significant difference in the display AgPb22SbTe20 highest Pb content in the heat treatment of the phenomena tend to have volatile Pb. (2)Heat treatment after AgPb22SbTe20 migration rate is about 15 times without heat treatment by the. (3)The AgPb20SbTe20 and its power factor AgPb22SbTe20 heat treatment at 427 are up to about W/mK 2, compared to those without heat treatment can be at a lower temperature of 10-3 order of magnitude of the standards, and the overall temperature both by the scope of the power factor improvement. Acknowledgements The authors would like to express their appreciation for the financial support from the Ministry of Science and Technology under Contract MOST: E & E D. References KF Hsu, S. Loo, F. Guo, W. Chen, JS Dyck, CtiradUher, T. Hogan, EK Polychroniadis, MG Kanatzidis, Cubic AgPbmSbTe2 + m: Bulk Thermoelectric Materials with High Figure of Merit, Science, 303, ( 2004). M. Zhou, JF Li, T. Kita, Nanostructured AgPbmSbTem + 2 System Bulk Materials with Enhanced Thermoelectric Performance, J. Am. Chem. Soc., 130, (2008). M. Zhou, JF Li, H. Wang, Fabrication and property of high-performance Ag-Pb-Sb-Te system semiconducting thermoelectric materials, Chin. Sci. Bull., 52, (2007). A. Kosuga, M. Uno, K. Kurosaki, S. Yamanaka, Thermoelectric properties of Ag1-xPb18SbTe20 (x = 0, 0.1, 0.3)," Journal of Alloys and Compounds, 387, 52-55(2005). DM Rowe, Thermoelectrics handbook, CRC press LLC, 2~3(2006). 799
355 Thermodynamic and Kinetic Studies for the Adsorption of Amoxicillin onto Modified Wheat Grains Othmane Benkortbi *, Asmaa Boukhelkhal, Mabrouk Hamadache, Salah Hanini Dr Yahia Fares University, Faculty of sciences and technology, Department of chemical engineering and environment, Ain D hab, Medea, 26000, Algeria * [email protected] Abstract Wheat grains are natural products which grow in the north of Algeria. They were used as adsorbent to remove amoxicillin antibiotic from wastewater. Adsorption isotherm of amoxicillin on modified wheat grains with 20% tartaric acid was investigated in batch tests under optimized conditions. The equilibrium amoxicillin antibiotic concentrations were measured with UV-Visible spectrophotometer. The pseudo-first-order, pseudo-second-order kinetic models and the intraparticle diffusion model were used to describe the kinetic data and the rate constants were evaluated. It was found that the pseudo-second-order model provides the most adequate correlation of experimental data. The rate parameters of the intraparticle diffusion model for adsorption were also evaluated and to identify the adsorption mechanisms. The thermodynamic parameters such as enthalpy ( H), entropy ( S) and free energy ( G) were calculated from the slope and intercept of the linear plot of log Kd against 1/T. Keywords: Wastewater, amoxicillin, wheat grains, adsorption, kinetics, thermodynamics, enthalpy, modelling. I. Introduction Groundwater contamination by pharmaceutical ingredients (analgesic, antibiotics, antidepressants, antidiabetics, contraceptives, growth regulators, impotence drugs, painkillers and tranquilizers) is an environmental problem of widespread concern. Ternes et al. (2002) ; Castiglioni et al. (2006) Pharmaceutical ingredients are actually found as residues in water and have been recognized as part of the hazardous chemical substances able to alter the natural equilibrium system of the surrounding environment. Nageswara Rao et al. (2014). Recently, antibiotics were quantified in hospital sewage water and wastewater, Gulkowska et al. (2008); Chatterjee (2008); ElSayed et al. (2013); Ghauch et al. (2009). Amoxicillin is one of the most used commercial penicillin antibiotic due to its high bacterial resistance and large spectrum against a wide variety of microorganisms. Trovó et al. (2011); Mohammadi et al. (2015). Its existence in wastewater from pharmaceutical industries and hospital effluents causes unpleasant odor, skin disorder, and microbial resistance among pathogen organisms or the death of microorganisms which are effective in wastewater treatment. The need to treat wastewaters charged with pharmaceutical ingredients is obvious. Recently, adsorption of amoxicillin onto chitosan beads, bentonite, Organobentonites and activated carbon has been investigated. Also, clays and oxides have been exploited for the removal of antibiotic drugs using adsorption technology. Putra et al. (2009); Braschi et al. (2010) ; Genç (2015). Adsorption of amoxicillin onto activated carbon plays an important role. However, the most used adsorbents in this process are activated carbons granular (GAC) and powdered (PAC) which are costly. Utrilla et al. (2013). However, in the majority of the studies involving sorptive removal of antibiotics, activated carbon has been employed as a potential sorbent material [38]. The relatively high production cost of activated carbon places a question mark on its large scale application. Environmental chemists have therefore focused their attention on employing agricultural wastes as sorbents. Snyder et al. (2007). Cost is an important parameter for comparing sorbent materials. Hence, the usage of indigenous biodegradable resources for treating hazardous waste would be less expensive. Prasad et al. (2000); Ajmal et al. (2003); Bulut et al. (2006). For this purpose, sun flower stalks, rice husk, almond husk, sawdust and spent grain, etc... have been used. The cost of these biomaterials is negligible compared with the cost of activated carbon or ion-exchange resins. Singh et al. (2009). Agricultural by-products consist of functional groups in the structure of lignin, cellulose, hemicellulose, ligno-humic, proteins, starch and polysaccharides. Agricultural by-products are appropriate for an environmental purpose, because they are abundant in nature, readily available and low cost. The use of 800
356 agricultural by-products as low-cost adsorbents can be thereby advantageous. wheat bran contains various groups including aliphatic and phenolic hydroxyl groups, methoxyl and carbonyl groups that offer the capability to catch pollutant. Singh et al. (2006). It was considered as a raw material for this study. The aim of this work focused therefore on the development of a new modified wheat grains as adsorbent available and cheap to remove amoxicillin antibiotic from wastewater. Kinetic models such as first-order, second-order equations and intra-particle diffusion model and thermodynamics were also investigated and parameter values were derived II. Materials and Methods II.1. Biosorbent preparation The pre-treatment of wheat grains consisted of washing several times with distilled water before drying for 24h in order to remove dirt and surface impurity; it was then baked at 50 C for another 24 h. The clean biosorbent obtained was milled and sieved to get a powder of different particle sizes. The chemical modification was realized by using tartaric acid. After washing, the purified biosorbent was mixed with 0.5 M tartaric acid at percentages of 10, 20 and 30%. Next, the slurry was stirred at 600 rpm for 30 min at 20 C, placed in an air oven and dried at 50 C for 24 h. II.2. Chemicals and analysis The antibiotic drug amoxicillin was kindly provided by the pharmaceutical company Saidal of Medea (Algeria) and used as a model adsorbate. Tartaric acid was purchased from FLUKA. The amoxicillin concentration in the solution was analyzed using a UV spectrophotometer (Shimadzu UV Mini-1240) by monitoring the absorbance changes at a wavelength of maximum absorbance of 232 nm. II.3. Adsorption studies To study the adsorption capacity of wheat grains, 2 g of adsorbent was placed in a 1000 ml Erlenmeyer flask containing an aqueous solution of 0.24 g/l of amoxicillin (500 ml) and the solution was shaken at 350 rpm at 25 C. Various experimental conditions, including contact time, temperature, agitation speed and adsorbent dose were tested for their impact on amoxicillin adsorption. The amount of amoxicillin adsorbed onto wheat grains was calculated using the following relationship: Q( mg / g) ( C 0 Ce ) * V / m (1) where C0 and Ce are the initial and equilibrium 801 amoxicillin concentrations(mg/l) respectively, V the volume of solution (L) and m the adsorbent dose (g). All experiments were carried out in duplicate. III. Results and discussions III.1. Adsorption kinetics In order to study the mechanism of adsorption and determining the rate controlling step, the kinetics data were analyzed by pseudo-first order, pseudo-second order, and intraparticle diffusion models. Lagergren, (1898); Mishra et al. (2012). The mathematical expressions of these models can be written as: Pseudo-first-order equation : Ln( Q Q ) Ln Q K t e t e 1 (2) Pseudo-second-order equation t Q 1 2 t K 2Qe t Q Intraparticle diffusion model Q t K id t 1/ 2 C e (3) (4) where Qt (mg/g), Qe (mg/g), Ce (g/l) are the amount of amoxicillin adsorbed per gram of sorbent at time t and at equilibrium and its concentration at equilibrium respectively; K1 (min-1) and K2 (g/mg.min) are the rate constants of the pseudo-first-order and pseudo-second-order adsorption process. Kid (mg/g min 1/2 ) is the intra-particle diffusion rate constant, and C (mg/g) is a constant that gives an idea about the thickness of the boundary layer. The linear plots, obtained between, 1/Qt versus 1/t for the pseudo first order and t/qt versus t for the pseudo second order reactions of the adsorption of amoxicillin are shown in Figs 1a-c. As can be seen, the correlation coefficient for the pseudo-first order was The value of first order rate constant k1 was obtained from the slope and was equal to 0.05 min -1 (Fig. 1a). This means that in case of strict surface adsorption, a variation in rate should be proportional to the concentration of amoxicillin. The values of Qe and k2 for the pseudo second ordecr were determined to be mg/g and (g/mg min) respectively and the correlation coefficient was R 2 =0.993 (Fig 1b). It is clear from the nature of the fit and the correlation coefficients that the adsorption of amoxicillin onto modified wheat grains followed a pseudo-second-order The plot of Qt versus t1/2 for intra-particle diffusion in the adsorption of amoxicillin onto modified wheat
357 grains (Fig. 1c) was used to obtain the diffusion rate parameters. The intra-particle diffusion plot gave a straight line with slope Kid and intercept C indicating that there is a difference between the rates of mass transfer in the initial and final steps of sorption, and that some other mechanisms, along with intra-particle diffusion are involved. The value of Kid for intra particle diffusion was calculated to be 3.80 (mg/g min 1/2 ) with a correlation coefficient of R 2 = From this linear fitting, the initial sorption rate was calculated and was (mg/g min). III.2. Thermodynamic study In any adsorption process, both energy and entropy considerations must be taken into account in order to determine which process should occur spontaneously. Values of thermodynamic parameters are the actual indicators for practical application of a process. Özcan et al. (2006); Vijayakumar et al. (2012). The amount of amoxicillin adsorbed at equilibrium at different temperatures 20, 30, 40 and 50 C were examined to obtain the thermodynamic parameters for the adsorption system. t/q Ln (Q e -Q t ) t, (min mg -1 g) Ln(Q e -Q t )= t R 2 = Experimental values Pseudo second order t, (min) Experimental values Pseudo first order t/q t = * t R 2 = Experimental values Intra particule diffusion t, (min) b Thermodynamic parameters, such as standard free energy change (ΔG), standard enthalpy change (ΔH), and standard entropy change (ΔS) can be calculated using the following equation: G RTLn K d (5) where R is the universal gas constant (2 cal./mol K),T is the temperature (K), and Kd is the equilibrium constant resulting from the ratio of the equilibrium concentrations of amoxicillin on that of the adsorbent in the solution. The enthalpy (ΔH) and entropy (ΔS) parameters were estimated from the following equation: S H Ln K d R RT (6) ΔG, ΔH, and ΔS can be calculated from a plot of lnkd versus 1/T (Fig. 2). Table 1 summarizes the thermodynamic parameters at various temperatures for the adsorption of amoxicillin onto modified wheat grains. Tab.1 Thermodynamic parameters for amoxicillin adsorption onto modified wheat grains ΔG (kcal/mol) 20 C 30 C 40 C 50 C ΔH (kcal/mol) ΔS (cal/mol.k) Q t, (mg/g) Q t = *t 1/2 R 2 = t 1/2, (min) 1/2 Fig. 1: Adsorption kinetics amoxicillin onto modified wheat grains (a); pseudo first order kinetic (b); pseudo second order kinetic and (c); intraparticle diffusion kinetic. isotherm. Experiment condition: T= 25 C, ph7, ω = 300 rpm, m = 4 g, C0 = 0,24 g(/l, particle size of 150 μm. c 802 The values of enthalpy ΔH= 3.18 kcal/mol indicated that the adsorption of amoxicillin using modified wheat grains was exothermic and physisorptive in character since ΔH value lower than 10 kcal/mol was obtained. The negative values of ΔG characterized a decrease of the Gibb s free energy, showing the feasibility of the process and its spontaneous nature in the considered experimental conditions. In the meantime, the negative entropy change (ΔS ) value ( cal/ mol K) corresponded to a decrease in the degree of freedom of the adsorbed species.
358 0.0 Experimental values Calculated values Chatterjee R., Fresh produce from wastewater. Environ. Sci. Technol, 42 (21) (2008). Ln(K d ) Ln(K d )= *(1/T) R 2 = ElSayed EM., Prasher SO., Patel RM., Effect of nonionic surfactant Brij 35 on the fate and transport of oxytetracycline antibiotic in soil, J. Environ. Manage, 116, (2013). Genç N., Removal of antibiotic ciprofloxacin hydrochloride from water by kandira stone: kinetic models and thermodynamic, Global NEST Journal, 17(3), (2015) /T, (K -1 ) Fig. 2: Estimation of thermodynamic parameters for amoxicillin adsorption onto modified wheat grains (T=25 C, ph7, ω = 300 rpm, m = 4 g, C0 = 0.24 g/l, IV. Conclusions The aim of this study was to investigate the ability of modified wheat grains to remove amoxicillin antibiotics from waste water. Under batch conditions equilibrium was attained within 5 min. The kinetic of amoxicillin adsorption onto modified wheat grains was examined using the pseudo-first order, pseudo-second order and intraparticle diffusion models, showing that amoxicillin adsorption onto modified wheat grains followed a pseudo-second order kinetic model. The values of the thermodynamic parameters, ΔG, ΔH and ΔS, indicated that the adsorption process of amoxicillin onto modified wheat grains was spontaneous and exothermic. To conclude, wheat grains were found to be a good adsorbent for the removal of amoxicillin antibiotics from wastewater. References Ajmal M., Rao RAK., Anwar S., Ahmad J., Ahmad R., Adsorption studies on rice husk: removal and recovery of Cd(II) from wastewater. Bioresour. Technol. 86, (2003). Braschi L., Blasioli S., Gigli L., Gessa CE., Alberti A., Martucci A., Removal of sulfonamide antibiotics from water: Evidence of adsorption into anorganophilic zeolite Y by its structural modifications, J. Hazard. Mater.17 8, (2010). Bulut Y., Aydın H., A Kinetics and Thermodynamics Study of Methylene Blue Adsorption on Wheat Shells, Desalination 194(1-3), (2006). Castiglioni S., Bagnati R., Fanelli R., Pomati F., Calamari D., Zuccato E., Removal of pharmaceuticals in sewage treatment plants in Italy Environ. Sci. Technol, 40 (1), (2006). 803 Ghauch A., Tuqan A., Abou Assi H., Antibiotic removal from water: Elimination of amoxicillin and ampicillin by microscale and nanoscale iron particles Environ. Pollut, 157, , (2009). Gulkowska A., Leung HW., So MK., Taniyasu S., Yamashita N., Yeung LWY., Richardson BJ., Lei AP., Giesy JP., Lam PKS., Removal of antibiotics from wastewater by sewage treatment facilities in Hong Kong and Shenzhen, China, Water res. 42, (2008). Lagergren S., About the theory of so-called adsorption of soluble substances Kungliga Svenska Vetenskapsakademiens Handlingar, 24, 1 39 (1898). Mishra V., Balomajumder C., Agarwal VK., Kinetics, mechanistic and thermodynamics of Zn(II) Ion sorption: a modeling approach. Clean: Soil, Air, Water, 40(7), (2012) Mohammadi A., Kazemipour M., Ranjbar H., Walker RB., Ansari M., Amoxicillin removal from aqueous media using multi-walled carbon nanotubes, Fuller.Nanotub. Car. N.J. 23, , (2015). Nageswara Rao L., Feroz S., Kamalakar D., Venkateswara Rao M., Equilibrium, kinetic and thermodynamics studies of methylene blue dye from aqueous solution by using natural adsorbent, Int. j. pharm, chem and biol.sci, IJPCBS 4(4), (2014). Özcan A., Öncü EM., Özcan AS., Adsorption of Acid Blue 193 from aqueous solutions onto DEDMA-sepiolite, J. Hazard. Mater. 129 (1-3), (2006). Prasad MNV., Freitas H., Removal of toxic metals from solution by leaf, stem and root phytomass of Quercus ilex L. (holl oak). Environ. Pollut. 110, (2000). Putra EK., Pranowoa R., Sunarsob J., Indraswatia N., Ismadjia S., Performance of activated carbon and bentonite for adsorption of amoxicillin from wastewater: mechanisms, isotherms and kinetics. Water Res. 43, (2009). Singh KK., Hasan SH., Talat M., Singh VK., Gangwar SK., Removal of Cr (VI) from aqueous solutions using
359 wheat bran. Chem. Eng. J. 151, (2009). Singh KK., Singh AK. Hasan SH., Low cost bio-sorbent wheat bran for the removal of cadmium from wastewater: Kinetic and equilibrium studies. Bioresour. Technol. 97, (2006). Snyder SA., Adham S., Redding AM., Cannon FS., DeCarolis J., Oppenheimer J., Wert EC., Yoon Y., Role of membranes and activated carbon in the removal of endocrine disruptors and pharmaceuticals, Desalination 202, (2007). Ternes TA., Meisenheimer M., Mcdowell D., Sacher F., Brauch HJ., Haist-Gulde B., Preuss G., Wilme U., Zulei-Seibert N., Removal of Pharmaceuticals during Drinking Water Treatment, Environ. Sci. Technol., 36, (2002). Trovó AG., Pupo Nogueira RF., Agüera A., Fernandez-Alba AR., Malatoc S., Degradation of the antibiotic amoxicillin by photo-fenton process Chemical and toxicological assessment, Water Res. 45(3), (2011). Utrilla JR., Gómez-Pacheco CV., Sánchez-Polo M., López-Peñalver JJ., Ocampo-Pérez R., Tetracycline removal from water by adsorption/bioadsorption on activated carbons and sludge-derived adsorbents, J. Environ. Manage. 131, (2013). Vijayakumar G., Tamilarasan R., Dharmendirakumar M., Adsorption kinetic equilibrium and thermodynamic studies on the removal of basic dye Rhodamine-B from aqueous solution by the use of natural adsorbent perlite, J. Mater. Environ. Sci. 3(1), (2012) 804
360 A Novel Technique for the Production of Fuel Bioadditive Ethyl Levulinate: Green Process by the Catalytic Membrane Derya Unlu *, Nilufer Hilmioglu Kocaeli University, Engineering Faculty, Chemical Engineering Department, Umuttepe, Kocaeli, 41380, Turkey * [email protected] Abstract The transport sector is one of the major polluting sources for the atmosphere. The rapid increment of usage of personal and industrial vehicles which use petroleum based fuels, has increased the emission of poisonous gases. The combustion of petroleum based fuels affects environment quality and human health associated with high emission of NOx and particulate matters. Especially, vehicles with diesel engines are responsible for the harmful soot emissions. Oxygenated fuel additives are attractive for conventional diesel engine, because oxygen content in the fuels has an important effect on soot formation and particle emissions. Ethyl levulinate has an oxygen content of %33 and can be used as an oxygenate diesel bioadditive up to 5 wt% due to its low toxicity, high lubricity and flashpoint, cleaner burning. Ethyl levulinate is produced from renewable sources such as levulinic acid and ethanol. While levulinic acid is obtained by decomposition of waste cellulosic materials, ethanol is produced from starch and sugar based feedstock and lignocellulosic materials. Ethyl levulinate is produced by esterification of levulinic acid with ethanol using homogeneous catalysts such as sulphuric, hydrochloric acids. These mineral acids cannot be recycled and cause environmental problems such as corrosion of equipment. Therefore, replacement of homogenous catalyst by green alternatives is increasingly important. Various heterogeneous catalysts have been reported for the esterification of levulinic acid with ethanol in the literature. In this study, catalytic membrane is used as catalyst for the synthesis of ethyl levulinate. Catalytic membranes have many advantages. They are separated from the reaction mixture easily and reused. Therefore, catalytic membranes can be defined environmentally friendly and eco-friendly. In this work, we try to develop an efficient green catalytic process for production of ethyl levulinate in the presence of catalytic membranes. ZrO2 supported tungstosilicic acid was used as catalyst. Hydroxyl ethyl cellulose was chosen as polymeric membrane materials. Catalyst was immobilized on the hydroxylethyl cellulose membrane. Thus, catalytic membrane has been prepared. The catalytic properties of the membranes were tested by the esterification of levulinic acid with ethanol.the influence of reaction parameters on the synthesis of ethyl levulinate such as temperature, catalyst concentration, initial molar ratio, catalyst amount were investigated. The aim of this work is production of ethyl levulinate in high yield by green and environmental process. Catalytic membrane was found as efficient catalyst for the synthesis of ethyl levulinate and higher conversion values were obtained. Keywords: Catalytic membrane, clean burning, ethyl levulinate, green process, oxygenated additive. I. Introduction The growth of human population is lead to increasing travel demand. The increased travel demand has resulted in rapid growth in the number of vehicles.this growth is one of the main sources of air pollution with regard to using petroleum derived fuels such as gasoline and diesel (Colvile et al., 2001). Diesel engine is preferable than gasoline engine because of the low cost of diesel fuel. In addition, using of diesel fuel is lead to increment of exhaust gases such as CO, NOx and soot emission (Patil and Taji). Oxygenated fuel additives represent an attractive alternative for reducing exhaust gases. Addition of oxygenate is changed the structure and composition of the fuel. Oxygen content in the fuel is important parameter for the lower harmful emissions (Härtl et al., 2015 and Singh et al., 2013). Ethyl levulinate is one of the oxygenated additives. It is known as diesel miscible biofuel. Ethyl levulinate can be used up to 5 wt% in diesel car engines. Blend of ethyl levulinate with diesel fuel is improved to combustion quality and reduce emission of diesel engines (Fernandes et al., 2012 and Singh et al., 2013 and Patil and Taji) Ethyl levulinate is produced from ethanol and levulinic acid as biomass derived chemicals. Therefore, esterification of levulinic acid and ethanol is very attractive green process (Fernandes et al., 2012). Levulinic acid is renewable chemical that can be obtained from carbonhydrate and cellulose based biomass. Levulinic acid is one of the top twelve building block for the production of important chemicals in the industry (Oliveira and Silva, 2014 and Pasquale et al., 2015). Besides that, ethanol is also produced from renewable sources, such as corn, sugar cane and lignocellulosic biomass (Thangavelu et al., 2016). Consequently, ethyl levulinate is a very attractive compound for use as an oxygenated fuel bioadditive (Oliveira and Silva, 2014). Ethyl levulinate is usually produced by esteification 805
361 reaction of levulinic acid and ethanol using homogeneous catalysts such as H2SO4, HCl and H3PO4. These acid catalysts are unrecyclable and corrosive effect of the equipment. Interest of many researchers is concentrated on exploration of the green catalyst (Nandiwale et al., 2013 and Fernandes et al., 2012). Heteregenous solid acid catalysts are good alternative to overcome the drawbacks of homogeneous catalysts. They can be easily separated form the reaction mixture and reusable for repeated run (Oliveira and Silva, 2014). Various heterogeneous catalyst have been used for synthesis of ethyl levulinate. Among these heteregeneous catalysts, heteropolyacids have received considerable attention due to their strong and stable Brönsted acidity (Dharne and Bokade, 2011 and Nandiwale et al., 2013). However, heteropolyacids have some problem such as separation problem from the reaction medium and low surface area. Various supports such as silica, ZrO2 are used to overcoming the problems. These supports provide higher surface area, larger pore volume and can enhance the adsorption and catalytic properties (Dharne and Bokade, 2011). Also, polymers have been used as a support for the immobilisation of the catayst. They can be defined as "catalytic membrane". The investigation of catalytic membranes is very popular in recent years (Borges et al., 2008). Catalytic membranes are used as green catalyst. They can easily separated from reaction mixture and can be reused without any treatment. They can use under mild conditions, no corrosion to equipment and no pollution to the environment (Zhang et al., 2012). Polymeric membranes are usually used due to easier production with lower cost. The catalytic behaviour of the membranes depends on the diffusion of the reactants and the dispersion of the catalyst inside the membrane layer. Therefore selection of polymeric material is important (Centi, et al., 2003). Hydroxyethyl cellulose (HEC) is a good candidate for the preparation of membrane. It shows high hydrophilicity and good thermal and mechanical stability. II. Experimental II.1. Materials HEC was obtained from Sigma Aldrich. Levulinic acid and ethanol were supplied by Merck. Tungstosilicic acid (TSA) and zirconium oxide (ZrO2) as catalyst materials were purchased from Sigma Aldrich. All chemicals were used without further purification. II.2. Catalyst Preparation and Characterization ZrO2 supported tungstosilicic acid (TSA/ ZrO2) was prepared by wet impregnation method. 1 gr of ZrO2 was impregnated with an aqueous solution of tungstosilicic acid. The mixture was stirred for 24 h. The resulting mixture was dried at 100 o C for 24 h. The drying catalyst was calcined at 400 o C for 5 h. The obtained catalyst was characterized by SEM and XRD (Bhatt and Patel, 2005). II.3. Catalytic Membrane Preparation and Characterization HEC membrane was prepared by dissolving in water at room temperature for 5 h. The catalytic membrane solution was prepared by adding a certain amount of catalyst in HEC membrane solution. ZrO2 supported tungstosilicic acid which was prepared in our laboratory used as catalyst. The catalytic membrane solution was cast carefully onto a plate and dried at room temperature. The dried catalytic membrane was immersed into H3PO4 in 90% v/v aqueous isopropanol solution for crosslinking. Then the membranes were dried at 80 o C for 6 h. The surface morphology of the catalytic membranes were analyzed using SEM operated at 10 kv. II.4. Catalytic Performance of the Catalytic Membranes Esterification reaction was perform in a three-necked batch reactor equipped with a reflux and magnetic stirring. A schematic representation of the batch reactor process was shown in Fig.1. In this work, HEC membranes were loaded with zirconium oxide supported tungstosilicic acid as heterogenous catalysts in the esterification of levulinic acid with ethanol. ZrO2 supported tungstosilicic acid was prepared by wet impregnation method. Properties of catalysts were characterized by X-ray diffraction (XRD) and scanning electron microscopy (SEM). Catalyst dispersion in the polymer matrix was viewed by SEM images. Esterification reaction was performed in batch reactor. The activity of catalytic membrane was tested at different reaction parameters such as temperature, catalyst concentration, molar feed ratio, catalytic membrane amount. 806 Fig. 1.Batch reactor

")
362 The reactants were heated up to the reaction temperature and the reaction was started by adding catalytic membranes. The catalytic membranes were cut into small pieces to achieve better contact with reactants. Samples were taken at regular time periods and analyzed by titration. Conversion of levulinic acid was calculated by Equation 1, The XRD patterns of ZrO2 and TSA/ZrO2 catalysts are shown in Fig. 3. X = N 0 N 0 N i (1) Where N0 is the initial moles of levulinic acid, Ni is the moles of levulinic acid at any time. III. Results and discussions III.1. Catalyst Characterization The morphology of ZrO2 and ZrO2 supported tungstosilicic acid and also distribution of tungstosilicic acid in the ZrO2 support were examined using SEM (JEOL/JSM-6510-LV). While Fig. 2 (a) shows the support ZrO2, Fig. 2 (b) shows the TSA/ ZrO2 catalyst. Fig. 3. XRD pattern of TSA/ZrO2 and ZrO2 The ZrO2 gave peaks at 2θ = 24, 28.2, 31.5 and 30.2, 34.5, 35.4, 50.2, 60.2, 62.9 corresponding to the existence of monoclinic and tetragonal phases respectively. No peaks were observed for Keggin structure of TSA. This situation is indicated that TSA show homogeneous distribution on the ZrO2 support. ZrO2 can supply enough surface area to distribute TSA and avoid forming bulk crystalline of TSA (Marakatti et al., 2013 and Zhu et al., 2013). III.2. Catalytic Membrane Characterization The morphology and ZrO2 supported tungstosilicic acid distribution in the membrane were investiagted using SEM (JEOL/JSM-6510-LV). Fig. 2. SEM images of (a) ZrO2 and (b) TSA/ZrO2 TSA species are well distributed over the ZrO2 support. The surface of the ZrO2 is changed, displaying noticeable surface shining after embedding of the TSA (Fig. 2 (b). TSA is seen as whiter color than ZrO2 in Fig. 2 (b) due to Fig. 2 (a). 807 Fig. 4. SEM images of catalytic membrane(a) surface (b) cross-section
 shows the cross section of the catalytic membrane.")

363 SEM images of the TSA/ ZrO2 loaded catalytic membranes are shown in Fig. 4. Fig.4 (a) shows the surface morphology of the catalytic membrane. TSA/ZrO2 catalysts are well dispersed over catalytic membrane surface. Fig. 4 (b) shows the cross section of the catalytic membrane. Upper surface of the catalytic membrane was well coated by TSA/ZrO2. III.3.2. Molar feed ratio effect on levulinic acid conversion The molar ratio of ethanol to levulinic acid used was 3:1, 6:1 and 9:1. The reaction was carried out at constant operation temperature of 75 o C and catalyst concentration 1.3 wt. % and catalytic membrane amount 4 wt. %. III.3. Production of Ethyl Levulinate III.3.1. Temperature effect on levulinic acid conversion The operation temperature had an important influence on the conversion. The experiments were performed at 55 o C, 65 o C and 75 o C. The molar feed ratio (ethanol to levulinic acid, M), catalyst concentration (Ccat) and catalytic membrane amount (CMA) was fixed as 3, 1.3 wt. % and 4 wt. % respectively. The reaction time is also fixed for 7 hour for all experiments. Because, conversion of levulinic acid reach equilibrium at the end of the 7h. The results obtained were displayed in Fig. 5. Fig. 6. Molar feed ratio effect on levulinic acid conversion (T=75 o C, Ccat=1.3 wt %, CMA=4 wt %) Fig. 5. Temperature effect on Levulinic acid conversion (M=3:1, Ccat=1.3 wt %, CMA=4 wt %) The highest operation temperature was selected as 75 o C because it is near the boiling point of ethanol (78 C). Levulinic acid conversion was found to increase with increasing operation temperature. Results obtained in the Fig.5 indicate that the conversion values of levulinic acid are sensitive to a change in temperature. The esterification of levulinic acid with ethanol is an endothermic and reversible reaction. Therefore with the increase of temperature, the reaction equilibrium shifted towards the products and conversion value increased (Nandiwale et al., 2014). In addition; the operation temperature increased, the kinetic energy of the reactants increased hence reaction rate increased. A maximum conversion of levulinic acid was reached at 75 C. At the end of the reaction, levulinic acid conversions were 66, 77 and 79% at 55, 65 and 75 C, respectively. 75 o C is chosen as the operation temperature for the determination of other reaction parameters. The effect of the molar feed ratio of reactants on the conversion of levulincic acid is shown in Fig. 6. It can be seen that the conversion of levulinic acid increases with increasing the molar feed ratio of reactants. The results indicated that the higher reaction conversion was obtained when the ethanol was in excess, because esterification reaction of ethanol and levulinic acid was reversible. The usage of excess of one reactant overcomes the thermodynamic equilibrium limitations. For the esterification with ethanol, the conversion of levulinic acid increases from 78% to 84% on varying ethanol to levulinic acid ratio from 3:1 to 9:1. The maximum conversion is obtained for (M = 9:1), but there is no obvious difference between M=6:1 and M=9:1. The optimum molar ratio of ethanol to levulinic acid was determined as 6:1. III.3.3. Catalyst concentration effect on levulinic acid conversion The esterification of levulinic acid with ethanol was performed with different catalyst concentrations 1.3 wt%, 2 wt% and 2.7 wt% at 75 o C, 6:1 molar ratio of ethanol to levulinic acid and 4wt. % catalytic membrane amount. Fig. 7 presents the effect of catalyst concentration on the conversion of the levulinic acid. Catalyst concentrations were defined as a percentage of weight levulinic acid amount. It was found that the conversion of levulinic acid is directly proportional the catalyst concentration. At higher catalyst concentration, the surface area and the total number of active sites increase (Ma et al., 2009) Catalyst were well dispersed in the catalytic membrane. 808


364 Therefore, reactants could be easily reached catalyst active sites and conversion of acid increased. Ethyl levulinate production increased from 73% to 90% as the catalyst concentration was increased from 1.3 wt. % to 2.7 wt. %. The catalytic stability of the catalytic membrane was examined. Different batch runs with the same catalytic membrane sample were carried out at the equal operating conditions (75 o C, Ccat=2 wt. %, CMA=4 wt%). Fig. 7. Catalyst concentration effect on levulinic acid conversion (T=75 o C, M=6:1, CMA=4 wt %) III.3.4. Catalytic membrane amount on levulinic acid conversion Effects of varying the amount of catalytic membrane were investigated at the operation conditions of M=6:1, T=75 C, catalyst concentration 2 wt. %. Catalytic membrane amounts were changed as a percentage of levulinic acid weight. Amount of catalytic membrane was arranged in 4 8 wt.%. Fig. 8. Catalytic membrane amount effect on levulinic acid conversion (T=75 o C, M=6:1, Ccat=2 wt %) It is clear from the Fig. 8 that, amount of catalytic membrane had little impact on the levulinic acid conversion. When the amount of catalytic membrane was 4%, 6% and%8, the levulinic acid conversion was 86%, 90% and 91%, respectively. III.3.4. Catalytic membrane stability Fig. 9. Stability studies of the catalytic membranes The reusability of the catalyst is important for the esterification reaction. The catalytic membrane can be separated and reused. From Fig.9 shows that the catalytic membrane can be used five times without significant loss of activity. This reusability presents the high stability and recovery of HEC membranes loaded with TSA/ZrO2 catalytic membrane (Caetano et al., 2013). IV. Conclusions In this study, catalytic membranes were used as catalyst for production of fuel bioadditive ethyl levulinate. Hydroxyethyl cellulose membranes loaded with TSA/ZrO2 are very active in the esterification of levulinic acid with ethanol. In order to optimize the operation conditions, the effect of various operation parameters, such as temperature, molar feed ratio, catalyst concentration and catalytic membrane amount on synthesis of ethyl levulinate over the catalytic membrane, were investigated. The conversion of levulinic acid increased as the temperature, catalyst concentration increased. When the reactions were performed in different molar feed ratio and catalytic membrane amount, it can be observed that, these parameters had little noticeable effect of the conversion. In order to study the catalytic stability of catalytic membrane, five consecutive batch runs with the same membrane were used. Similar values of the conversion values were observed. As a result, ethyl levulinate can be produced successfully by using hydroxyethyl cellulose membranes loaded with TSA/ZrO2. Acknowledgements This study was financially supported by the TÜBİTAK (The Scientific and Technological Research Council of Turkey), Turkey (Project No. 114M147). 809
365 Nomenclature x N0 Ni : Conversion of levulinic acid : initial moles of levulinic acid : the moles of levulinic acid at any time : Viscosity (Pa.s) Subscripts M : Molar feed ratio HEC : Hydroxyethyl cellulose TSA : Tungstosilicic acid ZrO2 : Zirconium oxide SEM : Scanning electron microscopy XRD : X-ray diffraction References Bhatt N., Patel A., Esterification of 1 and 2 alcohol using an ecofriendly solid acid catalyst comprising 12-tungstosilicic acid and hydrous zirconia, Journal of Molecular Catalysis A: Chemical, 238, (2005). Caetano C.S., Caiado M., Farinha J., Fonseca I.M., Ramos A.M., Vital J., Castanheiro J.E., Esterification of free fatty acids over chitosan with sulfonic acid groups, Chemical Engineering Journal 230, , (2013). Centi G., Dittmeyer R., Perathoner S., Reif M., Tubular Inorganic catalytic membrane reactors: advantages and performance in multiphase hydrogenation reactions, Catalysis Today 79 80, , (2003). Colvile R.N., Hutchinson E.J., Mindell J.S., Warren R.F., The transport sector as a source of air pollution, Atmospheric Environment, 35, , (2001). Dharne S., Bokade V.V., Esterification of levulinic acid to n-butyl levulinate over heteropolyacid supported on acid-treated clay, Journal of Natural Gas Chemistry 20, 18 24, (2011). Fernandes D.R., Rocha A.S., Mai E.F., Mota J.A., Silva V.T. Levulinic acid esterification with ethanol to ethyl levulinate production over solid acid catalysts, Applied Catalysis A: General, , , (2012). Figueiredo K.C.S., Salim V.M.M., Borges C.P., Synthesis and characterization of a catalytic membrane for pervaporation-assisted esterification reactors, Catalysis Today, , , (2008). Marakatti V.S., Shanbhag G.V., Halgeri A.B., Sulfated zirconia; an efficient and reusable acid catalyst for the selective synthesis of 4-phenyl-1,3-dioxane by Prins cyclization of styrene, Applied Catalysis A: General, 451, 71 78, (2013). Intensifying esterification reaction between lactic acid and ethanol by pervaporation dehydration using chitosan TEOS hybrid membranes, Chemical Engineering Journal, 155, , (2009). Martin Härtl M., Seidenspinner P., Jacob E., Wachtmeister G., Oxygenate screening on a heavy-duty diesel engine and emission characteristics of highly oxygenated oxymethylene ether fuel OME1, Fuel, 153, , (2015). Nandiwalea K.Y., Sonar S.K., Niphadkar P.S., Joshi P.N., Deshpandea S.S., Patil V.S.,. Bokade V.V., Catalytic upgrading of renewable levulinic acid to ethyl levulinate biodiesel using dodecatungstophosphoric acid supported on desilicated H-ZSM-5 as catalyst, Applied Catalysis A: General , 90 98, (2013). Nandiwale K.Y., Niphadkar P.S., Deshpande S.S., Bokade V.V., Esterification of renewable levulinic acid to ethyl levulinate biodiesel catalyzed by highly active and reusable desilicated H-ZSM-5, J. Chem. Technol. Biotechnol. 89, , (2014). Oliveira B.L., Silva V.T., Sulfonated carbon nanotubes as catalysts for the conversion of levulinic acid into ethyl levulinate, Catalysis Today, 234, , (2014). Pasquale G., Vázquez P., Romanelli G., Baronetti G., Catalytic upgrading of levulinic acid to ethyl levulinate using reusable silica-included Wells-Dawson heteropolyacid as catalyst, Catalysis Communications 18, , (2012). Patil A. R., Taji S. G., Effect of Oxygenated Fuel Additive on Diesel Engine Performance and Emission: A Review, IOSR Journal of Mechanical and Civil Engineering, Singh S., Kumar A., Mahla S. K., Batth G.S., Experimental study on emission analysis of oxygenated fuels dimethyl carbonate (dmc) and dibutyl maleate (dbm) in a ci engine, International Journal of Research in Engineering and Technology, 2, , (2013). Thangavelu S.K., Ahmed A.S., Ani F.S., Review on bioethanol as alternative fuel for spark ignition engines, Renewable and Sustainable Energy Reviews 56, , (2016). Zhang H., Ding J., Zhao Z., Esterification of different FFAs with methanol by CERP/PES hybrid catalytic membrane for biodiesel production, Journal of Central South University, 19, , (2012). Zhu S., Zhu Y., Gao X., Mo T., Zhu Y., Lia Y. Production of bioadditives from glycerol esterification over zirconia supported heteropolyacids, Bioresource Technology, 130, 45-51, (2013). Ma J., Zhang M., Lu L., Yin X., Chen J. and Jiang Z., 810
366 Biodiesel Synthesis by Using the Smart Catalytic Membrane Derya Unlu *, Aynur Hacioglu, Nilufer Hilmioglu Kocaeli University, Engineering Faculty, Chemical Engineering Department, Umuttepe, Kocaeli, 41380, Turkey * [email protected] Abstract Consumption of petroleum based fuels resulted in environmental pollution and energy crisis. Because fossil fuels have limited resources and they are depleting and unsustainable in the longer-term. Besides that, the burning of fossil fuels produces carbon dioxide and nitrogen oxides which contribute to the formation of acid rain and global warming. Therefore, researchers are developing ways to produce green energy from renewable, safe and sustainable sources. Biodiesel is a promising alternative fuel to fossil fuels which can overcome environmental pollution and global energy demand. Biodiesel is biodegradable, non-toxic and clean-burning fuel and that can be used in pure form or in blends with petroleum--derived diesel at vehicle engine. The use of pure biodiesel could substantially reduce harmful emissions, because biodiesel has high flash point and cetane number. Biodiesel is generally obtained from a renewable biological resource such as vegetable oils, waste oils and animal fats in the presence of alkaline catalysts. Using an alkaline catalyst leads to the formation of soaps during the reaction. The soap formation reduces the ester yield and requires an additional separation step. In recent years, acidic catalysts such as heteropolyacids, solid superacids and resins are developed for biodiesel synthesis. These catalysts can be recycled easily from the reaction mixture and they have no corrosive effect on reactor. Therefore, it is important to use an efficient and environmentally friendly catalysts for the synthesis of biodiesel. In this study, catalytic membrane was prepared and used as heterogeneous catalyst for the production of biodiesel from oleic acid with methanol. Catalytic membrane is formed from polymer and catalyst. Catalytic membrane was prepared from polymer blend and acidic catalyst "sulfosuccinic acid". Chitosan and polyvinylpyrrolidone were chosen as materials due to biodegradable properties. Reaction conditions such as temperature, alcohol/acid initial molar ratio and catalyst amount were investigated. Sulfosuccinic acid loaded catalytic membrane was found suitable, smart and recyclable catalyst for the biodiesel reaction and higher reaction yield was obtained. Keywords: Biodiesel, catalytic membrane, clean burning, renewable energy I. Introduction Energy is an important key for the global development. Energy consumption is rapidly increased and has reached high levels. Fossil fuels cannot meet the energy demand of the world because of the decrease of fossil fuel reserves and they can lead to serious environmental problems. All over the world search for alternative energy sources due to these reasons. Biomass has the biggest potential in the novel and renewable energy sources. Biomass is biologically original organic mass. Biodiesel is the most important alternative biomass derived fuel. Biodiesel can be used without modification in diesel engine as alternative to diesel fuel. Diesel engines require clean combustion and a good performance in different operation conditions. Biodiesel has low emission properties, so it can be used in urban and marine transportation. Biodiesel is produced from the transesterification of triglycerides or the esterification of free fatty acids (FFAs) with low molecular weight alcohols in the presence of catalysts (Acaroğlu, 2003). The esterification reactions are carried out in the presence of homogeneous acid catalysts such as sulfuric or hydrochloric acid. They are very efficient catalyst for this reaction. However, they have some problems such as difficult separation from the reaction medium, reutilization, serious environmental problems and equipments corrosion. Therefore, alternative methods are investigated for using homogeneous catalysts. Polymeric membrane is a good alternative for solving these problems. Homogeneous catalysts are embedded in polymeric membrane and catalytic membrane formed is used as catalyst for reactions. Therefore, catalytic membrane are easily separated from the reaction mixture (Caetano et al., 2013). Chitosan is chosen as polymeric material due to biodegradable properties. Chitosan is one of the polysaccharide that is easily produced from the shells of crabs and crustaceans. Chitosan has some good properties such as nontoxicity, antibacterial, biocompatibility and biodegradability. These excellent properties make chitosan an attractive biopolymer. In addition, easy modification of chitosan leds to use as heterogeneous catalyst for hydrogenation, oxidation, esterification reactions. Chitosan has been used as a support for the calcium oxide catalyst also (Caetano et al., 2013 and Tsai and Wang, 2008). Chitosan is blended with polyvinylpyrrolidone (PVP) polymer in 811
367 present paper. Polyvinylpyrrolidone (PVP) has gained a lot of interest due to its hydrophilicity, lubricity, anti-adhesive property and excellent biocompatibility. Furthermore, PVP and chitosan can form a homogeneous polymeric mixture due to the strong hydrogen bonds between two kinds of molecules (Wang et al., 2012). In this study, catalytic membrane was prepared by using sulfosuccinic acid with chitosan/ polyvinylpyrrolidone blend for biodiesel synthesis. Effect of temperature, methanol/oleic acid molar ratio and catalyst concentration on conversion were investigated. The repeatability of conversion values were within ±2%. III. Results and discussions III.1. Catalytic Membrane Characterization III.1.1. FTIR spectroscopy Fig. 1 shows the FTIR spectra of SSA loaded PVP/CS blend membranes. II. Experimental II.1. Materials Chitosan (CS) and Polyvinylpyrrolidone (PVP) were purchased from Sigma Aldrich. Methanol was received J.T.Baker. Sulfosuccinic acid (SSA, 70 wt% solution in water) were obtained from Sigma Aldrich. Oleic acid was purchased Alfa Aeasar. II.2. Catalytic Membrane Preparation and Characterization The 2-wt.% solution of CS was prepared in 2% (v/v) aqueous solution of acetic acid mixture. The 2-wt.% PVP solution was dissolved in deionized water by continuous stirring. The blend of PVP/CS was prepared by mixing both of the solutions. After that, SSA was added in the blend solution for mixing in 24 h. The obtained solutions were cast on a clean plate and dried at 60 o Cfor 24 h. After drying, the membrane was heated at 100 o C under vacuum for 2 h. Catalytic blend membrane was characterized by FTIR and TGA. Also, acidity index of membranes were determined by titration. II.3. Catalytic Performance of Catalytic Blend Membranes The esterification of oleic acid with methanol was carried out in a batch reactor equipped with a magnetic stirrer, reflux condenser and thermocouple. Catalytic blend membrane cut in small pieces was used as catalyst in the reaction. Oleic acid and methanol heated up to the reaction temperature separately. Reaction was started by adding catalytic membrane pieces. Samples were taken periodically and the reaction converison was determined by titration method. The conversion of oleic acid can be determined from the following equation: n0 ni X = (1) n 0 where the subscript 0 refers to the initial mole value (n) and i refers to the mole value at a certain reaction time. Fig.1. FT-IR spectra of SSA loaded PVP/CS blend membrane FTIR spectra shows the functional groups of polymers. The peak around 1660 cm 1 shows a single carbonyl band of CS/PVP blend. The appearance of the absorption band at 1688 cm 1 is usually assigned to the amide carbonyl group of PVP. The peak at 1300 cm -1 is assigned to the absorbance of C-N bonds. The appearance of the absorption band at cm -1 is assigned to the ( CO O ) group. This situation indicates that the crosslinking with SSA was successful. The absorption band at 1255 cm -1 shows the presence of a sulfonic acid group. Additionally, the band at 810 cm -1 corresponds to the C O S group, the sulfonic acid groups were grafted onto chitosan. The peak at 1543 cm -1 is assigned to the specific absorbance of N H bonds in NH + 3 groups. In addition, a broad NH3 peak at 2000 cm -1 may indicate the formation of ionic bonds (Zhang et al., 2009 and Devi et al., 2006 and Caetano et al., 2013). III.1.2. Thermogravimetric analysis (TGA) The thermal stability of chitosan/pvp with sulfonic groups was studied by thermal gravimetric analysis (TGA), as shown in Fig.2. TGA thermograms of CS/PVP show weight loss stage ranging from 40 to 180 o C and 180 to 380 o C, and 380 o C to 450 o C, due to the decomposition of CS and PVP polymers, respectively. The first weight loss at approximately o C is due to the vaporization of small molecules, such as physically absorbed water, acetic acid and sulfosuccinic acid. The second weight loss is due to the degradation of chitosan polymer. Thermal degradation studies show that the crosslinked blend membranes can be effectively used 812


368 in esterification reaction experiments at temperature up to 180 o C (Zhang et al., 2009 and Devi et al., 2006 and Caetano et al., 2013). reaction and increasing methanol would change the equilibrium towards the product direction. The time required to obtain the maximum oleic acid conversion decreased at higher molar ratios (Nascimento et al., 2011 and Kusdiana and Saka, 2001 and Marchetti and Errazu, 2008). Fig. 2. TGA curves for PVP/CS blend III.2. Synthesis of Biodiesel III.2.1. Effect of Reaction Time Fig. 3 represents the effect of reaction time on the esterification of oleic acid over the catalytic membrane at 65 o C, M=6, 5 wt.% catalyst concentration. Fig.3. Effect of reaction time on oleic acid conversion The conversion value increased with increasing reaction time and reached around 65% after 4 h of reaction and the conversion value decreases from 65% to 41% and %38 when the reaction time increases from 4 h to 5 and 6 h. The reaction reaches equilibrium value after 4 h, and the conversion of oleic acid was decreased with the increasing reaction time. Therefore, 4 h is chosen as optimum time for this reaction. Fig. 4. Effect of methanol/oleic acid molar ratio on oleic acid conversion The oleic acid conversion percentages obtained at molar ratios of 3:1 and 6:1 were 27% and 52%, respectively, at 4 h. As the molar ratio increased to the stochiometric ratio of 9:1, the oleic acid conversion decreased to 46%. The results approved that using of excess methanol lead to increment oleic acid conversion. On the other hand, methanol:oleic acid ratio greater than 6:1 caused to decreasing of the oleic acid conversion. Therefore, 6:1 molar ratio is determined as optimum molar ratio for this reaction in consideration of the energy requirement (Colucci et al., 2005 and Yang et al., 2015). III.2.3. Effect of Catalyst Concentration The effects of the catalyst concentration in the catalytic membrane on the conversion of oleic acid are shown in Fig. 5. Catalyst concentration of the catalytic membrane was varied from 2.5 wt% to 7.5 wt % at a temperature of 65 o C, methanol/oleic acid molar ratio of 6:1. III.2.2. Effect of Methanol/Oleic Acid Molar Ratio The reactions used methanol:oleic acid molar ratios of 3:1, 6:1 and 9:1, and the obtained results are shown in Fig 4. The reaction temperature and the catalyst concentration was kept constant at 65 o C and 5 wt% respectively. The molar ratio of methanol to oleic acid is one of the most important parameters affecting the converisons of oleic acid. Additional alcohol in the reaction mixtures greatly increased the oleic acid conversion. Oleic acid esterification reaction is an equilibrium Fig. 5. Effect of catalyst concentration on oleic acid conversion 813

369 As shown in Fig. 5, the conversion of oleic acid was dependent on the catalyst concentration in the esterification reaction. The catalyst concentration defined as the mass percentage of the catalyst to the oleic acid mass. Increases in catalyst concentration accelerate the reaction rate. As can be seen in Fig.5, the optimum conversion (52%) of oleic acid was achieved with a catalyst concentration of 5% in the catalytic membrane. Higher catalyst concentration had important effects on oleic acid conversion (Marchetti and Errazu, 2008). The conversion of oleic acid was quite low (10%) when 2.5 wt. % of the catalyst concentration in the catalytic membrane was used. This situation indicated that the reaction could carried out inefficiently with a little catalyst concentration in the catalytic membrane. Because, catalytic membrane has low active sites in this condition. However, the oleic acid conversion increased to around 52% when 5 wt. % of the catalyst was used. The acid values increased with increasing amount of sulfosuccinic acid used in the catalytic membrane synthesis (Hasan et al., 2015). With further increase of the catalyst concentration (7.5 wt. %), the conversion of oleic acid decreased to 29 wt. %. As a result, the practical catalyst loading is controlled at 5.0 wt%. III.2.4. Effect of Reaction Temperature The effect of the reaction temperature on the oleic acid conversion was studied experimentally. Temperature was varied over a range of o C at the catalyst concentraion of 5 wt.% and the molar ratio of methanol to oleic 6. The obtained results were shown in Fig. 6. molecules, the reaction rate and the conversion of oleic acid. However, reaction temperature is chosen as maximum 65 o C for avoiding the methanol vaporization (Chen et al., 2016). IV. Conclusions Chitosan/PVP catalytic membrane with sulfosuccinic acid was used as a catalyst in the esterification of oleic acid with methanol at 65 o C. The catalytic activity of catalytic membrane increased with increasing the methanol/oleic acid molar ratio and reaction temperature. When the sulfonic acid loading was high, a decrease in the catalytic activity was observed. Comparing with the literature, higher conversion values were obtained by using catalytic membrane in this study. Also, reaction time is shorter. Therefore, SSA loaded CS/PVP catalytic membrane can be good alternative as catalyst for esterification of oleic acid and methanol for biodiesel synthesis. Acknowledgements This study was financially supported by the Kocaeli University, Scientific Research Projects Unit (Project Number 2015/40). Nomenclature x : Conversion of oleic acid n0 : initial moles of oleic acid ni : the moles of oleic acid at any time Subscripts CS : Chitosan PVP : Polyvinylpyrrolidone SSA : Sulfosuccinic acid FTIR : Fourier transform infrared spectroscopy TGA : Thermogravimetric analysis References Acaroglu M., Biyomotorin Yakıtı, Alternatif Enerji Kaynakları, Atlas Yayın Dagıtım, 75-78, , (2003). Caetano C.S., Caiado M., Farinha J, Fonseca I.M., Ramos A.M., Vital J., Castanheiro J.E., Esterification of free fatty acids over chitosan with sulfonic acid groups, 230, , (2013). Fig. 6. Effect of reaction temperature on oleic acid conversion The conversion of oleic acid increased with the rise of the temperature. The conversion value of acid increases from 39% to 55% when the reaction temperature was changed from 45 o C to 55 o C (Fig. 6), and the final conversion of oleic acid increases from 55% to 65% at 65 o C (Fig. 6). It is well known that the increase of temperature can make easier molecular motion and increase the kinetic energy of the Chen Y., Zhang X., Dong M., Wu Y., Zheng G., Huang J., Guan X., Zheng X., MCM-41 immobilized 12-silicotungstic acid mesoporous materials: Structural and catalytic properties for esterification of levulinic acid and oleic acid, Journal of the Taiwan Institute of Chemical Engineers, 61, , (2016). Colucci J.A., Borrero E.E., and Alape F. Biodiesel from an Alkaline Transesterification Reaction of Soybean Oil Using Ultrasonic Mixing, Journal of the American Oil Chemists' Society, 82, , (2005). Devi D.A., Smitha B., Sridhar S., Aminabhavi T.M., Novel crosslinked chitosan/poly(vinylpyrrolidone) 814
370 blend membranes for dehydrating tetrahydrofuran by the pervaporation technique, Journal of Membrane Science, 280, 45 53, (2006). Hasan Z., Yoon J.W., Jhung S.H., Esterification and acetylation reactions over in situ synthesized mesoporous sulfonated silica, Chemical Engineering Journal, 278, , (2015). Kusdiana D., Saka S., Kinetics of transesterification in rapeseed oil to biodiesel fuel as treated in supercritical methanol, Fuel, 80, , (2001). Marchetti J.M., Errazu A.F., Esterification of free fatty acids using sulfuric acid as catalyst in the presence of triglycerides, Biomass and Bioenergy, 32, , (2008). Nascimento L.A.S., Tito L.M.Z., Angélica R.S., Costa C.E.F., Zamian J.S., Filho G.N.R., Esterification of oleic acid over solid acid catalysts prepared from Amazon flint kaolin, Applied Catalysis B: Environmental, 101, , (2011). Rashid U., Anwar F., Moser B.R., Ashraf S.,Production of sunflower oil methyl esters by optimized alkali-catalyzed methanolysis, Biomass and Bioenergy, 32, , (2008). Tsai H.S., Wang Y.Z., Properties of hydrophilic chitosan network membranes by introducing binary crosslink agents, Polymer Bulletin 60, (2008). Wang B.L., Liu X.S., Ji Y., Ren K.F., Ji J., Fast and long-acting antibacterial properties of chitosan-ag/polyvinylpyrrolidone nanocomposite films, Carbohydrate Polymers, 90, 8 15, (2012). Yang J., Zhou L., Guo X., Li L., Zhang P., Hong R., Qiu T., Study on the esterification for ethylene glycol diacetate using supported ionic liquids as catalyst: Catalysts preparation, characterization, and reaction kinetics, process, Chemical Engineering Journal, 280, , (2015). Zhang X.H., Liu Q.L., Xiong Y., Zhu A.M., Chen Y., Zhang Q.G., Pervaporation dehydration of ethyl acetate/ethanol/water azeotrope using chitosan/poly (vinyl pyrrolidone) blend membranes, Journal of Membrane Science, 327, , (2009). 815
371 Characterization of Bio-Oil Obtained from a Food Industry Waste Pyrolysis Nurgul Ozbay 1*, Elif Yaman 2, Adife Seyda Yargic 1, Rahmiye Zerrin Yarbay Sahin 1 1 Bilecik Şeyh Edebali University, Faculty of Engineering, Chemical and Process Engineering Department, Gulumbe Campus, Bilecik, 11210, Turkey 2 Bilecik Şeyh Edebali University, Central Research Laboratory, Gulumbe Campus, Bilecik, 11210, Turkey * [email protected] Abstract This study aims investigating physicochemical properties and pyrolysis characteristics of banana peel. Characterization of bio-oil obtained from banana peel pyrolysis is also examined. The physicochemical properties were determined by ASTM methods, elemental analysis, Fourier Transform Infrared Spectroscopy (FT-IR), Scanning Electron Microscopy-Energy-dispersive X-ray spectroscopy (SEM-EDX) and Thermogravimetric Analysis (TGA). Physicochemical analysis results showed that banana peel has high volatile matter content and high calorific value. While considering the infrared spectra, the bands identical to aliphatic and aromatic compounds have been determined. Thermal behaviour obtained from TGA is clarified by the components of banana peel. Banana peel is mainly consists of hemicellulose, cellulose and lignin like all other lignocellulosic biomasses. Banana peel was pyrolysed in a fixed-bed reactor under different final temperature conditions to determine the role of final temperature on the product yields and liquid product composition with a heating rate of 10 o C/min. Final temperature range studied was between 400 and 700 o C and the highest liquid product yield was obtained at 550 o C. While the oil yield was 24.94% at the pyrolysis temperature of 400 o C, it appeared to go through a maximum of 28.03% at the final temperature of 550 o C. Liquid product obtained at optimum final temperature conditions was characterized by FT-IR analysis to determine fonctional groups of bilo-oil. Gas chromatography/mass spectrophotometer (GC-MS) was also achieved on n-pentane fraction of the bio-oil. Characterization showed that bio-oil could be a potential source for synthetic fuels and chemical feedstock. Keywords: Banana peel, pyrolysis, bio-oil, characterization. I. Introduction Due to the fossil fuel scarcity and to population increases, there is an urgent search for new energy resources. Renewable energy resources can replace fossil fuels (Patel and Kumar, 2016). Among renewable energy resources biomass has an important role because of being the world's largest and most sustainable energy resource, with an estimated Mg of dry biomass worldwide annually (Encinar et al., 2000; Zhang et al., 2010; Torres et al., 2007; Azargohar et al., 2013). In 2050 s biomass could provide approximately 38% of the world's direct fuel and 17% of the world's electricity, inferentially. Biomass has been approved as a major world renewable energy resource to supplement declining fossil fuel resources, and it is a renewable resource with large potential, economic viability and various social and environmental benefits (Yorgun and Yıldız, 2015; Bertero et al., 2014; Wei et al., 2006; Aysu and Küçük, 2014). Biomass is an organic hydrocarbon consists of carbon, hydrogen, oxygen, nitrogen, and sulfur, though sulfur and nitrogen are present only in insignificant amounts. Biomass also contains some inorganic impurities such as ash. Ash concentration is about 5 10% and 1% by weight in agricultural residues and softwood, respectively (Patel and Kumar, 2016). Lignocellulosic biomass can be convert value added products by using varying processes. Pyrolysis is a low-cost thermochemical process among these processes that takes place at atmospheric pressure and moderate temperatures (usually o C). Pyrolysis liquid product is known as bio-oil. Gaseous (mainly CO2 and CO) and solid (char) products are also produced (Stephanidis et al., 2015). Biomass type, particle size, biomass pretreatment, pyrolysis temperature, pressure, heating rate, residence time, reactor configurations and processes are important pyrolysis procedure parameters. These parameters have affected the yields and compositions of pyrolysis products (Kan et al., 2016). This paper aims to investigate effect of pyrolysis temperature on the pyrolysis of banana peel. Banana peel was selected as biomass feedstock due to its high volatile matter content and high calorific value. The optimum pyrolysis temperature was specified in beginning. Bio-oil characterization was also done for the optimum pyrolysis temperature. II. Experimental Facility II.1. Biomass feedstock Banana peel was selected as feedstock for the experimental pyrolysis run. The feedstock obtained 816

372 from southern region of Turkey. Air-dried banana peel was ground in a high speed rotary cutting mill and sieved to give average particle size. ASTM Standart Test Methods used to investigate proximate analysis. The weight fraction of moisture content was measured in Sartorius MA 150 moisture analyzer. The ultimate analysis of banana peel was performed in an elemental analyzer (Leco CHN628 Series). The calorific value of banana peel was calculated by Dulong formula (Harker and Bakhurst, 1981). Fourier Transform Infrared Spectroscopy (FTIR; Perkin Elmer Spektrum 100), Scanning Electron Microscopy (SEM; Zeiss Supra 40VP) and thermogravimetric analyzer (TGA; Seteram LabSysEvo) were used to characterize banana peel sample. II.2. Setup The reactor made of 316 stainless steel was used for pyrolysis experiments and externally heated by an electric furnace with the temperature being controlled by the thermocouples inside the bed (Fig.1). In the first, to determine the effect of the pyrolysis temperature on the banana peel pyrolysis yields, 15 g of air-dried biomass was placed in the reactor and the temperature was raised at 10 C min -1 to a final temperature of 400, 450, 500, 550 and 700 o C. The reactor held at desirable temperature for a minimum of 20 min. The liquid phase was collected in a glass liner located in a cold trap maintained at about 0 C. The liquid phase consisted of aqueous and oil phases which were separated and weighed. After pyrolysis, the solid char was removed and weighed, and then the gas yield was calculated by the difference. III. Results and discussions III.1. Characterization of biomass The properties of banana peel, investigated in this study, are given in Table 1. Banana peel consists of 9.49% moisture, 62.62% volatile matter, 24.28% lignin, 40.15% cellulose. The weight fractions of carbon, hydrogen and oxygen were found 39.95%, 7.06% and 52.28%, respectively. Using elemental analysis results, calorific value of banana peel calculated as Mj/kg. Table 1. Proximate and elemental analysis of banana peel Proximate Analysis (%) Moisture 9.49 Volatile matter Fixed carbon Ash Extractives Hemicellulose Lignin Cellulose Holocellulose Oil 8.65 Elemental analysis (%) Carbon Hydrogen 7.06 Nitrogen 0.71 Oxygen H/C 2.12 O/C 0.98 Calorific value (MJ/kg) The FT-IR spectrum of banana peel which shows various surface functional groups is shown in Fig. 2. Fig. 1: Slow pyrolysis reactor II.2. Characterization of bio-oils Bio-oil obtained from the pyrolysis experiments in optimum conditions was characterized by using various techniques. Elemental analysis of bio-oil was performed and the calorific value of bio-oil was calculated by Dulong s formula. The bio-oil analysed for its functional group compositional analysis using FT-IR. In addition, column chromatography was employed and the yields of the sub-fractions were calculated. Gas chromatography-mass spectrometry (GC/MS), in Shimadzu QP 2010 chromatograph (equipped with a FID detector) connected to a mass spectrometer was achieved on n-pentane fractions. 817 Fig.2. FTIR spectrum of banana peel The wide peak at around 3300 cm -1 is attributed to hydroxyl groups or absorbed water. The bands located at around 2856 and 2792 cm 1 correspond to C H stretching vibrations in methyl and methylene groups. Carbonyl (C=O) groups appear as a band at 1720 cm -1. The band at 1240 cm 1 and a relatively intense band at about 1040 cm 1 can be assigned to C O streching vibrations in alcohols, phenols, or ether or ester groups. The C H out-of-plane bending vibrations in benzene derivative cause the bands at 894 and 841 cm 1. It could be determined that the banana peel include oxygen groups, carbonyl groups,
373 ethers, esters, alcohols, and phenol groups. Fig.3 shows the SEM images of banana peel which has laminar porous structure. According to applied EDX analysis, banana peel has potassium in addition to carbon and oxygen. Fig.3. SEM Images of Banana peel a) 500x, b)1000x Devolatilization step is an important stage in the conversion processes. TGA is one of the major thermal analysis techniques used to study the thermal behavior of carbonaceous materials. The results of TGA, DTG and heat flow curves of the banana peel are given in Fig. 4. The TGA of the biomass revealed an initial weight loss between 105 and 180 C. This could be due to the vaporization of physically absorbed water resulting with the moisture content of the sample. Devolatilization began at about 200 C and removal of volatiles was completed at about 950 C. After 950 C, there is no further weight loss, essentially. Devolatilization took place mainly between 200 and 450 C and gave a maximum at 300 C. This specified that the main pyrolysis reactions including depolymerization, decarboxylation and cracking took place over the given temperature range. reaction also can be seen from the DTA curves. The peak at 300 C shows the decomposition of hemicellulose and cellulose by exothermic reactions. III.2. Pyrolysis experiments and characterization of bio-oil Fig. 5 shows the product yields for the pyrolysis of banana peel in relation to final temperature of pyrolysis at heating rates of 10 o C min -1. While the oil yield was % at the pyrolysis temperature of 400 o C, it appeared to go through a maximum of 28.03% at the final temperature of 550 o C. Then at the final pyrolysis temperature of 700 o C, the oil yield decreased to 20.19%. Fig.5. Effect of temperature on product distrubition The weight fractions of carbon, hydrogen and oxygen were specified 44.67%, 4.90% and 48.79% by weight, respectively. The higher heating value of bio-oil was also calculated as Mj/kg. The IR spectrum of the bio-oil is given in Fig. 6. The O H stretching vibrations between 3200 and 3400 cm -1 indicate the presence of phenols, alcohols. The C H stretching vibrations between 2800 and 3000 cm -1 and C H deformation vibrations between cm -1 indicate the presence of alkanes. The C=O stretching vibrations with absorbance between cm -1 i ndicate the presence of ketones or aldehydes. Fig.4. TG and DTG curves of banana peel The lower temperature of DTG peak of banana peel mainly represents the moisture, while the higher temperature of DTG peak represents degradation of hemicellulose and cellulose. Decompositions of cellulose and hemicellulose cause the formation of organic volatiles, whereas devolatilization of lignin enhances the formation of char. Lignin decomposition occurred throughout the temperature in the range of C, but the main area of weight loss occurs at higher temperatures. These explanations were made clearer by the DTA results. Thus, the removal of water adsorbed to the structure by endothermic 818 Fig.6. FTIR spectrum of bio-oil Chemical class composition of the bio-oil was determined by liquid column chromatographic fractionation. The columns used were packed with silica-gel mesh, pretreated at 600 C for 8 h
374 prior to use. The column was eluated successively with pentane, toluene, ether and methanol to produce aliphatic, aromatic, ester and polar fractions, respectively. The results of the column chromatography of the oil are given in Table 4. The results of the adsorption chromatography of the oil showed that the pyrolysis oil consists of 77.27% n-pentane solubles. The aliphatic, aromatic and polar fractions of the oil are 38.38%, 34.62% and 27%, respectively. Table 2. Results of the column chromotography for the bio-oil Chemical class (wt.%) Pentane insoluables Asfaltens Pentane soluables Aliphatics Aromatics Polars GC/MS chromatogram of the n-pentane subfractions of bio-oil obtained from pyrolysis of banana peel at 550 o C is shown in Fig.7. The majority of the linear chain hydrocarbons were distributed in the range of C11 C20. The lighter ones may have escaped by the evaporation of solvent during fractionations. The results of GC/MS chromatogram are confirming that the hydrocarbons of the pentane sub-fraction of the bio-oils are mixtures of alkanes and alkenes. C.A., Calandri E.L., Sedran U., Characterization of the liquid products in the pyrolysis of the residual chañar and palm fruit biomasses, Fuel, 116, , (2014). Encinar J.M., Gonzáles J.F., Gonzáles J., Fixed-bed pyrolysis of Cynara cardunculus L., product yields and compositions, Fuel Process Technol., 68, (2000). Harker, J.H., Backhurst, J.R. Fuel and Energy 120, Academic Press Inc., London, (1981). Kan T., Strezov V., Evans, T.J., Lignocellulosic biomass pyrolysis: A review of product properties and effects of pyrolysis parameters, Renewable and Sustainable Energy Reviews 57, (2016). Patel, M., Kumar, A., Production of renewable diesel through the hydroprocessing of lignocellulosic biomass-derived bio-oil: A review, Renewable and Sustainable Energy Rewievs, 58, , (2016). Stefanidis, S.D., Heracleous E., Th.Patiaka D., Kalogiannis K.G., Michailof, C.M., Lappas A.A., Optimization of bio-oil yields by demineralization of low quality biomass, Biomass and Bioenergy 83, (2015). Torres W., Pansare S.S., Goodwing J.G., Hot gas removal of tars, ammonia, and hydrogen sulphide from biomass gasification gas, Catal. Rev., 49, (2007). Wei L., Xu S., Zhang L., Zhang H., Liu C., Zhu H., Liu S., Characteristics of fast pyrolysis of biomass in a free fall reactor, Fuel Process. Technol., 87, (2006). Fig.7. GC/MS chromatogram of n-pentane subfraction of bio-oil Zhang L., Xu C.C., Champagne P., Overview of recent advances in thermochemical conversion of biomass, Energy Convers. Manage., 51, (2010). Acknowledgements This research was supported by Bilecik Şeyh Edebali University Scientific Research Projects Council. References Aysu T., Küçük M.M., Biomass pyrolysis in a fixed-bed reactor: effect of pyrolysis parameters on product yields and characterization of products, Energy, 64, (2014). Azargohar R., Jacobson K.L., Powell E.E., Daloi A.K., Evaluation of properties of fast pyrolysis products obtained from Canadian waste biomass, J. Anal. Appl. Pyrolysis, 104, (2013). Bertero M., Gorostegui H.A., Orrabalis C.J., Guzmán 819
375 Synthesis Gas Production from Tri-Reforming and Partial Oxidation of Simulated Biogas over Ni/ZrO2-MgO-Al2O3 Merve Dogan 1*, Emel Engintepe 1,2, Orhan Ozcan 1,2, Murat Efgan Kibar 1,2, Ayse Nilgun Akin 1,2 1 Kocaeli University, Department of Chemical Engineering, Kocaeli, 41380, Turkey 2 AYARGEM, Alternative Fuels R&D Center, Kocaeli University, Kocaeli, 41040, Turkey * [email protected] Abstract This study focused on the tri-reforming and partial oxidation of simulated biogas over Ni/MgO-Al2O3- ZrO2 catalysts (nickel content: 5 wt.%, 10 wt.%, 15 wt.%, 20 wt.%, 25 wt.%) which were prepared by wet impregnation method. The reactions performed in a tubular fixed bed quartz reactor at 800 C under atmospheric pressure. The catalysts were studied under the reaction conditions of the feed gas molar ratios of CH4/CO2/O2/H2O = 1/0.67/0.1/0.3 and CH4/CO2/O2 = 1/0.67/0.17. The results showed that gave the highest CH4 and CO2 conversion was obtained with 20%Ni/10%MgO-30%Al2O3-60%ZrO2 catalyst. Keywords: Hydrogen production, catalysts, biogas, tri-reforming, partial oxidation I. Introduction Currently, hydrogen is commonly generated by steam reforming of fossil fuels. Due to fast depletion of fossil fuel, development of new processes based on renewable energy sources is needed (Izquierdo, 2012). Biogas can be produced by anaerobic digestion of biomass. Composition of biogas depends on the type of biomass used, but CH4:CO2 ratio is always higher than 1. Carbon dioxide and methane which are major greenhouse gases are consumed in the biogas reforming processes. Through dry reforming of biogas, synthesis gas with a low H2/CO ratio can be produced by equation 1. DR: CH4+CO2 2CO+2H2 Hᵒ298=247.3kJ/mol (1) High energy demand and coke deposit on catalyst surface are the major disadvantages of this process. In the case of tri-reforming process, water and oxygen are also fed into the system The major reactions tri-reforming process, including (1), are the following: CH4+0.5O2 CO+2H2 Hᵒ298= 36 kj/mol (2) CH4+H2O CO+3H2 Hᵒ298=206 kj/mol (3) CO+ H2O CO2+H2 Hᵒ298=-41 kj/mol (4) Therefore in tri-reforming process higher H2/CO synthesis gas ratios can be obtained comparing to dry reforming process. In addition to that, the possible coke deposition on the catalyst surface is reduced due to existence of water. Adding O2 into the feed stream, both carbon formation on the catalyst surface and energy demand for the process decrease significantly. Due to high surface area, high mechanical strength and low price, alumina was used as a convenient support for Ni-based catalysts. However, conventional Ni/Al2O3 catalyst fast deactivates because of carbon deposition (Sajjadi, 2015). Basic supports may be suppressed coke formation due to an increased in CO2 activity. Supports such as CeO2 and/or ZrO2 are attractive to use due to their high oxygen storage capacity and thermal stability. Furthermore, due to the perfect redox features, they can enhance the stability of the catalyst under both oxidizing and reducing atmospheres. In this study, Ni/10%MgO-30%Al2O3-60%ZrO2 catalysts with various Ni loadings (5wt.%-25wt.%) were prepared and studied under the reaction conditions of the feed gas molar ratios of CH4/CO2/O2/H2O = 1/0.67/0.1/0.3 and CH4/CO2/O2 = 1/0.67/0.17. II. Experimental II.1. Catalyst preparation Firstly, Zr(OH)4 (Sigma-Aldrich) was calcinated to obtain ZrO2 support. Secondly, an appropriate amount of Mg(NO3)2.6H2O (Sigma-Aldrich) was solved in deionized water and impregnated to ZrO2 under mixing at 70 C. Slurry was dried at 120 C for 15 h. Obtained powder was calcined at 850 C for 5 h. After that, calculated amount of Al(NO3)3.9H2O (Merck) was solved in deionized water and impregnated to ZrO2-MgO with the same procedure and obtained ZrO2-MgO-Al2O3 support material. Later, calculated amount of Ni(NO3)2.6H2O was solved in deionized water and impregnated to this support with the same procedure. 820
 was fed. Figure 1 and 2 shows schematic diagrams of reaction systems.")
376 II.2. Catalyst testing Partial oxidation and tri-reforming of biogas reactions were carried out to prepared Ni/ZMgO-Al2O3-ZrO2 catalysts. For all the experiments a model biogas consisting of 60% CH4 and 40% CO2 (vol.) was fed. Figure 1 and 2 shows schematic diagrams of reaction systems..the reactions were performed in a tubular fixed bed quartz reactor (i.d =8mm) at 800 C under atmospheric pressure. Before running the activity tests, each catalyst was reduced for 1 h at 1123 K, using 40 ml/min of H2. After reduction, system is cleaned with N2 for 1 h. The catalysts were studied under the reaction conditions of the feed gas molar ratios for tri-reforming was CH4/CO2/O2/H2O = 1/0.67/0.1/0.3 and CH4/CO2/O2 = 1/0.67/0.17 for partial oxidation. Heating of the reactor was provided by an oven, which was controlled by a programmable temperature controller. The temperature of the catalyst bed was measured by a K-type thermocouple placed within a quartz tube well in the middle of the bed. The gaseous feed was controlled by mass flow controllers (Teledyne Hastings HFC202). The products of the reactions were analyzed by a gas chromatograph (Agilent 7890B) equipped with both a FID and TCD. The results were reported in terms of CH4 conversion (XCH4), CO2 conversion (XCO2) and hydrogen to carbon monoxide ratio (H2/CO) as defined below equations. (V CH 4in - V CH 4out) X CH 4 (%) = 100 CH 4 in V (VCO2 in - V CO2 out) X CO 2 (%) = 100 CO2 in V H2 out H 2/CO = V CO out V Vin i corresponds to the volumetric flow-rate of reactant i (ml/min). Vout i corresponds to the volumetric flow-rate of product i (ml/min). Fig. 2: Shematic diagram for tri-reforming of biogas reactions. 1-Mass flow controller, 2- Quartz reactor, 3-Catalyst bed, 4-Furnace, 5-Cold trap,6-hplc Pump,7-Heater tape III. Results and discussion Table 1 and 2 shows the catalyst activity results of the catalyts for both partial oxidation and tri-reforming reactions, respectively. The results indicate that CH4 conversion increased with increasing nickel loading. But, for higher than 20 wt.% Ni contents, CH4 conversion decreased for both partial and tri-reforming processes. These results are aggrement with literature (Meshkani, 2013, Titus, 2015). It is known that formation of NiO-MgO solid solution, lead to strong interaction between NiO and MgO, and this causes retardation of NiO reduction to Niᵒ (Meshkani, 2013). Also, it is known that the extent of NiO incorporation in the NiO MgO solid solution depended on the Ni content. With higher nickel content such as 10% a part of NiO could be incorporated in to the lattice of the MgO, and the excessive NiO remained in a form of free NiO. On other hand, for catalysts with low nickel content, little quantity of NiO reduces to metallic nickel. Therefore, less amount of active sites will be occured on the catalyst with lower nickel loading and by increasing in nickel content, amount of reducible active sites will be increased. Tab. 1: Activity resuts for partial oxidation of model biogas CATALYST % CH 4 % CO 2 H 2/CO 5%Ni/60%ZrO 2-10% MgO-30%Al 2O 3 10%Ni/60%ZrO 2-10% MgO-30%Al 2O 3 15%Ni/60%ZrO 2-10% 90,8 92, MgO-0%Al 2O 3 20%Ni/60%ZrO 2-10% MgO-30%Al 2O 3 25%Ni/60%ZrO 2-10% MgO-30%Al 2O Tab. 2: Activity resuts for tri-reforming of model biogas CATALYST % CH 4 % CO 2 H 2/CO Fig. 1: Shematic diagram for partial oxidation of biogas reactions. 1-Mass flow controller, 2- Quartz reactor, 3-Catalyst bed, 4-Furnace, 5-Cold trap 10%Ni/60%ZrO2-10%MgO- 30%Al 2O 3 15%Ni/%60ZrO 2-%10MgO- %30Al 2O 3 20%Ni/%60ZrO 2-%10MgO- %30Al 2O 3 25%Ni/%60ZrO 2-%10MgO- %30Al 2O
377 IV. Conclusion Partial oxidation and tri-reforming of model biogas to syngas have carried out over Ni catalysts with various nickel loadings Ni/60%ZrO2-10%MgO-30%Al2O3. It was observed that nickel effect positively on the activity of catalysts and 20%Ni/60%ZrO2-10%MgO-30%Al2O3 showed the highest activity in investigated processes. Acknowledgements This work was funded by Kocaeli University Research Fund with project number 2014/29. Nomenclature FID TCD DR : Flame Ionization Detector : Thermal Conductivity Detector : Dry Reforming References Izquierdo U., Barrio V.L., Requies J., Cambra J.F., Güemez M.B., Arias P.L., Tri-reforming: A new biogas process for synthesis gas and hydrogen production, International Journal of Hydrogen Energy, 38, , (2013). Meshkani F., Rezaei M., Andache M., Investigation of the catalytic performance of Ni/MgO catalysts in partial oxidation, dry reforming and combined reforming of methane, Journal of Industrial and Engineering Chemistry, 20, , (2014). Sajjadi S.M., Haghighi M., Rahmani F., Sol-gel synthesis of Ni-Co/Al2O3-MgO-ZrO2 nanocatalyst used in hydrogen production via reforming of CH4/CO2 greenhouse gases, Journal of Natural Gas Science and Engineering, 22, 9-21, (2015). Titus J., Roussièreb T., Wasserschaffb G., Schunkb S., Milanovc A., Schwabc E., Wagnerd G., Oecklerd O., Gläser R., Catalysis Today, (2015). 822
378 Partial Oxidation of Biogas for Hydrogen Production over Ce-Promoted Ni/Mgal Hydrotalcite-Like Catalyst Emel Engintepe 1,2*, Merve Dogan 1, Orhan Ozcan 1,2, Murat Efgan Kibar 1,2, Ayse Nilgun Akin 1,2 1 Kocaeli University, Department of Chemical Engineering, Kocaeli, 41380, Turkey 2 AYARGEM, Alternative Fuels R&D Center, Kocaeli University, Kocaeli, 41040, Turkey * [email protected] Abstract In this study, the partial oxidation of model biogas over a Ce-promoted Ni/MgAl hyrotalcite-like catalyst (10 wt Ni,5 wt.% Ce) prepared by wet impregnation and coprecipitation methods was studied. The reaction conditions were determined as; the feed gas molar ratios CH4/CO2/O2:1/0.67/ with different O2 amounts, 800 C and atmospheric pressure. BET and XRD analysis were performed to determine the catalyst structure. For all experiments, a model biogas (molar composition: 60% CH4 and 40% CO2) was fed and catalytic activities were measured in a fixed bed reactor system at 1073 K with fixed CH4/CO2 molar ratio and different O2/CH4 molar ratios (0,05-0,3), atmospheric pressure. The results showed that CH4 conversion increased and CO2 conversion decreased when oxygen was added to feed. Besides, H2/CO molar ratio increased with increasing oxygen amount. The optimal molar ratio of O2/CH4 was 0.20, the conversions of CH4 and CO2 could reach 95% and 84%, respectively. Also H2/CO molar ratio reached 1.35 with 0.20 molar ratio of O2/CH4. Keywords: Biogas, Partial oxidation, Hydrogen production, Syn-gas I. Introduction Hydrogen is recognized as a clean carrier for sustainable energy generation. It can be utilized commonly in energy and chemical industries Pino (2014). Partial oxidation of biogas is one of hydrogen production methods. The process includes mixing of dry reforming of methane (DRM) (Eq. (1)), and partial oxidation of methane (Eq. (2)) (POM) in one step, generating syngas with desired H2/CO ratio by changing feed gas ratio. CH4+CO2 2CO+2H2 Hᵒ298= 247.3kJ/mol (1) CH4+0.5O2 CO+2H2 Hᵒ298= 36.6kJ/mol (2) Biogas has a characteristic composition of vol% CH4, vol% CO2 with little quantity of N2, O2, H2S, as well as trace amounts of NH3 with organic compounds Pino (2014). Due to endothermic DRM reaction, energy requirement is excessive. The high energy requirement leads to high costs and prevent commercialization of DRM process. To cope with this obstacle, DRM reaction can combine with an exothermic reaction such as partial oxidation of methane (POM). The combination of these reactions (DRM and POM reaction) can minimize the amount of energy demand and also it can decrease the amount of coke formation according to Eq. (3), Oemar (2015). Cads + O2 CO2 Hᵒ298 = kj/mol (3) As indicated broadly in literature, noble metals (Rh, Ru, Pt, Pd, Ir) are used as catalyst in the reforming reactions. Also Nickel-based catalysts are the most studied catalytic systems in literature Pino (2014). Ni-based catalysts are normally less active than noble metals and subject to morefast deactivation by coke formation and sintering of metallic Ni active phase at high temperatures. The coke formation rate decreases in following order: Ni >> Rh > Ir = Ru > Pt = Pd at 773 K and Ni > Pd = Rh > Ir > Pt >> Ru at 923 K Oemar (2015). Nevertheless, in consequence of its low cost (only 1/150 1/100 of that of noble metals), Ni is the most commonly used metal. In many Ni-based catalysts, derived from hydrotalcite-type precursors show perfect performance for methane reforming due to their attractive features such as large surface area, basic property etc Qi (2015). In this work, Ce-promoted Ni/MgAl Hydrotalcite-like catalyst were prepared and tested in the reaction system of partial oxidation. There is no information in literature about partial oxidation of biogas over Ce-promoted Ni/MgAl Hydrotalcite-like catalyst. Therefore, this catalyst was chosen to measure catalytic activity in the reaction system. XRD and N2-physisorption techniques have been used to characterize the structural properties of the catalyst. II. Experimental II.1. Catalyst preparation Hydrotalcite-like catalyst supports were prepared by coprecipitation method. Nitrates of metals were dissolved in 200 ml of deionised water. The metal solution was added by dripping on 200 ml of a 823
379 Na2CO3 solution at 60 o C and ph 10. The suspension was aged for 18h at 60 o C. The remaining solid was washed with deionised water, and dried for 18 h at 110 o C. All prepared catalyst supports were calcined at 900 o C for 5 h to obtain the hydrotalcite-like catalysts. Ni with content of wt%10 and Ce with wt%5 were impregnated sequentially onto the support. Ni(NO3)2.6H2O (Merck) and Ce(NO3)3.6H2O (Merck) was used. The samples were dried for 18 h at 110 o C followed by calcination at 900 o C for 5h. II.2. Catalyst testing Partial oxidation of biogas was carried out to test the activity of %5 Ceria-promoted %10Ni/MgAl hydrotalcite-like catalyst. For all experiments a model biogas consisting of 60% CH4 and 40% CO2 (vol.) was fed to the reactor. Schematic diagram of reaction system was shown in Fig.1. The reactions were performed in a tubular fixed bed quartz reactor (i.d =8mm) at 800 C under atmospheric pressure. Before running activity tests, each catalyst was reduced in situ for 1 h at 1173 K, at a flow of 40 ml/min of H2. The catalysts were studied under the reaction conditions of the feed gas molar ratios of CH4/CO2/O2 = 1/0.67/0.05-0,3 with different O2 molar ratio. Heating of the reactor was provided by an oven, which was controlled by a programmable temperature controller. The temperature of the catalyst bed was measured by a K-type thermocouple placed in the middle of the bed. The gaseous feed was controlled by mass flow controllers (Teledyne Hastings HFC202). The products of the reactions were analyzed by a gas chromatograph (Agilent 7890B) equipped with both a FID and TCD. The results were reported in terms of CH4 conversion (XCH4), CO2 conversion (XCO2) and hydrogen to carbon monoxide ratio (H2/CO): (V CH 4in - V CH 4out) X CH 4 (%) = 100 CH 4 in V (VCO2 in - V CO2 out) X CO 2 (%) = 100 VCO2 in V H2 out H 2/CO = V CO out Vin i corresponds to the volumetric flow-rate of reactant i (ml/min). Vout i corresponds to the volumetric flow-rate of product i (ml/min). III. Results and discussion III.1. Characterization of catalyst The X-ray Diffraction (XRD) analysis of the prepared catalyst was conducted by using a Rigaku Miniflexs II diffractometer equipped with a Cu Kα radiation. The XRD patterns of catalyst and hydrotalcite-like support were given in Fig.2. It was observed from XRD patterns that the hydrotalcite-like catalyst has periclase phase (Mg(Ni,Al)O) and the fluorite phase (CeO2). Diffraction patterns showed the properly occurance of periclase-type phase (incorporation of nickel species into the brucite-like layers) and the presence of a separate Ce-phase in the Ce-promoted catalysts. Fig. 2: XRD patterns of Ni10Ce5/MgAl catalyst and MgAl support ( CeO2, Mg(Ni,Al)O periclase-type phase) N2 physisorption of the catalyst was measured with Micromeritics ASAP The surface area was determined by the BET method. Tab.1 shows the surface area and pore volume of catalysts. It was observed that the addition of Ni and Ce decreases the BET surface area and pore volume of the catalyst as expected. Tab. 1: The BET surface area and pore volume of %5 Ceria-promoted %10Ni/MgAl catalyst and MgAl support Surface Area Pore volume Sample (BET) (m 2 /g) (cm 3 /g) MgAl (support) %5 Ceria-promoted % Ni/MgAl catalyst III.2. Catalyst activity measurements The effect of oxygen amount on the catalytic performances of %5 Ceria-promoted %10Ni/MgAl hydrotalcite-like catalyst was investigated, and the results were shown in Figures 3-5. Fig. 1: Shematic diagram of experiment. 1-Mass flow controller,2- Quartz reactor, 3-Catalyst bed, 4-Furnace, 5-Cold trap 824 As shown in Fig.3, When 0.05 molar ratio of O2/CH4 was used, CH4 conversion was obtained 77.5%. CH4 conversion increased with increasing amount of O2/CH4 and reached 96.8% when the molar ratio of O2/CH4 was 0.3.
380 IV. Conlusion Fig. 3: The effect of different added amount of oxygen on the CH4 conversion. Reaction conditions: T=800 0 C; CH4:CO2 =1:0,67 As shown in Fig.4, CO2 conversion decreased when the amount of oxygen in feed was increased. The addition of oxygen could enhance the conversion of CH4. Therefore, CO2 reacts with less amount of CH4 which leads to decrease in CO2 conversion. In this study, hydrotalcite-like materials promoted with ceria were prepared and performance tests were conducted for partial oxidation of model biogas at 800 C. Hydrotalcite-like structure was confirmed in the catalyst structure from XRD results. Ceria (wt.%5) promoted wt.%10 Ni/MgAl hydrotalcite-like catalyst showed good catalytic activity for the partial oxidation of the model biogas to syngas. The results showed that the addition of oxygen in feed streams was increased CH4 conversion and H2/CO ratio but decreased CO2 conversion. Also, H2/CO ratio can be optimized by changing the amount of oxygen in the feed. Acknowledgements This work was funded by Kocaeli University Research Fund with project number 2014/29 Nomenclature DRM POM FID TCD XRD BET : Dry reforming of methane : Partial oxidation of methane : Flame ionazition detector : Thermal conductivity dedector : X-ray diffraction : Brunauer Emmett Teller References Fig. 4: The effect of different added amount of oxygen on the CO2 conversion. Reaction conditions: T=800 0 C; CH4:CO2 =1:0,67 Fig.5 shows the effect of different O2/CH4 molar ratios on the H2/CO molar ratio during the partial oxidation of biogas to produce syngas. If O2/CH4 molar ratio increased from 0.05 to 0.3, H2/CO ratio raised from 1.24 to1.38. This result was in good correlation with the decrease in CO2 conversion because CO is mostly produced by DRM reaction however POM reaction produces less amount of CO than DRM reaction. Oemar U., Hidajat K., Kawi S., Pd-Ni catalyst over spherical nanostructured Y2O3 support for oxy-co2 reforming of methane: role of surface oxygen mobility, international journal of hydrogen energy, 40, , (2015). Pino L., Vita A., Lagana M., Recupero V. Hydrogen from biogas: catalytic tri-reforming process with Ni/La-Ce-O mixed oxides, Applied Catalysis B: Environmental , (2014). Qi Y., Cheng Z., Zhou Z., Steam reforming of methane over Ni catalysts prepared from hydrotalcite-type precursors: catalytic activity and reaction kinetics, Chinese Journal of Chemical Engineering 23, 76 85, (2015). Fig. 5: The effect of different added amount of oxygen on the H2/CO molar ratio. Reaction conditions: T=800 0 C; CH4:CO2 =1:0,67 825
381 Desalination in Algeria, Case of Skikda Seawater Desalination Plant Mounira Rouainia 1 *, Karima Mehri 1 1 Environment and Chemical Engineering Research Laboratory (LGCES) Department of Petrochemistry and Process Engineering University of 20 Août 1955, BP 26 Route El Hadaiek, Skikda, Algeria * [email protected], [email protected] Abstract With few surface water sources to rely on, Algeria has invested heavily in new dams to improve its rain catchment capabilities, but with rainfall increasing low, our country had to face a serious problem of water shortage. In order to alleviate this problem, our government needed to find and invest in a sustainable, long-term water supply that could meet the expanding urban water demand. The Mediterranean Sea offered the only abundant new source of water. Desalination technology enabled our country to use the sea as a virtually unlimited source of raw water that can be reliably and cost-effectively converted to fresh potable water. In our paper, we revew the desalination processes that are implemented in Algeria Since last decades. We focus our study on reverse osmosis process since it is the most used process in Algeria desalination plants.we will especially consider Skikda seawater desalination plant. We will study and valuate the performances of the desalination process used in this plant, basing on physico-chemical and bacteriological analyses and membranes operating parameters follow up. Keywords: Sea water desalination, reverse osmosis process, pretraitments I. Introduction In Algeria, the mobilization of the water resources since independence was centered initially on the underground resources. In front of the fast increase in the requirements of the water due to the increase in population, the improvement of the standard living of the citizens and needs for development, it was necessary to carry out hydraulic installations unceasingly making it possible to mobilize more water to satisfy the total needs (irrigation, industries and need for the population). The mobilization of water undergrounds in the North of the country with reached its maximum threshold. The increase in the flows of pumping of this water will cause overexploitation of the surface tablecloths and the deterioration of the water quality. This situation will penalize of this fact all the sectors (population, industry and agriculture). The pluviometric risks recorded in particular at the time of these last decades unfortunately reduced the awaited impact of the investments carried out. The recourse to the desalination of sea water becomes essential then to make safe the drinking water supply. In 2003, an Interdepartmental Council met for the examination of the bearing file "the policy elements of sea water desalination in Algeria", and to realize AEC (Algerian Energy Company). The foreign investors was launched by the AEC (it is shareholder more than 50%), the program of sea water desalination includes thirteen units distributed through the Algerian coastal cities, to reach the capacity of more than m 3 /j at the end of the Table 1 illustrates some basic information on the current Reverse Osmosis desalination plants in Algeria. II. Desalination processes The process chosen for the desalination plants of sea water realized or in Algeria, is Reverse Osmosis. In general, the technical design of its desalination plants is identical, they exist some characteristics concerning the Hamma plant, the Magtaa plant and that of Souk Tleta. In the case of the Hamma plant, for the pretreatment part, the sand filters are made out of reinforced concrete and are open. With the difference in all the other stations where the sand filters are metal tanks filled with several layers of sands and are closed. In all cases, the desalination plants are equipped with the energy recuperation system of the safe type ERI except for the Magtaa plant which uses the turbo-charge. II.1 Principal stages in the desalination process by Reverse Osmosis Sea water intake: the choice of the Sea water intake depends on underground nature where the desalination station is established, it can be open, by horizontal wells or vertical wells. Pretreatments: They include all the stages necessary upstream of the Reverse osmoses process (filtering, chemical treatment, physical treatment ). For obtaining raw water the good quality, it is determining for the lifespan of the system and to minimize the chemicals as well as the replacement of the membranes. The impact on the 826
, Hydranautics, Osmonics (Desal) and Toray.")
382 performance of the Reverse osmoses process is direct. Reverse osmoses process: the centre piece of the Reverse osmoses process is the Membrane. The Reverse osmoses membranes for the sea water desalination are manufactured by Dow Chemical (Filmtec), Hydranautics, Osmonics (Desal) and Toray. In the Reverse osmoses process, they are mounted in pressure tubes grouped into racks, the number of racks, pressure tubes and membranes depends on the capacity of the plant to be constructed. The post-treatment and/ or finishing steps are necessary to condition water at exit of Reverse osmoses process and to make it thus adequate to consumption. Table 1: Caracterstics of RO desalinations plants in Algeria Designation Region Year of startup Optimal Capacity m 3 /d Delivery price of Amount of investment Partner m 3 USD MUSD Kahrama Arzew Oran August , BLACK- VEACH (South Africa) (5%) El Hamma Alger February , GE Ionics USA (70%) Skikda Skikda March , Geida (Befesa/Sadyt) Spain (51%) Beni-saf Ain December , (Cobra/Sadyt/ Temouchent Befesa) Spain (51%) Fouka Tipaza July , SNC LAVALIN- PREDISA (Canada-Spain) (51%) Mostaganem Mostaganem September , Inima/Aqualia (Spain) (51%) Souk Tleta Tlemcen April , HYFLUX - MALAKOFF (Singapour) (51%) Honaine Tlemcen July , Geida (Befesa/Sadyt (51%) Cap Djenet Boumerdes July , Inima/Aqualia (Espagne) (51%) Mactaa Oran June , HYFLUX - MALAKOFF (Singapore) (51%) Tenes Chleff August , Befesa Spain (51%) Oued Sebt Tipaza Scheduled for December 2016 Echatt El Tarf Scheduled for December Under development Nationals means Under development Nationals means Figure1: Desalination plants in Algeria III. Skikda desalination plant The Skikda desalination plant (GEIDA) was brought into service in March 2009 to satisfy the requirements out of water freed of salt for the petrochemical platform like for the reinforcement and the improvement for the drinking water supply for the city, 827 which counts inhabitants. Based on the Reverse Osmosis principle, it is conceived to primarily de-salt sea water with a capacity of m³/d. by a cost of 0, 7398 USD/m3 (54, 4 DZD/m 3 ). The raw water is led by a sea water catch open at the stage of preprocessing which contains two stages of

383 filtration with sand and anthracite. After cartridge element filter like safety fence before the process of RO. It is conceived with five units independent of RO equipped with the exchangers of pressure as devices with recuperation of the energy. Lastly, post-treatment will be made by means of the dolomite turns to obtain the conditions optimal of quality [Fanj et al., 2009]. III.1. Operating requirements Reverse osmosis SWC5 modules require the following operating conditions: Table 2: operating conditions. b-second stage: the maintains frequency of the station Follow-up of membranes cleaning frequency Follow up of modules replacement rate IV.2.Intake points The intake points are situated as follows: -After cartridge filter (feed water) -Reverse osmoses stage, there are five RO units at Skikda desalination plant (A, B, C, D and E). Samples of permeate and concentrate (brine) are taken in each unit -After post-treatments stage (produced water). V. Results V.1- Station functioning V.1.1-Physico-chemical and bacteriologic analysis Table 3 resumes mean values of physicochemical and bacteriologic analyses results for both feed water, permeate, and concentrate. Table 3: Physicochemical analysis of feed water, the permeate and the concentrate. IV. Experimental evaluation of the process IV.1.Analyses The analyses carried out are the following two stages: a-first stage: Station functioning Physico-chemical and bacteriological parameters -Physicochemical parameters are: The temperature T, hydrogen potential ph, turbidity, conductivity, total dissolved solids TDS, fouling index SDI, free chlorine, hardness TH, hardness of calcium THCa, alkalinity TA and TAC. -Bacteriological parameters: the required and counted bacteria are: Total Coliforms, Fecal Coliforms, and Fecal Streptococcus. Functioning Parameters of RO desalination process: To evaluate membranes performances in the reverse osmosis process, we follow up four essential functioning parameters and indexes informing on membranes performances (Conversion rate Y and Total dissolved solids TDS) and on their eventual fouling (Silt density index SDI and Differential pressure ΔP) 828 We can notice that: -The quality of feed water on the level of the reverse osmoses process meets the standards required by manufacturing membranes. -PH = 6,7 (standards : 3,0-10,0). -Temperature 25 o C (standards max: o C). -Turbidity=0,05NTU (standards max: 1,0 NTU).See fig 3. -Free chlorine < 0,1mg/l (standards max: < 0,1 mg/l). -The RO ability of salts removal is very high. -The rate of salt passage is very low (< 1%) while the rate of salts rejection is extremely high (> 99%). -The rates of ions retention: chlorides (99%), THCa
384 (99,71%), potassium (99,28%), sodium (99,47%) are very high. - As we can see on figure 4, no bacteria exists in the permeate, their elimination is then total. All of those contained in raw water are rejected by membranes towards the brine. This means that polyamide membranes have a good bacterial behavior. From all these results we conclude that the quality of feed water on the level of the reverse osmoses process meets the standards required by manufacturing membranes Figure 3: The average turbidity According to the results of figure 3 one observes that the contents physico-chemical and bacteriological in the drinking water quality standards, which means that the RO desalination process deliver a water of good quality and in conformity with the Algerian standards. V. Conclusion This paper was dedicated to sea water desalination in Algeria. We focused our study on reverse osmosis process since it is the most used process in Algeria desalination plants. We especially considered Skikda seawater desalination plant. Wel studyed the performances of the desalination process used in this plant, basing on physico-chemical and bacteriological analyses and membranes operating parameters evaluation. The results of our follow-up are as follows: -The quality of feed water on the level of the RO process meets the standards required by manufacturing membranes. -Complete elimination of the bacteria by the RO membranes. In conclusion, within sight of the results, we conclude that the RO process used in Skikda desalination plant is safe and reliable. It delivers a physicochemical and bacteriological quality of water in conformity with the standards. References Figure 4: Variation the bacteria concentration. Table3: Produced water quality Parametres produced water Temperature, o C 23 ph 8,1 Turbidity, NTU 1,6 Conductivity, us/cm 453 TDS, mg/l 253 TH, mg/l 63 THCa, mg/l 41 THMg, mg/l 22 TA, mg/l 0 TAC, mg/l 53 Na +, mg/l 39 Cl -, mg/l 190 K +, mg/l 2,9 Fe 2+, mg/l 0 Mn 2+, mg/l 0 SiO2, mg/l 0,16 PO 2-4, mg/l 0,2 NO - 2, mg/l 0 Free chlorine, mg/l 0,5 CO2, mg/l 0 Oxygen dissolved, mg/l 7, Alain MAUREL1998. Osmose inverse in: Les séparations par membrane dans les procédés de l'industrie alimentaire. Lavoisier - Tec & Doc: Mohamed Bessenasse, Ahmed Kettab, Adnane Souffi Moula Seawater desalination : Study of three coastal station in Algiers region. Desalination 250: M.Rouainia, A Mehri, Reliability Study and evaluation of the Reverse Osmosis Process in the Seawater Desalination Station of Skikda. Proceedings of GCGW Int Conf Tomas Fanjul, Almudena Aparicio, Vidal Martin, Rodrigo Segovia 2009, Engineering design of Skikda seawater desalination plant. Desalination and water treatment 7:
385 Performance Enhancement of Ni-based Oxygen Carrier by Adding Other Oxygen Carrier Ho-Jung Ryu 1*, Dong-Ho Lee 1, Chang-Keun Yi 1, Sung-Ho Jo 1, Jeom-In Baek 2 1 Korea Institute of Energy Research, Low Carbon Process Laboratory, 152 Gajeong-ro, Yuseong-gu, Daejeon, 34129, Korea 2 Korea Electric Power Corporation (KEPCO) Research Institute, 105 Munji-ro, Yuseong-gu, Daejeon, 34056, Korea * [email protected] Abstract Chemical-looping combustion (CLC) is a novel combustion technology with inherent separation of the greenhouse gas CO2 and no NOx emission. The chemical-looping combustor consists of two reactors, an oxidation reactor and a reduction reactor. A fuel and an air go through the different reactors. However, fuel conversion and CO2 selectivity in the reduction reactor decreased as the reaction temperature increased within high temperature range (>900 ) due to the increment of exhaust CO concentration from reduction reactor in case of NiO based particle was used as an oxygen carrier in a chemical looping combustion system. To improve reduction reactivity at high temperature range, the applicable metal oxide component was selected by calculation of the equilibrium CO concentrations of metal oxide components at high temperature range. Feasibility of reduction reactivity improvement at high temperature was checked by using solid mixture of the selected metal oxide particle and NiO based oxygen carrier and the reactivity was measured and investigated using batch type fluidized bed. The solid mixture of Co3O4/CoAl2O4 (10%) and OCN (90%) showed higher fuel conversion, higher CO2 selectivity and lower CO concentration than OCN (100%) case. Consequently, we could conclude that improvement of reduction reactivity at high temperature range by adding some Co3O4 based oxygen carrier is feasible. Keywords: Chemical looping combustion, Fuel conversion, CO2 selectivity, Oxygen carrier I. Introduction Carbon dioxide, a major greenhouse gas, is produced in large quantities from combustion of fossil fuels, much of this related to electric power generation. In a conventional power generation system, fuel and air are directly mixed and burned; therefore it is not easy to separate CO2 from flue gas because CO2 is diluted by N2 in air. Chemical-looping combustion (CLC) is a novel combustion technology with inherent separation of the greenhouse gas CO2 and no NOx emission. The chemical-looping combustor consists of two reactors, an oxidation reactor and a reduction reactor. A fuel and an air go through the different reactors. Equations (1) and (2) explain a basic concept of the chemical-looping combustion system. In the reduction reactor, gaseous fuel (CH4, H2, CO or C nh 2n+2) reacts with metal oxide according to the Eq. (2), and release water vapor and carbon dioxide from the top and metal particles (M) from the bottom. The solid products, metal particles, are transported to the oxidation reactor and react with oxygen in the air according to Eq. (1), and produce high-temperature flue gas and metal oxide particles. Metal oxide particles at high temperature are again introduced to the reduction reactor and supply the heat required for the reduction reaction. Between the two reactors, metal (or metal oxide) particles play an important role in transportation of oxygen and heat, therefore the looping material between the two reactors is named as an oxygen carrier particle. Oxidation: exothermic reaction, M O2 MO (1) Reduction: endothermic reaction, CH4 + 4MO CO2 + 2H2O + 4M (2) It is important that the exhaust gas from the reduction reactor contains only highly concentrated CO2 and water vapor. Therefore, CO2 can be easily recovered by cooling the exhaust gas without any extra energy consumption (energy penalty) for CO2 separation. Another advantage of CLC is that NOx formation can be thoroughly eliminated because the oxidation reaction occurs at a considerably lower temperature (~900 o C) without a flame; therefore there is no thermal NOx formation (Ishida and Jin (1996), Jin et al. (1998)). Moreover, the efficiency of chemical-looping combustion system is very high. Wolf et al. (2005) reported that natural gas fueled chemical-looping combustor achieves a thermal efficiency between 52 53% and is 5 percent points more efficient than an NGCC system with state-of-the-art technologies for CO2 capture. There are many reports on the reactivity of oxygen carriers with methane and hydrogen for chemical-looping combustor. The fuel conversion and the CO2 selectivity decreased with increasing reaction temperature within high temperature range (>900 ) due to the increment of exhaust CO concentration from reduction reactor. In this study, the applicable metal oxide component 830
386 was selected by calculation of the equilibrium CO concentration of metal oxide components to improve reduction reactivity at high temperature. After that, feasibility of reduction reactivity improvement at high temperature was checked by using solid mixture of the selected metal oxide particle and NiO based oxygen carrier. II. Experimental OCN particle was used as the NiO based oxygen carrier and Co3O4/CoAl2O4 particle was used as Co based oxygen carrier. Table 1 provides summary of particle properties for two oxygen carriers. Tab.1: Summary of oxygen carrier particles characteristics Particle Metal oxide wt.% Metal oxide Component Supporter Preparation methods Bulk density [g/cm 3 ] OCN NiO Confidential Spray drying Co 3O 4/CoAl 2O 4 70 Co 3O 4 CoAl 2O 4 Coprecipitation Impregnation A schematic of the reactor is shown in Fig.1. The major components consist of a gas input system, the fluidization column, a condenser, a gas cooler, and a gas sampling/analyzing unit. The fluidization column is made by Inconel and is m high with an internal diameter of 0.05 m. Input gases were introduced by MFC and CO, CO2, CH4, H2, NO and O2 concentration were measured by on-line gas analyzer. Simulated syngas (CO 65.1%, CO2 1.51%, H2 29.4% and N2 balance) was used for reduction and air was used for oxidation. Summary of experimental conditions are provided in Table 2. Fig. 1: Schematic of a pressurized fluidized bed reactor. III. Results and discussions Fig. 2 shows effect of temperature on fuel conversion, CO2 selectivity, and CO, CH4, H2, NO concentrations when we used OCN particle as oxygen carrier. High fuel conversion and CO2 selectivity were obtained. However, both fuel conversion and CO2 selectivity were slightly decreased as the reduction temperature increased. These results can be explained by effect of temperature on equilibrium CO composition as shown in Fig. 3. Equilibrium CO composition increased as the reduction temperature increased at any syngas to NiO mole ratio. Tab. 2: Summary of experimental conditions. Item Descriptions or conditions Particle OCN Co3O4/CoAl2O4 Weight [g] (9 : 1) Bulk density [g/cm 3 ] Bed height [m] 0.4 Pressure [bar] 1 Reaction time [min] [Reduction /Purge* /Oxidation /Purge* ] = 10 / - / 30 / - Temperature [ ] Purge gas [Nl/min] N2(2.0) N2(1.92) N2(1.85) Reduction gas, Syngas + N2 [Nl/min] Oxidation [Nl/min] gas * : up to full purge condition Air(2.0) Air(1.92) Air(1.85) Fig. 2: Effect of temperature on fuel conversion, CO2 selectivity, and CO, CH4, H2, NO concentration. To improve reduction reactivity at high temperature range, the applicable metal oxide component was selected by calculation of the equilibrium CO concentrations of metal oxide components at high temperature range. Among the metal components, Fe, Ni, Co, Cu, Mn were selected as candidates for oxygen carrier based on the melting point and atomic(or molecular) weight. Possible oxidized and reduced sates (Fe2O3 Fe3O4, NiO Ni, Co3O4 831
387 CoO, CuO Cu, Cu2O Cu, MnO2 MnO, MnO2 Mn3O4) were listed out. reactivity at high temperature range by adding some Co3O4 based oxygen carrier is feasible. 100 (a) Fuel conversion [%] 99 OCN (90%) + Co 3 O 4 /CoAl 2 O 4 (10%) OCN (100%) (b) Fig. 3: Effect of temperature on equilibrium composition of CO. Fig. 4 shows effect of temperature on the equilibrium CO concentration for those oxidized reduced pairs. As shown in figure, the equilibrium CO concentration decrease in order of NiO Ni, Fe2O3 Fe3O4, Cu2O Cu, CuO Cu, Co3O4 CoO, MnO2 MnO, MnO2 Mn3O4. However, the molecular weight of Mn (MnO2 MnO3) is much higher than that of other metal oxides, and therefore, require high solid circulation rate. Therefore, we conclude that the Co (Co3O4 CoO) is the best oxygen carrier to reduce CO concentration at high temperature condition. CO 2 selectivity [%] Relative CO concentration [%] OCN (90%) + Co 3 O 4 /CoAl 2 O 4 (10%) OCN (100%) OCN (90%) + Co 3 O4/CoAl 2 O 4 (10%) OCN (100%) (c) Fig. 5: Comparison of (a) fuel conversion, (b) CO2 selectivity, (c) relative CO concentration with temperature. IV. Conclusions Temperature [ o C] Fig. 4: Calculated equilibrium CO concentration with temperature. Finally, feasibility of reduction reactivity improvement at high temperature was checked by using solid mixture of the Co3O4/CoAl2O4 and OCN Fig. 5 shows trends of fuel conversion, CO2 selectivity, and CO concentration with temperature for two cases. The solid mixture of Co3O4/CoAl2O4 (10%) and OCN (90%) showed higher fuel conversion, higher CO2 selectivity and lower CO concentration than OCN (100%) case. Consequently, we could conclude that improvement of reduction When we use NiO based particle as an oxygen carrier in a chemical looping combustion system, the fuel conversion and the CO2 selectivity decreased with increasing reaction temperature at high temperature range (>900 o C) due to the increment of exhaust CO concentration from reduction reactor. To improve reduction reactivity at high temperature, the applicable metal oxide component was selected by calculation of the equilibrium CO concentration of metal oxide components. After that, feasibility of reduction reactivity improvement at high temperature was checked by using solid mixture of the selected metal oxide particle and NiO based oxygen carrier. 832
388 The reactivity was measured and investigated using batch type fluidized bed. The solid mixture of Co3O4/CoAl2O4(10%) and OCN (90%) showed higher fuel conversion, higher CO2 selectivity and lower CO concentration than OCN (100%) cases. Consequently, we could conclude that improvement of reduction reactivity at high temperature range by adding some Co3O4 based oxygen carrier was feasible. Acknowledgements This work was supported by the Energy Efficiency & Resources Programs of the Korea Institute of Energy Technology Evaluation and Planning (KETEP), granted financial resources from the Ministry of Trade, Industry & Energy, Republic of Korea ( ) References Ishida, M. and Jin, H., CO2 Recovery in a Power Plant with Chemical Looping Combustion, Energy Convers. Mgmt., 38, S187-S192 (1996). Jin, H., Okamoto, T. and Ishida, M., Development of a Novel Chemical-Looping Combustion: Synthesis of a Looping Material with a Double Metal Oxide of CoO-NiO, Energy & Fuels, 12, (1998). Wolf, J., Anheden, M. and Yan, J., Comparison of Nickel- and Iron-based Oxygen Carriers in Chemical-Looping Combustion for CO2 Capture in Power Generation, Fuel, 84, (2005). 833
389 Continuous Operation Results of 263 kwth Chemical Looping Combustor Ho-Jung Ryu 1*, Dong-Ho Lee 1, Gyoung-Tae Jin 1, Seung-Yong Lee 1, Jeom-In Baek 2 1 Korea Institute of Energy Research, Low Carbon Process Laboratory, 152 Gajeong-ro, Yuseong-gu, Daejeon, 34129, Korea 2 Korea Electric Power Corporation (KEPCO) Research Institute, 105 Munji-ro, Yuseong-gu, Daejeon, 34056, Korea * [email protected] Abstract To develop chemical-looping combustion (CLC), a novel power generation technology with in-situ CO2 capture and no NOx emission, We have been doing research on chemical looping combustion technology and demonstrated continuous operation of 263 kwth chemical looping combustor. This system consists of riser, bubbling bed, upperand lower-loop seal and L-valve. To check feasibility of good performance, inherent CO2 separation, and low-nox emissions, CH4, CO, CO2, O2, H2, NO, NO2 and N2O concentrations were measured by on-line gas analyzer. We measured NO, NO2, and N2O concentration to check NOx formation during oxidation and measured CO2, CO, CH4, and H2 concentration to confirm inherent CO2 separation and no carbon deposition during reduction. Steadystate operation was performed up to 102 hours at 263 kwth capacity. Gas velocities in the oxidizer and reducer were 3.5 and 0.47 m/s, respectively. Initial solid inventory was 90.4 kg. Reaction temperatures in the oxidizer and reducer were 860 and 810 o C, respectively. Pure nitrogen was used as purge gas for upper and lower loop seal. Pressure drop profiles in the system loop were maintained steadily throughout total operation time and solid circulation between the oxidizer and the reducer was smooth and stable. By analysis of gas concentration in the exit streams from the system, we could conclude that inherent CO2 separation and NOx-free combustion are possible because the average CO2 concentration was 99% and the total NOx concentration was lower than 2.7 ppm. Keywords: Chemical looping combustion, natural gas, CO2, NOx, continuous operation. I. Introduction As a promising way of integrating combustion, CO2 eparation, and pollution control with high efficiency and low cost, Chemical Looping Combustion (CLC) has gained attention in recent years (Min et al., 2009). The chemical-looping combustor consists of two reactors, an oxidation reactor and a reduction reactor, as shown in Fig. 1. A fuel and an air go through the different reactors. Eq. (1) and (2) illustrate a basic concept of the chemical-looping combustion system. In the reduction reactor, gaseous fuel (CH4, H2, CO, C nh 2n+2, syngas) reacts with metal oxide according to the Eq. (2), and release water vapor and carbon dioxide from the top and metal particles (M) from the bottom. The solid products, metal particles, are transported to the oxidation reactor and react with oxygen in the air according to Eq. (1), and produce high-temperature flue gas and metal oxide particles. Metal oxide particles at high temperature are again introduced to the reduction reactor and supply the heat required for the reduction reaction. Between the two reactors, metal (or metal oxide) particles play an important role in transportation of oxygen and heat, therefore the looping material between the two reactors is named as an oxygen carrier particle. Oxidation: exothermic reaction, M O2 MO (1) Reduction: endothermic reaction, CH4 + 4MO CO2 + 2H2O + 4M (2) 834 Fig. 1: Simplified schematic of chemical looping combustion technology. The exhaust gas from the reduction reactor contain only highly concentrated CO2 and water vapor. Therefore, CO2 can be easily recovered by cooling the exhaust gas without any extra energy consumption (energy penalty) for CO2 separation. Another advantage of CLC is that NOx formation can be thoroughly eliminated because the oxidation reaction occurs at a considerably lower temperature (~900 o C) without a flame; therefore there is no thermal NOx formation formation (Ishida and Jin (1996), Jin et al. (1998)). Moreover, the efficiency of chemical-looping combustion system is very high. Wolf et al. (2005)
, continuous operations of 50kWth facility using syngas and natural gas were successfully demonstrated more than 200 hours.")
, bubbling bed, upper- and")
390 reported that natural gas fueled chemical-looping combustor achieves a thermal efficiency between 52 53% and is 5 percent points more efficient than an NGCC system with state-of-the-art technologies for CO2 capture. In Korea Institute of Energy Research (KIER), continuous operations of 50kWth facility using syngas and natural gas were successfully demonstrated more than 200 hours. By doing these works, we could enhance fuel conversion, CO2 selectivity, and reactivity of oxygen carriers. To scale-up the former 50kWth chemical looping combustor to the large scale, we installed 200kWth chemical looping combustor consists of riser (fast fluidized bed), bubbling bed, upper- and lower-loop seal, L-valve, cyclones, and gas cooler. In this system, we have measured and investigated 1) solid circulation rate, 2) fuel conversion, 3) CO2 selectivity, 4) NOx emission, and 5) side reactions (H2 generation). The new carrier, OCN was used as oxygen carrier. This carrier was mass produced by spray drying method in KEPRI (Korea Electric Power Research Institute) and has spherical shape and excellent attrition resistance. Natural gas and air were used as reactants for reduction and oxidation, respectively. Before the steady-state continuous operation, cyclic test was performed in the 200kWth facility by using only reduction reactor (batch mode). The fuel conversion decreased slightly as the capacity, that is, fuel flow rate increased from 70 to 220 kwth. However, the average fuel conversion was so high, 99.9%, and therefore, we could conclude that the OCN carrier is suitable for this system. After that, the regeneration ability of OCN carrier was investigate again using small scale batch type fluidized bed reactor (2 inch I.D.) by successive cyclic tests further 10 cycles. The reactivity of OCN carrier was maintained stable. To select optimum operation conditions of 200kWth chemical looping combustor, continuous operation was performed at different capacity from 120 to 305 kwth. We could get the best performance around 245 kwth capacity based on the fuel conversion, CO2 selectivity and NOx emission. Based on these results, steady state operation was conducted at 263kWth capacity. Fig. 2 and 3 shows schematic diagram and photo of 200 kwth chemical looping combustion system. The general features of the system include a turbulent fluidized bed type reduction reactor, a fast fluidized bed type oxidizer, two cyclones, upper and lower loop seals, gas preheating system, two buffer tanks, online gas analyzer, and control valves. Fig. 2: Schematic diagram of 200 kwth chemical looping combustor. II. Experimental We used OCN as an oxygen carrier. OCN particle was produced by spray drying method by KEPRI (Korea Electric Power Research Institute) and this particle has spherical shape and high attrition resistance. This particle contains 70 wt.% of NiO and bulk density is g/cm 3. Further details of the particle preparation methods are available elsewhere (Ryu et al., 2003, 2004). To measure the weight percent of metal oxide component in the particles, the particle density, and porosity, EDAX and mercury porosity measurement were conducted. Fig. 3: Photo of 200 kwth chemical looping combustor. The oxygen carrier particles from the reducer through the lower loop seal are sent to the oxidizer and then transported to the oxidizer cyclone via riser. The 835
 was used to measure concentration of O2, NO, NO2, N2O, CO2, CO, CH4, and H2, continuously.")
391 collected particles in the cyclone are sent to the reducer through the upper loop seal. The oxidizer has 0.31 m I.D. and 4.4 m high. The reducer has 0.25 m I.D. and 4.4 m high. The on-line gas analysis system (ABB, Advanced Optima) was used to measure concentration of O2, NO, NO2, N2O, CO2, CO, CH4, and H2, continuously. We used natural gas (91.36% of CH4, 5.46% of C2H6, 2.02% of C3H8, 0.96% of C4H10, 0.03% of C5H12, and 0.17% of N2) as fuel. Initial solid inventory was 90.4 kg include upper and lower loop seal. Gas velocity of air in the oxidizer was 3.5 m/s and gas velocity of natural gas in the reducer was 0.47 m/s and this gas velocity correspond to the 263 kwth of capacity. Pure nitrogen was used as purge gas for upper and lower loop seal. III. Results and discussions Steady-state operation was performed up to 102 hours at 263 kwth capacity. We measured NO, NO2, and N2O concentration to check NOx formation during oxidation and measured CO2, CO, CH4, and H2 concentration to confirm inherent CO2 separation and no carbon deposition during reduction. Reaction temperatures in the oxidizer and reducer were maintained around 860 and 810 o C, respectively, during 102 hours operation. Pressure drop profiles in the system loop were maintained steadily throughout total operation time and solid circulation between the oxidizer and the reducer was smooth and stable. Fig. 4 shows trends of fuel conversion and CO2 selectivity during 102 hours long-term operation. As can be seen in figure, fuel conversion and CO2 selectivity maintained at high values and average fuel conversion and CO2 selectivity were 99.2% and 99.0%, respectively. Fig. 5 shows trends of H2, CH4 and CO concentrations during operation. H2, CH4 and CO concentrations were maintained at very low values. As can be seen in the Fig. 4 and 5, a high conversion of fuel was accomplished in the reducer with approximately 0.20% of CO, 0.79% of CH4, 0.04 % of H2 and 99.0 % of CO2 in the exit stream. Therefore it is possible to achieve an almost pure stream of CO2 from reducer and we could demonstrate possibility of inherent CO2 separation. These values are equivalent to 99.2% of fuel conversion and somewhat higher than the previous results in the 50kWth chemical-looping combustor by using natural gas as fuel (Ryu et al. 2008). Fig. 6 shows the concentrations of NOx with time in the gas stream from the oxidizer. The average values of NO, NO2, and N2O were 0.29, 1.17, 1.25 ppm, repectively. From these results, we could conclude the there is very low NOx emission in the oxidizer. Moreover, CO2 and CO were not detected in the exit stream from oxidizer at all. Therefore, we could conclude that there is no carbon deposition in the reducer. Fig. 7 compares the theoretical excess O2 concentration and the measured O2 concentration during long term operation. As can be seen in figure, those values are almost same during operation. This result means there was no oxygen consumption except for oxidation of oxygen carrier particles and explains that the oxygen is transferred from the oxidizer to the reducer properly. After 102 hours long-term operation, we have collected particles in the buffer tanks and weighed them. Total weight of collected particles was 70.7 g. This results indicate that total attrition rate was %/hr during long-term operation. Fig. 4: Trends of fuel conversion and CO2 selectivity during long-term operation. 836


392 Fig. 5: Trends of H2, CH4 and CO concentration profile during long-term operation. Fig. 6: NO, NO2 and N2O concentration profiles during long-term operation. Fig. 7: Comparison between the theoretical excess O2 and measured O2 concentration. V. Conclusions Steady-state long-term operation of chemical looping combstor at 263 kwth capacity was performed more than 100 hours. We measured NO, NO2, and N2O concentration to check NOx formation during oxidation and measured CO2, CO, CH4, and H2 concentration to confirm inherent CO2 separation and no carbon deposition during reduction. Pressure drop profiles in the system loop were maintained steadily throughout total operation time and solid circulation between the oxidizer and the reducer was smooth and stable. Moreover, temperature profiles measured each reactor and solid circulation lines were also maintained stable. By analysis of gas concentration in the exit streams from the system, we could conclude that inherent CO2 separation and NOx-free combustion are possible because the average fuel conversion was 99.2%, the average CO2 concentration was 99.0%, and the total NOx concentration was lower than 2.7 ppm. The average concentrations of H2, CH4, CO were 0.04, 0.79, and 0.20 %, respectively. Acknowledgements This work was supported by the Energy Efficiency & Resources Programs of the Korea Institute of Energy Technology Evaluation and Planning (KETEP), granted financial resources from the Ministry of Trade, Industry & Energy, Republic of Korea ( ) References Ishida, M. and Jin, H., CO2 Recovery in a Power Plant with Chemical Looping Combustion, Energy Convers. Mgmt., 38, S187-S192 (1996). Jin, H., Okamoto, T. and Ishida, M., Development of a Novel Chemical-Looping Combustion: Synthesis of a Looping Material with a Double Metal Oxide of CoO- NiO, Energy & Fuels, 12, (1998). Min, X., Ellis, N., Lim, C. J. and Ryu, H. J., Mapping of the Operating Conditions for an Interconnected Fluidized Bed Reactor for CO2 Separation by Chemical Looping Combustion, Chem. Eng. Technol., 32(3), (2009). 837
393 Ryu, H. J., Lim, N. Y., Bae, D. H., Jin, G. T., Carbon Deposition Characteristics and Regeneration Ability of Oxygen Carrier Particles for Chemical-Looping Combustion, Korean J. Chem. Eng., 20, (2003). Ryu, H. J., Jin, G. T., Lee, S. Y., Park, J., Reactivity and Attrition Resistance of Three Oxygen Carrier Particles for Chemical-Looping Combustor, Trans. of the Korean Hydrogen Energy Society, 15, (2004). Ryu, H. J., Yi, C. K., Shun, D., Park, M. H., Operating Experience of the Second Generation Chemical- Looping Combustor, 7 th High Temperature Air Combustion and Gasification International Symposium, 88 (2008). Wolf, J., Anheden, M. and Yan, J., Comparison of Nickel- and Iron-based Oxygen Carriers in Chemical- Looping Combustion for CO2 Capture in Power Generation, Fuel, 84, (2005). 838
394 Rehabilitation Alternatives for Flue Gas Desulfurization Units Asli Isler Kaya 1*, Fatih Aydin 1, Mustafa Malkoc 1, Savas Altinisik 1, Omer Orcun Er 1 1 TÜBİTAK Marmara Research Center, Energy Institute, Gebze/Kocaeli, 41470, Turkey * [email protected] Abstract Flue gas desulfurization (FGD) technologies are widely used to control sulfur dioxide (SO2) emissions from thermal power plants in order to improve air quality to the benefit of human health and the environment. Emission standards have been set in many countries to reduce SO2 emissions. These limits are being decreased gradually by the air quality regulations. According to the industrial air pollution control regulations, the SO2 emission limit is 1,000 mg/nm 3 in Turkey and it will be decreased to 400 mg/nm 3 by Hence, rehabilitation will be required for the existing FGD units in thermal power plants in Turkey in order to reach the updated SO2 emission limits. The purpose of the rehabilitation is to modify the existing FGD systems to enhance the overall SO2 removal performance in order to reach the emission limits. Before applying any rehabilitation implementation, operating parameters such as ph value, total suspended solids percentage, flue gas flow rate and particle size of the limestone of the FGD units should be controlled according to design values. Rehabilitation alternatives can be classified in two parts as structural rehabilitations (installing new spray headers and improving the spray density/coverage; installing new type of nozzles; installing wall ring(s); installing tray(s) or changing the position of tray(s)) and sub-utility installations (duct sorbent injection and organic acid addition to the scrubber). This study summarizes the rehabilitation alternatives for FGD units in thermal power plants in order to achieve the SO2 emission limits, which are continuously updated according to new regulations. For this aim, the main features of the rehabilitation alternatives mentioned above are given. In addition, some examples for the FGD units from the world are summarized in the aspect of rehabilitation studies. Keywords: Flue gas desulfurization, rehabilitation, SO2 emission limits, power plant I. Introduction Sulfur dioxide (SO2) emissions are known to cause negative impacts on human health and the environment. High concentrations of SO2 will lead to breathing difficulties, respiratory illnesses and cardiovascular diseases. One of the major effects of SO2 emissions on the environment is acid rains, which cause acid deposition, acidification of water resources, crop damage and corrosion of the buildings. The majority of these SO2 emissions are sourced from fossil fuel fired power stations. SO2 removal from flue gases has been researched mostly than any other pollutant emissions. A variety of SO2 removal technologies are available. The most commonly used process is the wet limestone-gypsum process among the different flue gas desulfurization processes. The success of the process is determined by the high SO2 removal efficiency, low operational costs, and wide availability of the limestone, which is used as the absorbing agent. In the wet limestone-gypsum process, the flue gas is treated in an absorber with the limestone slurry to remove SO2 emissions. Contacting with the slurry, SO2 dissolves in the water and forms an acidic solution. This solution is then neutralized by the dissolved alkali. Calcium carbonate from the limestone reacts with SO2 and O2 and the final product calcium sulphate dihydrate, which also known as gypsum is formed. FGD plant manufacturers generally claim an SO2 removal efficiency of minimum 95%. Current upgrade technologies can increase removal efficiencies of older scrubbers to new scrubber design ranges which are greater than 97%. In many countries, emission standards have been set to reduce SO2 emissions. Current SO2 emission limit value is 1,000 mg/nm 3 according to the Industrial Air Pollution Control Regulation in Turkey and the existing thermal power plants with FGD units must be operated within these SO2 emission limits. However, there may be some difficulties to reach the limits because of the conditions like deviation from the design value of the coal s sulfur content or blockage in the scrubber recirculation lines, etc. Due to these problems, the availability of the thermal power plants may reduce and there will be some financial losses because of the non-produced electricity. On the other hand, the SO2 emission limits will be decreased to 400 mg/nm 3 according to the related article of the Industrial Air Pollution Control Regulation in Hence, rehabilitation will be required for the existing FGD units in Turkey in order to reach the updated SO2 emission limits. Besides this, today s companies are looking for ways to reduce the operating and 839

395 maintenance costs of the FGD systems without decreasing the SO2 removal efficiency. As the FGD technology is being developed progressively, more cost-effective designs have been made in the last decades enabling the attainment of high SO2 removal efficiencies with lower costs. Therefore, rehabilitation of existing FGD units became a current issue to provide new SO2 emission limits. As a result, there is a need of upgrading the older wet FGD systems in order to achieve higher removal efficiencies while minimizing the costs. These improvements include the structural rehabilitations and sub-utility installations. The most widely applied structural rehabilitations are installing new spray headers, installing new type of nozzles, improving spray coverage, installing trays and changing the oxidation system or mist eliminators. Duct sorbent injection system installation and organic acid addition to the scrubber are the most important two sub-utility installations used for increasing the SO2 removal efficiency. The main aim of this study is to summarize the rehabilitation alternatives for the FGD units in thermal power plants in order to achieve the SO2 emission limits. Furthermore, the main features of these rehabilitation alternatives are given. is a non-uniform and incomplete spray coverage and also poor gas-liquid contact, which limit the SO2 removal efficiency that can be achieved regardless of the L/G ratio and liquid flow. Placement and distance between the spray headers and nozzles should be optimized in order to get a uniform distribution of the flue gas and the slurry. Figure 1 shows an example for the comparison of the poor spray coverage and upgraded spray coverage, which provides higher SO2 removal efficiencies with increased gas-liquid contact through the absorber (Maller, 2010). The manufacturers are using CFD studies in order to get the optimal alignment and distance between the spray headers. Fig.1: (a) Poor spray coverage (b) upgraded spray coverage (Maller, 2010) II. Rehabilitation Alternatives The first step to increase the SO2 removal efficiency is checking the existing operating parameters, which should be controlled according to the design values of the FGD systems. These parameters are ph value, total suspended solids percentage, flue gas flow rate, and reaction tank slurry level and particle size of the limestone of the FGD unit. If designed parameters are maintained and still SO2 emission limits could not be met, some rehabilitation implementations should be done. These rehabilitation strategies can be classified in two categories; i.structural Rehabilitations, ii.sub-utility Installations. II.1. Structural Rehabilitations Structural rehabilitations include physical modification of the scrubber to enhance the performance of the existing scrubber. The most common structural rehabilitation alternatives are installing new spray headers, installing new type of nozzles, improving spray coverage, installing trays and changing the oxidation system or mist eliminators. II.1.1. Installing new spray headers and improving the spray density/coverage Flue gas desulfurization scrubber modules are designed to have the optimum spray patterns, which maximize the contact between the flue gas and the slurry. Problems appear when the spray pattern has openings, which allow the flue gas passing through the scrubber without contacting the slurry. The result 840 Another important issue is that the use of a weak support system in the spray header design may lead to breakages and these breakages cause the spray headers to fall into the absorber. As a result, new FGD systems are designed to have self-supporting spray headers and the older spray headers have been changed with the new spray headers within rehabilitation studies. These new generation spray headers can be made by a number of alloys, which have good corrosion resistive properties and high tensile strength (Moretti, 2014). FRP (fiber-reinforced plastic) may also be used for the spray header design depending on the the size of absorber and also on market conditions, but there must be a stringent specification to use it without any problem (Maller, 2010). II.1.2. Installing new type of nozzles One of the most important devices of the FGD systems are spray nozzles, which are used to break up the slurry into small droplets in order to increase contact surface area and thus gas-liquid mass transfer. Hollow cone nozzles and full cone nozzles are mostly used nozzle types in the wet FGD systems. While hollow cone nozzles generate a hollow cone spray pattern, full cone nozzles generate a pressure centre below the nozzles. This pressure centre forces the flue gas to pass around the spray cone and it results in a poor mixing of the flue gas and the slurry through the absorber. On the other hand, hollow cone nozzles enable an excellent mixing of the slurry and the flue gas. As a result, hollow cone nozzles are often used in wet FGD systems (Klingspor, 2012).
.")
396 The performance of the nozzle is usually determined by the mass transfer characteristics between the flue gas and the slurry through the interface. There are two ways for generating the required droplet turbulence. One option is to select the appropriate nozzle-to-nozzle distance (Klingspor, 2012). Another alternative is to use double hollow cone nozzles instead of the single hollow cone nozzles. Figure 2 shows a comparison of SO2 removal efficiencies for the single hollow cone and double hollow cone as a function of L/G ratio (Maller, 2010). Fig.2: Comparison of SO2 removal efficiencies for the single hollow cone and double hollow cone (Maller, 2010) II.1.3. Installing wall ring(s) The main purpose of the wall rings/liquid distribution rings (LRD) is to reduce and/or eliminate wall sneakage of flue gas and enhance the gas-liquid contact area. Installing wall rings helps to equalization of the uneven distribution of gas velocity, increases the gas-liquid mass transfer, improves contacting of flue gas with slurry and accordingly provides higher desulfurization efficiency. According to another study made by the URS Corporation (2010), the existing FGD system had a SO2 removal efficiency of 88-90% because of the poor spray coverage. After the rehabilitation of the spray coverage with the improved header design and the wall ring installation, the SO2 removal efficiency has exceeded 97%. The addition of wall rings has resulted in a small increase in pressure drop, which is about in-wc. This increase is significantly lower than the increase resulted by the addition of the tray. Montanes et al. investigated the effect on the absorption of wall rings. Installing wall rings resulted in an efficiency increase of about 4%, but also in an increase of pressure drop by about 8%, depending on the operating conditions (2009). Bai and Han (2010) studied the internal flow with the wall ring installed in different locations of the absorber under different operating conditions. It is shown that with the two wall rings installed in different locations of the tower, the speed in the center of the absorber is higher than the edge and this situation enhances gas-liquid heat and mass transfer. In addition, the wall rings make gas-liquid ratio more uniform along the radial direction, which improves the SO2 removal efficiency. An example for the wall ring installation to the scrubber is shown in Figure 3. The design of the wall ring was made by TUBITAK to prevent flue gas sneakage near the scrubber walls. CFD analysis has been conducted and after the evaluation of the results the position and size of the ring was determined. Figure 3 shows the installed ring according to the design studies. Several mathematical models have been developed in order to study the chemistry of the process and the effects of wall ring on the hydrodynamics of the process. CFD modelling is often used to determine the optimum location and placement of the wall rings (Gomez et al., 2007; Marocco et al., 2009). Marocco (2010) developed a computational fluid dynamic model of an open spray tower and its application of a full scale FGD system and he also gave the CFD results for the lignite-fired steam-electric power plant located in Greece. Wall rings are installed at each spray level at the walls of the absorber. Test results have shown that the requested L/G ratio is by 12% lower compared to a conventional scrubber design without wall rings. Simulation and experimental results show that wall rings equalizes the gas velocity distribution and the desired overall SO2 removal efficiency will be achieved. On the other hand, wall rings can cause an increase in the pressure drop but the increased power consumption of the fan will be replaced by the decreased power demand of the recirculation pumps because of the decreased L/G ratio. 841 Fig. 3: CFD studies of wall ring and installation of the wall ring II.1.4. Installing tray(s) or changing the position of tray(s) Trays are used in order to increase the contact between the flue gas and the slurry; evenly distribute the flue gas across the absorber and promote the optimum contact. Addition of a tray to the scrubber will significantly increase the pressure drop and accordingly the fan power, however this additional

397 power will be offset by the reduced power with the lower L/G ratio required to achieve the required SO2 removal efficiency. More than one tray could be added to the scrubber depending on the configuration of the existing FGD system or the target removal efficiency. Changing the position of the tray(s) is also an opportunity for obtaining higher SO2 removal efficiencies. The first commercial tray design was developed by the Babcock&Wilcox Company and is protected by a patent in After this date, it is frequently used by the other firms and the use of tray in the spray towers has been increased. The flue gas passes upwardly through the absorber in counter-current contact with the slurry and with a proper coordination of liquid and gas flow rates, the sufficient contact time for the chemical reaction between the gas and liquid is achieved. Figure 4 shows the increase in the SO2 removal efficiency with the installation of a wall ring and a tray (Klingspor and Brown, 2010). This increase is achieved without a significant pressure drop increase. After the ring installation, it is possible to operate with one spray level out of service, which provides an opportunity to save pump and/or fan power. As seen in the figure, tray also provides an additional SO2 removal by creating additional surface area. Addition of a tray to the scrubber results in similar SO2 removal improvement; however it will significantly increase the pressure drop. Fig. 4: The impact of wall ring and tray on SO2 removal efficiency (Klingspor and Brown, 2010) The design of the tray depends on the hole size, number of holes and pressure drop. These design parameters affect the performance and reliability of the scrubber negatively, if the tray is not designed correctly. It may result in significant scaling on the tray. Trays are less attractive if the absorber gas velocity should be increased. They are especially preferred if the space for the absorber is limited or spray header design is not efficient (Maller et al., 2010). II.1.5. Changing oxidation system/mist eliminators Wet limestone-gypsum flue gas desulfurization process uses forced oxidation, which results in a stable gypsum product. This product can be sold to the wallboard manufacturers or cement industry by meeting some specifications, but it can also be landfilled. A wet FGD system can be converted to a system with forced oxidation by using the existing reaction tank, but also some manufacturers use external oxidation tanks in some cases. Today, almost all the wet FGD systems have been converted to the forced oxidation, which minimizes the scaling of the limestone and also creating a stable and saleable product. There are two common types of the oxidation systems for injecting oxidation air into the process slurry: Air sparge grids and air lances. Sparge grids need a continuous air flow through the feedline, because they are prone to plugging, however blockages are rarely seen by using the air lances. The performance of the sparge grids are not strongly dependent on the power of the mixer and air blowers, but the performance of the air lance system is influenced by these parameters. The turndown ratio is approximately 30% for the sparge grid (EPRI Report, 1997). A general review should be carried out in order to upgrade the oxidation system of the FGD system. In some cases, it is useful to choose the oxidation system with the sparge grids and in some cases the air lances. Generally, air lance systems are preferred in new FGD systems and can also be retrofitted to the older systems, because the tendency of plugging is higher for the air sparger system, which causes oxidation problems. Fulfillment of oxidation according to the stoichiometric ratio is crucial. Another important component is mist eliminators, which affects the performance of the FGD system. Gas velocities of the scrubber could be limited by the performance of the mist eliminators and the accumulated liquid film on the mist eliminators will cause scaling and precipitation of the solids. Higher SO2 removal efficiencies could be reached with the improved mist eliminator design, while minimizing the pressure drop and energy losses. Old generation mist eliminators are designed as teepee style or early generation flat chevron style by two levels. Conventional and new design of the mist eliminators are shown in Figure 5 (Moretti, 2014). Conventional mist eliminators cannot be washed effectively when compared to new designs and this will result in the pressure drop increase. CFD modelling studies are carried out in order to improve the performance of the mist eliminators related to the high velocity of gases or excessive liquid. 842
 Conventional mist eliminator design (b) new mist eliminator design (Moretti, 20")
398 sub-utility installation alternatives are duct sorbent injection and organic acid addition to the scrubber. II.2.1. Duct sorbent injection Fig. 5: (a) Conventional mist eliminator design (b) new mist eliminator design (Moretti, 2014) II.2. Sub-utility Installation Beside structural rehabilitation alternatives, there are some sub-utility installation alternatives to enhance FGD system s SO2 removal efficiency. Most common In duct sorbent injection, the main aim is to increase overall SO2 removal efficiency. In this system distribution of the sorbent evenly in the flue gas duct between the pre-heater and electrostaticprecipitator (ESP) or fabric filter (FF), where the temperature is between C is vital. Figure 6 shows a general flow diagram for the duct sorbent injection process. Duct sorbent injection is a system by itself, but it could also be regarded as a rehabilitation alternative. Fig. 5: Duct sorbent injection Duct sorbent injection system provides the contact between the flue gas and the finely dispersed sorbent. There are a number of sorbent alternatives; Ca- or Na-based, dry or suspended. Most commonly used sorbents are calcium hydroxide (hydrated lime), sodium bicarbonate (nahcolite) and trona (sesquicarbonate) (Srivastava, 2000). The reactions are as follows for the calcium hydroxide, sodium bicarbonate and trona, respectively: Ca(OH) 2 + SO 2 + ½ O 2 CaSO 4 + H 2 O (1) 2NaHCO 3 + SO 2 + ½ O 2 Na 2 SO CO 2 + H 2 O(2) 2[Na 2 CO 3. NaHCO 3. 2H 2 O] 3Na 2 CO 3 + 5H 2 O + CO 2 (3.1) commercial installations as reported (Soud, 2000). Sorbent reactivity and quantity, relative humidity of the flue gas, gas and solids residence time in the duct and the quantity of unreacted sorbent are the main factors, which influence the performance of the duct sorbent injection (Soud, 2000). The sorbent is one of the most important parameters, because it affects directly the yield of the system.the sorbent reactivity depends mostly on the particle size and the surface area. The smaller particle size increases the SO2 removal efficiencies as shown in Figure 7 (Wu et al., 2004). SO2 removal efficiency is also increased with the increasing surface area of the sorbent. Na 2 CO 3 + SO 2 + ½ O 2 Na 2 SO 4 + CO 2 (3.2) The sorbent is injected into the flue gas duct after the boiler and in order to humidify the flue gas water may be injected downstream or upstream of the dry sorbent injection system. In order to improve the sorbent utilization, a prefilter could be included, which will separate the fly ash and the desulphurisation products. The technology has been actively developed in the U.S. since the early 1980s. Maximum 80% SO2 can be removed in actual 843 Sorbent injection region is moistened by spraying water in order to increase the SO2 removal efficiency. Figure 8 shows the increase in the SO2 removal efficiency after humidification (Shiomoto et al., 1993). SO2 removal efficiency increases as the temperature decreases. Also, the flue gas should be maintained above the condensation temperature. Otherwise, the scaling potential will increase in the flue gas duct and other equipments.

399 The SO2 removal efficiency is compared for various sorbents in a full scale utility boiler, which is founded by Electric Power Research Institute (EPRI) in Colorado, USA. As seen in Figure 10, nahcolite sorbents show better performance with respect to trona at the same stoichiometric ratio, because the reactivity of the sodium bicarbonate is higher than the reactivity of trona. Additionally, the removal efficiencies are getting closer with the increasing stoichiometric ratios (Rhudy, 1993). Fig.7: Effect of average absorbent particle size on SO2 removal efficiency Fig.10: Effect of stoichiometric ratio on SO2 removal efficiency for different type of absorbents (Rhudy, 1993) Calcium hydroxide (hydrated lime), sodium bicarbonate (nahcolite) and trona (sesquicarbonate) are compared in Table 1. Fig.8: Effect of approach to adiabatic saturation temperature on SO2 removal efficiency Another important parameter is the stoichiometric ratio of the sorbent. Several examples are given in the literature for the stoichiometric ratios. Ca(OH)2 is widely used among the calcium-based sorbents. SO2 removal efficiency increases as the Ca/S ratio increases. Figure 9 shows the relationship between the stoichiometric ratio and SO2 removal efficiency. It is necessary to optimize the sorbent utilization for economical reasons. In addition; use of fabric filter instead of ESP is one of the factors which increase the efficiency. Fig.9: Effect of normal stoichiometric ratio on SO2 removal efficiency for (a) trona and (b) sodium bicarbonate 844 Tab.1: Comparison of the sorbents Sorbent Ca(OH) 2 Sodium bicarbonate /trona Lower cost Higher SO 2 removal efficiency Advantages Disadvantages Usability both for the duct/furnace sorbent injection Supply easiness and optional humidification Need of larger surface area/smaller particle size Corrosive effects Reduction of other emissions like NO x Any corrosive effects Higher cost Supply constraints The effect of sorbent injection system was tested at a lignite power plant in Greece. The capacity of the power plant is 300 MWe and the injection rate of lime is 5-10 tonnes/hour. The test results are shown in Table 2. SO2 reduction was between %. One of the co-benefits of this system was NOx reduction up to 40% (Fratto, 2013). Tab. 2: Test results for sorbent injection system (Fratto) Method Material SO 2 removal, % Injection rate, t/h Single Injection Hydrated lime Single Injection Premium > hydrate lime Injection with Premium < Splitter lime&recycled Injection with Splitter+Water Injection Premium lime&recycled


400 In another application, sodium bicarbonate was added to the duct and its effect on SO2 removal was monitored. According to the study, before adding sodium bicarbonate to the system, SO2 removal efficiency was around 60%; after adding the sorbent SO2 removal efficiency increased around 80% as seen in Figure 11. It is stated that trona and sodium bicarbonate are individually able to meet the SO2 removal targets for various fuel types (Kong et al., 2009). operational problems such as scaling and plugging of the mist eliminators. Fig.12: Effect of slurry ph on SO2 removal and limestone utilization Fig.11: Sodium bicarbonate feedrate effect on SO2 removal efficiency (Kong et al., 2009) II.2.2. Organic acid addition to the scrubber Another effective sub-utility rehabilitation alternative is organic acid addition to the reaction tank. In FGD processes, alkalinity is the driving force of the liquid phase. Therefore, it must be increased to achieve high SO2 removal efficiencies. The main parameters that must be focused to increase the liquid phase alkalinity are slurry ph and buffer additives. In fact, the easiest way to increase SO2 removal efficieny is increasing the slurry ph. The effect of slurry ph on SO2 removal and limestone utilization is shown in Figure 12. Theoretical works of Rochelle and King (1977) showed that an organic acid with buffering capacity in the interval between the ph of the gas-liquid interface and the ph of the bulk liquid phase would provide optimum enhancement. Further investigations with different organic acids led to the conclusion that adipic acid provides good buffering in wet FGD systems with forced oxidation (Rochelle et al., 1982). Other organic acids that provide good buffering in the phase boundaries are included in dibasic acid (DBA), also termed AGS, a liquid solution of adipic, glutaric and succinic acid (Chang and Mobley, 1983). Formic and maleic acid gave a lower increase in the SO2 removal because the effective pka values (3.8 and 3.6 at 25 C) are below the optimum ph range of Typically, an increase in slurry ph affects SO2 removal efficiency very fast. An increase in slurry ph is achieved by increasing the absorbent feed rate but this may cause a decrease in limestone utilization ratio. Limestone utilization below 90% might lead 845 Buffer additives have been widely used in the flue gas scrubbing processes. Such additives buffer the ph at the gas-liquid interface by reducing the back pressure of SO2 and by lowering the liquid film resistance to mass transfer (Klingspor, 2012). These additives are not consumed in the absorbtion reactions; they are involved in intermediate reactions but they regenerated when the overall reactions are complete (Figure 13) (Moretti, 2014). Fig.13: Suggested mechanism for the action of adipic acid in wet FGD systems (Frandsen et al., 2001) The SO2 removal enhancement effect of these organic acid buffers has been known for a long time and pilot and field tests had been done to state their impact on the system (Klingspor, 2012). While some units have been using these buffer additives on continual basis others use them to achieve minimum removal limit when burning higher sulphur fuels or design performance could not be achieved. In fact, this was the primary focus of acid use in the U.S. in the mid to late 1970s. Currently, the use of acid is a common method of reducing power consumption, limestone costs and achieving emission limits (Klingspor, 2012). Using DBA allows flexibility in the design by allowing one or more of the following: 1. Reducing L/G ratio and/or pressure drop to lower capital and operating costs.
 sulfur concentration and using DBA at a range concentration or for future higher sulfur fuel.")
.")
401 2. Using DBA as a backup and allowing the absorber to be designed without a spare spray header and pump. 3. Designing the unit for the expected (design) sulfur concentration and using DBA at a range concentration or for future higher sulfur fuel. valid for formate based sytems but can account for a significant fraction of non-solution losses. Slurry temperature is an important parameter affecting the amount of vaporization losses. The non-solution loss rates of DBA and formate in forced and inhibited systems are shown at Figure 15 (Klingspor, 2012). The least expensive additives are organic acids that buffer the slurry liquor by acting as an acid or a base to enhance limestone dissolution or to directly neutralize the sulphurous acid formed by the absorption of SO2 in water. Dibasic acid (DBA) and formic acid are the most common additives due to their low cost. DBA buffers at 5.4 and 4.3. Formate buffers the slurry at ph of 3.8. Figure 14 shows the typical impact of buffer additives on SO2 removal efficiency (Klingspor, 2012). Fig.15: Non-solution loss rates for DBA and formate (klingspor, 2012) Fig.14: The effect of buffering additives on SO2 removal efficiency (Klingspor, 2012) Buffer additives only enhance the liquid phase alkalinity, and if sufficient concentration is used, the removal efficiency will be determined by the gas phase resistance only. Selection of the buffer additive is typically a cost issue which is a function of the cost of the additive and the consumption rate of it. This consumption rate is a combination of many factors including solution and non-solution losses such as co-precipitation, chemical degradation, and vaporization losses. Within these losses, solution loses can be minimized by operating the scrubber system in a close loop configuration and minimizing the liquid blowdown. Besides that, non-solution losses are basically a function of the slurry chemistry and it may be estimated by investigating the case (Klingspor, 2012). Co-precipitation is the primary non-solution loss mechanism in both inhibited and natural oxidation systems but in forced oxidation sytems that are designed to produce gypsum, co-precipitation is not an issue. However, in forced oxidation systems, oxidation and degredation of organic acids may come forward as a problem. Vaporization losses are only The effect of sodium formate additive was tested at the PSI Energy Gibson Station. As seen in Table 3, SO2 removal efficiency is increased with the increasing concentration of sodium formate. Another example is from the Southwestern Electric Power Company s Pirkey Station. As seen in Table 4, the SO2 removal efficiency is increased from 83.1% to 96.9% by adding 2,650 ppm sodium formate. Similar results were obtained in Hoosier Energy Merom Station (Table 5), and in New York State Electric and Gas Corporation s Kintigh Station, as seen in Table 6 (Blythe, 1996). Tab.3: Test results for sodium formate additive at PSI Energy Gibson Station No Sodium formate L/G SO ph 2 Removal concentration (mg/l) (gal/kacf) efficiency % , , Tab.4: Test results for sodium formate additive at Southwestern Electric Power Company s Pirkey Station No Sodium formate SO 2 inlet concentration (ppm) (ppm) 1 0 1, , , , , SO 2 Removal efficiency % 846
402 Tab.5: Test results for sodium formate additive at Hoosier Energy Merom Station No Sodium formate Limestone SO concentration ph 2 Removal Utilization,% Efficiency % (ppm) , , No Tab.6: Test results for sodium formate additive at New York State Electric and Gas Corporation s Kintigh Station Sodium formate concentration (ppm) ph SO 2 inlet (ppm) SO 2 Removal Efficiency % , , , , , , IV. Conclusions SO2 emissions are controlled by the flue gas desulfurization (FGD) technologies in order to improve the air quality and decrease the negative impacts of these emissions on the environment and human health. There are stringent emission regulations in the world and there may be some difficulties to catch the limits for the power plants. The reason for these difficulties may vary depending on the power plant, operation conditions and also fuel/coal properties. Due to these problems, the availability of the thermal power plants decrease and it will result in financial losses. In order to overcome these problems and to reach the emission limits, some rehabilitation applications could be done. Before taking a rehabilitation decision, the operating parameters for an existing FGD system should be checked whether they are in accordance with the design values or not. These parameters are: ph value Total suspended solids percentage Flue gas flow rate L/G ratio Particle size of the absorbent After checking the operating parameters, some structural rehabilitation applications could be done: are possible rehabilitation alternatives. The main advantages of the rehabilitation alternative adding dry sorbent injection system can be summarized as follows: Installation costs are low Installation time is short There are a few technical risks and operation is easy It is a proven technology It has widespread potential Startup time is short The response time to the capacitance change is short Beside these advantages, there are some disadvantages as: Operational costs are relatively high There is an additional dust load The main advantages of the rehabilitation alternative organic acid addition to the scrubber can be summarized as follows: It increases the SO2 removal efficiency Installation and operation are easy Investment costs are low The system is a compact system It allows a stable operation at the power plant It increases the limestone utilization It will result in decreasing of plugging and clogging Proper selection of rehabilitation alternative is dependent on the site-specific investigation of power plant itself. Therefore, a comprehensive study must be done before rehabilitation alternative selection. Nomenclature DBA : Dibasic acid EPRI : Electric Power Research Institute ESP : Electrostaticprecipitator FF : Fabric filter FGD : Flue gas desulfurization FRP : Fiber-reinforced plastic L/G ratio : Liquid/gas ratio SO2 : Sulfur dioxide Installing new spray headers and improving the spray density/coverage Installing new type of nozzles Installing wall ring(s) Installing tray(s) or changing the position of tray(s) Changing oxidation system/mist eliminators Beside structural rehabilitation alternatives, there are some sub-utility installation alternatives that may enhance FGD system s SO2 removal efficiency. For the sub- utility installations, Duct sorbent injection system Organic acid addition to the scrubber 847 References Bai M., Han W., Numerical simulation of flow field in wet desulfurization spray tower, College of Environmental and Chemical Engineering, Information Engineering and Computer Science, IEEE, China (2010). Blythe, G., High removal efficiency testing, DE-AC22-92PC91338, U.S. Department of Energy, Radian Corporation, Austin, Texas (1996). Chang, J. C. S., & Mobley, J. D. Testing and commercialization of byproduct dibasic acids as bu4er additives for limestone Ffue gas desulfurization
403 systems. Journal of the Air Pollution Control Association, 33(10), , (1983). EPRI-DOE-EPA Combined Utility Air Pollutant Control Symposium, SO2 Control Technologies and Continuous Emission Monitors, Washington, DC, August (1997). Fratto, E., Experience in Greece with Nol-Tec, Carmeuse (2013). Gomez A., Fueyo, N., Tomas, A., Detailed modelling of a flue-gas desulfurisation plant, Computers and Chemical Engineering, 31, (2007). Jan B. W. Frandsen, Soren Kiil, Jan Erik Johnsson, Optimisation of a wet FGD pilot plant using 'ne limestone and organic acids., Chemical Engineering Science ,(2001). Klingspor J.S., Experience from 52,280 MWe of wet flue gas desulphurisation system upgrades, VGB PowerTech, 12 (2012). Klingspor J.S., Brown G.N., Techniques for improving FGD system performance to achieve ultra-high SO2 removal efficiency, URS Power Technical Paper, FGD Upgrades (2010). Kong, Y., Carpenter, S., Bose, S., McMillan, M., Nijhawan, P., Dry Sorbent Injection of Trona and Sodium Bicarbonate for SO2, SO3, NOx and Mercury Mitigation, Power-Gen International (2009). on mass transfer in CaCO3 and CaO slurry scrubbing of SO2 from waste gases. Industrial and Engineering Chemistry, Fundamentals, 16(1), (1977). Rochelle, G. T., Weems, W. T., Smith, R. J., & Hsiang, M. W. Buffer additives for Lime=Limestone slurry scrubbing. ASC Symposium Series, 188, , (1982). Shiomoto, G.H., Smith, R.A., Muzio, L.J. (1994). Integrated dry NOx/SO2 emissions control system calcium-based dry sorbent injection, Prepared for Public Service Company of Colorado, Denver, Co. Soud, H.N., Development in FGD, IEA Coal Research (2000). Srivastava, R. K., Controlling SO2 Emissions: A Review of Technologies, EPA/600/R-00/093, November (2000). TUBITAK Marmara Research Center, Energy Institute, Rehabilition of Kemerköy Thermal Power Plant s FGD System Project, Gebze-Kocaeli (2013). Wu, C., Khang, S., Keener, T.C., Lee, S. A model for dry sodium bicarbonate duct injection flue gas desulfurization, Advance in Environmental Research, 8, , (2004). Maller G., Noblett J., Denlinger M., Klinspor J., New technologies to improve the performance and reliability of older FGD systems, URS Power Technical Paper, FGD Upgrades (2010). Marocco L., Inzoli F., Multiphase Euler-Lagrange CFD simulation applied to wet flue gas desulphurisation technology, International Journal of Multiphase Flow, 35, (2009). Marocco L., Modeling of the fluid dynamics and SO2 absorption in a gas-liquid reactor, Chemical Engineering Journal, (2010). Montanes C., Gomez-Samper A., Fueyo N., Gomez-Yagüe P., Ballesteros JC., Computational Evaluation of Wall Rings in Wet Flue Gas Desulfurization Plants, 10th Conference on Energy for a Clean Environment, Lisbon, Portugal (2009). Moretti A.L., State of the art upgrades to existing wet FGD systems to improve SO2 removal, reduce operating costs and improve reliability, Presented to Power-Gen-Europe, Germany, June 3-5 (2014). Rhudy, R. Dry sorbent injection SO2 control technology review, TR Research Project , Final Report. (1993) Rochelle, G. T., & King, C. J. The effect of additives 848
404 Effect of Zeolite Supported Iron Catalyst on Upgrading of Pyrolysis Bio-Oil Elif Saracoglu 1*, Esin Apaydin-Varol 2, Basak Burcu Uzun 3 1,2,3 Anadolu University, Faculty of Engineering, Dept. of Chemical Engineering, Ikı Eylul Campus, Eskisehir, 26555, Turkey * [email protected] Abstract The present study is aimed to investigate the upgrading of beech sawdust pyrolysis bio-oil through catalytic cracking of its vapors over Fe-modified ZSM-5 zeolite in a fixed bed tubular reactor. Zeolite supported iron catalyst was successfully prepared with varying metal loading ratios (1, 5, 10 wt.%) via dry impregnation method and further characterized by XRD and SEM-EDX techniques. TG/FT-IR/MS analyses was used for the detection of biomass thermal degradation. Product yields obtain from non-catalytic and catalytic pyrolysis experiments were determined and the obtained result show that bio-oil yields decreased the prensence of catalysts. Besides, bio-oil composition is characterized by GC/MS. It was indicated that the entity of the ZSM-5 and Fe/ZSM-5 catalyst reveal a significant enhancement quality of the pyrolysis products in comparison with non-catalytic experiment. The catalyst increased oxygen removal from the organic phase of bio-oil and further developed the production of desirable products such as phenolics and aromatic compounds. Keywords: Biomass, catalytic pyrolysis, upgrading bio-oil, Fe loaded ZSM-5 I. Introduction With the concerns on the depletion of fossil fuel sources and increasing environmental problems, biomass is an alternative resource to fossil fuels by virtue of its renewability, low emissions of carbon dioxide (CO2), sulfur dioxide (SO2) and nitrogen oxides (NOx) which can be converted to valuable products by different technologies. Biomass energy is capable of supplying a wide range of liquid, solid and gaseous raw materials that can be evaluated for the production of energy, fuel and value added chemicals. In consequence of thermochemical conversion of biomass by pyrolysis, the solid, liquid and gas products are obtained. Pyrolysis oil is an essential material for the production of bio-fuels and some value-added chemicals. Among the pyrolysis types as fast, moderate and slow; fast pyrolysis seems to be a key technology to convert biomass into high liquid yields known as bio-oils (Bridgwater, 2010; Van de Velden et al., 2010). Bio-oils are very complex mixture of oxygenated compounds, totally different from petroleum fuels and containing many valuable chemicals (Dong et al., 2012). Bio-oils upgrading refers to minimizing its well-known undesirable properties such as high concentrations of oxygenated molecules, water content and acidity, low calorific value, high viscosity and corrosivity. All downsides become the major obstructions for bio-oil feasibility. Catalytic pyrolysis is carried out to overcome most of these problems and to convert oxygenated compounds produced during biomass pyrolysis directly to hydrocarbons which can improve quality of the final bio-oil properties (Iliopoulou et al., 2012; Stefanidis et al., 2011). Moreover, the use of catalysis in the thermochemical processing of biomass is an interesting approach for maximizing product yields and selectivity and also for enhancing the compositions of bio-oil and its physical - chemical properties (Lu et al., 2010). Solid acidic catalysts such as ZSM-5 zeolite has been investigated as candidate materials for bio-oils upgrading due to influentially change the composition of the bio-oils by reducing oxgen content via deoxygenation reactions. Besides that it produces increasing amounts of aromatic species and organic fraction that can be upgraded to diesel type fuels and valuable chemicals (Lappas et al., 2010; Iliopoulou et al., 2012). Adjustment of acid sites availability is the most important step in designing solid acid catalysts. The literature data prove that, metal modified zeolitic materials with reduced acidity, can enhance the yields of hydrocarbons and high value chemicals (e.g.phenols) while producing less coke than commercial ZSM-5 from the pyrolysis of biomass (French and Czernik, 2010). Especially, among the metals, iron is as known quite favorable metal in catalytic fields based upon its good activities on hydrogenation and ring opening reactions and also economically convenience (Muenpol and Jitkarnka, 2015). According to above concerns, this present study is aimed to investigate catalytic upgrading of bio-oil obtained from beech wood sawdust pyrolysis on Feloaded ZSM-5 zeolites. II. Experimental Facility II.1. Biomass Feedstock All the experiments were carried out with beech (Fagus orientalis) wood sawdust purchased from Eskişehir, Turkey. This sawdust was ground for size reduction and sieved mechanically. Particles having 849
405 sizes between 1.25 and 0.85 mm were used throughout the experiments. All the ground and sieved samples were kept at the room temperature in a sealed box. The results of proximate and ultimate analyses of beech wood sawdust are presented in Table 1. Proximate analysis was performed on the biomass sample to determine the weight fractions of moisture, volatile, ash and fixed carbon contents. Then, the fixed carbon content was obtained by subtracting the percentages of volatile matter and ash from 100%. For the ultimate analyses C, H, N and O content were determined by elemental analysis using LECO- CHN analyser. Tab. 1: Proximate and ultimate analyses of beech wood sawdust. Proximate Analysis wt.% Moisture 8.9 Ash 0.51 Volatile Matter 75.6 Fixed Carbon 14.9 Ultimate Analysis wt.% C H 6.96 N 0.22 S O II.2. Catalyst Preparation The catalysts used for beech wood sawdust pyrolysis experiments were chosen to be ZSM-5 zeolite (SiO2/Al2O3 molar ratio=80). ZSM-5 was further promoted with Fe varying metal loading ratios (1, 5 and 10 wt. %) via dry impregnation method. Fe(NO3)3.9H2O was used as metal source. The catalysts were calcined at 500 o C/6h/air on a benchscale glass tubular reactor. Images of Fe modified ZSM-5 zeolites are given in Fig.1. Fig. 1: Fe modified ZSM-5 zeolite a. unmodified ZSM-5 b. 1 wt.% Fe/ZSM-5 c. 5 wt.% Fe/ZSM-5 d. 10 wt.% Fe/ZSM-5. II.3. Experimantal Apparatus and Procedure The thermal and catalytic fast pyrolysis experiments were conducted under nitrogen atmosphere in a wellswept resistively fixed-bed reactor with a length of 90 cm and an inner diameter of 8 mm, made of 310 stainless steel. Fig. 2. shows the detailed schematic diagram of the experimental set-up. As can be seen, temperature measurements were taken above the bed, with the thermocouple in the middle of the tubular reactor, in order to control the reactor temperature. A- 316 stainless steel swagelock needle valve was used for fine control of the nitrogen flow rate before entry into the reactor. All the fast pyrolysis experiments were performed at 500 o C with 500 o C /min heating rate and a nitrogen gas flow rate of 400 cm 3 min 1 was maintained and measured with a rotameter. The reactor tube was successively filled with 5 g biomass (upper zone of reactor) and 0.50 g catalyst (a lower catalyst layer) for the catalytic experiments, respectively. Thereby, the thermal fast pyrolysis of biomass took place first and then the primary product vapors were upgraded when they passed through the catalyst bed. The obtained pyrolysis vapor was next passed though cold traps in order to collect the liquid product. The liquid phase consisted of aqueous and oil phases, which were separated and weighed. Moreover, the solid products consisted of bio-char and coke-on-catalyst were weighted to determine the pyrolysis product yields. Experiments were repeated at least three times. Fig. 2: Schematic diagram of the experimental set-up. 850
.")
406 II.4. Analysis and Characterizations Thermal characteristics and evolved gases during thermal and catalytic pyrolysis of beech sawdust under N2 atmosphere were investigated using a thermogravimetric analyser coupled with Fourier transform infrared analysis and mass spectrometry (TG/FT-IR/MS). The sample, weighing approximately 10 mg, was heated to 1000 C with a heating rate of 10 C min 1 under nitrogen flowing rate of 100 cm 3 min 1 ). The crystalline structure and metal doping on the catalysts were analysed by X-ray Diffraction (XRD- Rigaku X-ray Diffractometer). The sample was scanned at 2θ from 5 to 60 o with a step size of Cu-Kα radiation was obtained from a copper X-ray tube operated at 40 kv and 30 ma. XRD patterns were matched to the standarts to define crystalline phases by smartlab guidance program. Moreover, the Fe modified ZSM-5 catalysts were analysed by Scanning electron microscopy with energy dispersive X-ray spectroscopy (SEM-EDX) for the identification of their metal ratios and chemical compositions using Zeiss Evo 50 EP/SEM-EDX. The metal loading ratio of catalysts was calculated from the avarege of at least five different points. The chemical composition of the liquid organic phase was identified by GC/MS (Column:HP-5MS ( 30m x 0.25mm ID x 0.25 μm)). An initial oven temperature of 40 o C was sustained for 4 min. Then, a heating rate of 3 o C/min was carried out to reach a final column temperature of 270 o C. This condition was hold for 20 min. Helium (99.999%) was used as a carrier gas with a constant column flow of 1ml/min and The MS was used within m/z range. Identification of chromatographic peaks were obtained according to the NIST mass spectrum library. Fourier transform infrared (FT-IR) spectrometer (Thermo Fisher Scientific- Nicolet is 50 FT-IR Spectrometer) was applied to define chemical functional groups in the beech wood sawdust bio-oil. The wave number scan range was cm 1 with a resolution of 0.1 cm 1. CH4, and other low molecular weight hydrocarbons. As stated by the results of pyrolysis behaviour of beech wood sawdust, the thermal (non-catalytic) and the ZSM-5 catalysed fast pyrolysis experiments were carried out at 500 o C. Fig. 3: The TG and dtg curves of beech wood sawdust under nitrogen atmosphere. Fig. 4: 3D infrared spectrum of evolved gases during thermal degradation of beech wood sawdust. III.2. Physico-Chemical Characteristics of Catalytic Materials ZSM-5 zeolite catalyst and the catalyst obtained by impregnation of Fe (1, 5 and 10 wt.%) were characterized by a number of techniques in order to determine the effect of metal addition on the physicochemical properties of catalysts. Table 2. represents the results of SEM-EDX analysis of modified catalysts. III. Results and Discussions III.1. Thermal Behavior of Biomass The curves of thermogravimetric analysis (TGA) and their differential thermogravimetric analysis (dtg) of beech wood sawdust are presented in Fig. 3. According to the TG/dTG curves, beech wood sawdust thermal degradation starts at about 211 o C and is completed at 517 o C, with a maximum decomposition rate at 348 o C and a mass loss about 60 wt.%. As shown in Fig. 4, 3D FT-IR diagram demonstrates that the thermal degradation of beech wood sawdust occurs in one step mainly around 500 o C. Coupling of the FT IR/MS spectra reveals that the main gaseous products obtained from the degradation of beech wood sawdust were CO2, CO, 851 Tab. 2: Chemical composition of the modified ZSM-5 catalyst. Chemical composition (SEM-EDX) Nominal metal loading (%) Actual metal loading (%) ZSM wt.% Fe/ZSM wt.% Fe-ZSM-5 10 wt.% Fe/ZSM Phase analysis of the ZSM-5 and Fe/ZSM-5 catalysts was determined by XRD technique as illustrated in Fig. 5. XRD profiles show that all the samples present the typical peaks of MFI type zeolite at ~8 o and 23 o, evidencing the typical high crystallinity of this structure, regardless of their Si/Al molar ratio (Zhou et
407 al., 2014), so the framework of ZSM-5 is preserved after Fe impregnation procedure. The different ratios Fe-modified catalyst exhibited XRD patterns with the characteristic peaks of Fe3O4. Fig. 5: XRD patterns of ZSM-5, 1 wt.% Fe/ZSM-5, 5 wt.% Fe/ZSM-5, 10 wt.% Fe/ZSM-5 catalyst. III.3. Effect of Fe Loaded ZSM-5 Catalyst on the Product Yields main product distribution of bio oil obtained by catalytic pyrolysis on modified catalyst and thermal pyrolysis. As previously mentioned in the literature, acids (high corrosivity), esters and ethers (reducing heating value), PAHs (carcinogenic) are the undesired products from biomass pyrolysis and in other respects, phenols, furans, aromatic hydrocarbons, aliphatic hydrocarbons and alcohols are highly desirable for fuel production (Stefanidis et al.,2011). According to the result of GC/MS analysis, un-modified and metal modified ZSM-5 catalyst found to be effective to form high amount of phenols which are regarded as value added chemicals. It was observed that the presence of Fe (10 wt.%) / ZSM-5 catalyst achieved the highest yield of phenolic compounds and hydrocarbons. The FTIR spectra of the bio-oils obtained from beech wood sawdust under static atmosphere are given in Fig. 6. The O H stretching vibrations between 3200 and 3400 cm 1 indicate the presence of phenols and alcohols. The C H stretching vibrations between 2800 and 3000 cm 1 and C H deformation vibrations between 1350 and 1475 cm 1 indicate the presence of alkanes. The C=H stretching vibrations with absorbance between 1650 and 1750 cm 1 indicate the presence of ketones or aldehydes. Yields of bio-oil, char, gas and water formed from catalytic and non-catalytic pyrolysis products are given in Table 3. Same table also illustrates the results from non-catalytic (thermal pyrolysis) run, i.e. under the similar experimental conditions without catalyst. Thus, the product yields of beech sawdust catalytic pyrolysis with the modified ZSM-5 can be compared with that of obtained from thermal pyrolysis experiments. The highest bio-oil yield (30.66 wt.%) was obtained from the non-catalytic experiments. The presence of ZSM-5 and Fe/ZSM-5 catalysts decreased bio-oil yields with a simultaneous increase in water and gas yields along with the gradually increase in metal ratios. This behaviour is similar to previous studies which investigated the effect of catalyst on pyrolytic products and it can be clarified that these alteration arise due to the deoxygenation reactions that occur on the catalyst surface. Water formation is encouraged via dehydration and decarboxylation of the oxygenated compounds on the acid sites of zeolite catalysts. (Iliopoulou et al., 2012; Lappas et al., 2009). On the other hand, the yield of char is approximetly constant for all cases. Tab. 3: Product yield distrubition for non-catalytic. Catalysts Bio-oil Char Gas Water yield yield yield yield (%) (%) (%) (%) Non-catalytic ZSM Fe/ZSM5-1 wt.% Fe/ZSM5-5 wt.% Fe/ZSM5-10 wt.% III.4. Effect of Fe Loaded ZSM-5 Catalyst on the Chemical Composition of the Bio-oil GC/MS analysis was used to determine the tentative 852 Fig. 6: FTIR spectra of bio-oil from (a) non-catalytic, (b) entity of ZSM-5, (c) 1 wt.% Fe/ZSM-5, (d) 5 wt.% Fe/ZSM-5, (e) 10 wt.% Fe/ZSM-5 catalyst. The absorbance peaks between 1575 and 1675 cm 1 representing C=C stretching vibrations are indicative of alkenes and aromatics. IV. Conclusions The effect of different loading ratios of Fe modified catalysts on the product yields and compositions of bio-oil obtained from the fast pyrolysis of beech wood sawdust was investigated in this study. Zeolite supported iron catalyst was successfully prepared
408 with varying metal loading ratios. ZSM-5 and Fe/ZMS- 5 (1, 5, 10 wt.%) catalysts were used for the catalytic pyrolysis which were examined according to organic liquid product yield, deoxygenation ability and desirable products for biofuel production. Compared to non-catalytic pyrolysis, the obtained results showed that the existence of catalysts alters significantly the quality of the pyrolysis products. It was demonstrated that an impregnation of 10 wt.% Fe to ZSM-5 resulted in a considerable increase amount of phenolic compounds, aromatic and aliphatic hydrocarbons present in the bio-oils as compare with non-catalytic runs. Acknowledgements The authors would like to thank Heinrich Böll Stiftung (Turkey) and Anadolu University Scientific Research Council (Project Number: 1601F028) for the financial support of this work. Stefanidis, S. D., Kalogiannis, K. G., Iliopoulou, E. F., Lappas, A. A., & Pilavachi, P. A., In-situ upgrading of biomass pyrolysis vapors: catalyst screening on a fixed bed reactor, Bioresource technology, 102(17), , (2011). Van de Velden, M., Baeyens, J., Brems, A., Janssens, B., & Dewil, R., Fundamentals, kinetics and endothermicity of the biomass pyrolysis reaction, Renewable energy, 35(1), , (2010). Zhou G., Li J., Yu Y., Li X., Wang Y., Wang W., Komarneni S., Optimizing the distribution of aromatic products from catalytic fast pyrolysis of cellulose by ZSM-5 modification with boron and co-feeding of lowdensity polyethylene, Applied Catalysis A: General, 487, 45 53, (2014). References Bridgwater, Anthony V., Review of fast pyrolysis of biomass and product upgrading, Biomass and bioenergy, 38, 68-94, (2012). Dong, C. Q., Zhang, Z. F., Lu, Q., & Yang, Y. P., Characteristics and mechanism study of analytical fast pyrolysis of poplar wood, Energy Conversion and Management, 57, 49-59, (2012). French, R. and Czernik, S., Catalytic pyrolysis of biomass for biofuels production, Fuel Processing Technology, 91.1, 25-32, (2010). Iliopoulou, E. F., Stefanidis, S. D., Kalogiannis, K. G., Delimitis, A., Lappas, A. A., & Triantafyllidis, K. S., Catalytic upgrading of biomass pyrolysis vapors using transition metal-modified ZSM-5 zeolite, Applied Catalysis B: Environmental, 127, , (2012). Lappas, A. A., Bezergianni, S., & Vasalos, I. A., Production of biofuels via co-processing in conventional refining processes, Catalysis Today, 145(1), 55-62, (2009). Lappas, A. A., Iliopoulou, E. F., & Kalogiannis, K., Catalysts in biomass pyrolysis, Thermochemical conversion of biomass to liquid fuels and chemicals, 1, , (2010). Lu, Q., Zhang, Z. F., Dong, C. Q., & Zhu, X. F., Catalytic upgrading of biomass fast pyrolysis vapors with nano metal oxides: an analytical Py-GC/MS study, Energies, 3(11), , (2010). Muenpol, S., Yuwapornpanit, R., & Jitkarnka, S., Valuable petrochemicals, petroleum fractions, and sulfur compounds in oils derived from waste tyre pyrolysis using five commercial zeolites as catalysts: impact of zeolite properties, Clean Technologies and Environmental Policy, 17(5), , (2015). 853
409 Air Gasification of Dried Sewage Sludge Using a Multi-Stage Gasifier: Effects of the Equivalence Ratio and Activated Carbon on Tar Removal Young-Kon Choi*, Gyung-Goo Choi, Joo-Sik Kim University of Seoul, Department of Energy and Environmental System Engineering, Renewable resource laboratory, 90 Jeonnong-Dong, Dongdaemun-Gu, Seoul, , Republic of Korea * [email protected] Abstract Due to grobal warming and introduction of eco-friendly policies, attention in the production of renewable energy from various biomass has been increased. Gasification has been considered as one of thermochemical conversion technologies and can not only reduce the sewage sludge amount but also produce heat, electricity, chemicals or fuels. However, the main obstacle of gasification for its implementation into a commercial scale is tar generation. Air gasification of dried sewage sludge was conducted in a newly developed multi-stage gasifier including auger reactor to produce a syngas with low tar contents. The multi-stage gasifier was consisted of auger reactor unit, bubbling fluidized reactor zone and tar cracking zone. In the experiments, the effects of equivalence ratio and activated carbon were mainly investigated. The increase in equivalence ratio was shown to have a strong influence on the tar content in producer gas. Particually, when the equivalence ratio increased up to 0.5, tar concentration in producer gas decreased to 76 mg/nm 3. Keywords: Multi-stage gasifier, sewage sludge, equivalence ratio, activated carbon, tar I. Introduction Gasification, one of the thermo-chemical conversion processes, is defined as the thermal decomposition of a material in the presence of limited oxygen to produce a gas called syngas or producer gas. It is also considered a promising route to produce H2 that is an alternative energy source to fossil fuels. Not only does the gasification of sewage sludge generate energy but it also reduces the sludge volume and generation of toxic compounds (Marrero et al., 2004). Nevertheless, the gasification of biomass is confronted with several problems. The main obstacle that needs to resolve with gasification is the problem associated with the production of tar. The tar will cause not only the mechanical breakdown of entire equipment but also deactivation of catalysts in the process (Shen et al., 2015). Tar removal method was mainly divided into two ways: (a) control of tar formation in the gasifier called the primary method (b) tar separation from producer gas by downstream equipment after the gasifier called the secondary tar. The secondary method has already proved to be more effective than primary method for tar and impurities removal. However, primary methods have been more and more interested because of various reasons (Devi et al., 2015). In particular, the equivalence ratio was very important in two aspects: (1) influences the quality of the producer gas including caloric value and gas composition (2) effect on reducing tar formation because high concentration of oxygen was enough reacted with volatiles at high equivalence ratio condition (Lasa et al., 2011). In addition, the activated carbon has advantages in tar cracking because it has high hydrocarbons adsorptivity (Fukuyama et al., 2004). and it is cheap. This paper was reported that the effect of additive (activated carbon) on the gas composition, especially in terms of impurities (tar, ammonia, hydrogen sulfide) contents in the producer gas. The effects of equivalence ratio in the new developed multi-stage gasifier on the gas quality and tar removal are also presented. II. Experimental Facility II.1. Feed material In all experiments, the feed material was sieved to take a material with a diameter between 0.6 and 3.35 mm. The dried sewage sludge mainly consisted of volatile matter (50.3 wt%) and ash (34.7 wt%). The nitrogen and sulfur content was 4.34 and 1.06 wt%, respectively. II.2. Multi-stage gasification process Fig. 1 shows a diagram of the multi-stage gasification process. The multi-stage gasification process (Fig. 1) used for the present study was comprised of four parts: a feeding system, auger reactor, two-stage gasifier, char separation system, quenching system. The gasifier system including auger reactor was preheated by electric furnace to the desired temperature before the process is started. The auger reactor was located at the inlet of the two-stage gasifier. The auger reactor was newly designed as a screw reactor with a length of 850 mm and an inner diameter of 32 mm. The two-stage gasifier composed of a bubbling fluidized bed (lower reactor) and a fixed 854
410 TIR TIR TIR PIR TIR TIR PIR PIR PIR TIR 2 PIR TIR 8 th International Exergy, Energy and Environment Symposium (IEEES-8), May 1-4, 2016, Antalya, Turkey bed reactor (upper reactor) in series. The char separation system was consisting of a cyclone and ceramic hot filter. Quenching system was composed of three water-cooled steel condensers and A flow of non-condensable producer gas leaving the EP was sampled using Teflon gas bags (1L) at an interval of 10 min to analyze its composition. 2000). The concentration of ammonia and hydrogen sulfide in producer gas was measured by gas measurement analyzer (IR 9000, Rbr). The detect precision of this gas analyzer was ±5 ppm for the NH3 and H2S quantification. A proximate analysis of the feed material was conducted according to the ASTM E871-82, ASTM E and ASTM D Electrostatic Filter 3 III. Results and discussions Water Silo Vibrator 2 Impact separator Container Container (Liquids) (Liquids) Steel Condenser Fluidized Bed Reactor Electrostatic Filter III.1. Gas composition M Screw M Screw Air Jaket Heater Heater Auger Reactor Fig. 1: Diagram of the multi-stage gasification process. II.3. Gasification conditions In each experiment, 800 g of dried sewage sludge was fed. 2.5 kg Olivine as bed meteral and 800g coal-based activated carbon were used as a bed material and as a tar cracking additive. Total operation time was above 60 min. The reaction temperatures of auger and two-stage gasifier were ~650 C and ~820 C, respectively. Tab. 1: Experimental conditions Run 1 Run 2 Run 3 Run 4 ER Flow rate (L/min) Activated carbon No use Used Used Used In this study, the equivalence ratio (ER) was defined as ratio between amount of actual oxygen/sludge and the stoichiometric oxygen/sludge. Detailed experimental conditions are shown in Tab. 1. Runs 1 to 3 were performed to understand effect of activated carbon in upper-reactor. The comparison among Runs 2-4 would reveal the influence of the ER on the composition of producer gas and impurities contents. II.4. Measurements 1 Pre Heater Heater Heater Cyclone Pre Heater All Gasification products were divided into four groups: gas, char, condensate liquid collected in condensers and EP, and tar condensed on the equipment. Sampled gas was analyzed using GC-TCD and GC-FID (7890A, Agilent Instruments) with argon as the carrier gas for N2, H2, CO2, CO, CH4 and light hydrocarbons. Tar in producer gas was defined as organic molecules with a molecular weight larger than that of benzene in producer gas. This tar was analyzed using gas chromatography (GC-FID, GC-TCD). Tar in the producer gas was defined as molecules larger than benzene according to the International Energy Agency s guideline (Simell et al., Hot filter Water Container (Liquids) Steel Condenser Compressor N Container (Liquids) Glass Condenser EtOH Impact separator Gas meter Gas sampling Container (Liquids) Check Valve Flare In the comparison between Run 1 and 3, as shown in Table 2, the use of activated carbon (AC) gave rise to a strong increase in H2 from to vol%, a decrease in CO2 from to vol%, and a strong decrease in hydrocarbons including CH4. The above results indicate that AC played a significant role in the production of an H2-rich producer gas. The reaction of CO2 in syngas with tar and coke on AC (dry reforming) appeared to take place. This reaction increased the H2 content and decreased CO2 in the syngas of Run 3. Dry reforming: CnHm + nco2 2nCO + 1/2m H2 Tab. 2: Producer gas composition (vol%) Run 1 Run 2 Run 3 Run 4 N CO H CO CH C 2H C 2H C 2H N.D N.D Benzene >Benzene N.D: not detected (< vol%) Also, Table 2 shows the results of the experiment with various ERs. The results show that the gas composition strongly depends on the ER. With increasing ER, the H2 concentration in producer gas decreased from (Run 2) to vol% (Run 4), whereas the CO2 and N2 concentration increased in particular. The main reason for the change of gas composition appeared to from increase oxidation reaction and combustion of combustible gases with increasing ER. III.2. Impurities contents As can be seen in Tab. 3, the activated carbon drastically reduced the tar content in producer gas from 2573 to 147 mg/nm 3. Tab. 3: Impurities in producer gas Run 1 Run 2 Run 3 Run 4 Tar (mg/nm 3 ) NH 3 (ppm) H 2S (ppm) : Not Available 855
411 Institute of Energy Technology Evaluation and Planning (KETEP), granted financial resource from the Ministry of Trade, Industry & Energy, Republic of Korea. (No ) References Devi L., Ptasinski K.J., Janssen F.J.J.G., A review of the primary measures for tar elimination in biomass gasification processes, Biomass Bioenergy, 24, (2003). Fig. 2. Proposed tar removal mechanism over activated carbon: thermal and catalytic tar cracking and tar cracking via reactions with gas components. The tar cracking mechanism over activated carbon is proposed in Fig. 2. First, adsorption of tar from the lower reactor onto the surface of activated carbon and the subsequent considerable formation of coke take place at a high temperature. Then, thermal cracking of tar and catalytic cracking of tar and coke by the ash of activated carbon occur. Furthermore, tar and coke are removed through their reactions with H2O and CO2 flowing from the lower reactor. Therefore, Table 4 shows the NH3 and H2S content of the producer gas were following a decreasing trend with the increasing ER. Similarly, Gai et al reported that higher ER enhanced the oxidation reaction of H2S by excessive oxygen (Gai et al., 2000). Oxidation reaction: H2S + 3/2O2 SO2 + H2O However, According to Zhou et al, ER does not significantly influence the content of N-products in the gasification (Zhou et al., 2000). Nevertheless, a quite decrease in NH3 was observed when the ER was increased from 0.22 to 0.50 in this study. The above results may have resulted from the enhanced dilution effect by excess air or thermal cracking by the bed temperature increased linearly with ER when the feeding rate was kept constant. IV. Conclusions Fukuyama H., Terai S., Uchida M., Cano J.L., Ancheyta J., Active carbon catalyst for heavy oil upgrading, Catal Today, 98, (2004). Gai C., Dong Y., Zhang T., Distribution of sulfur species in gaseous and condensed phase during downdraft gasification of corn straw, Energy, 64, (2014). Lasa H.D., Salaices E., Mazumder J., Lucky R., Catalytic steam gasification of biomass: catalysts, thermodynamics and kinetics, Chem Rev, 111, (2011). Marrero T.W., McAuley B.P., Sutterlin W.R., Morris J.S., Manahan S.E., Fate of heavy metals and radioactive metals in gasification of sewage sludge, Waste Manag, 24, (2004). Shen Y., Chars as carbonaceous adsorbents/catalysts for tar elimination during biomass pyrolysis or gasification, Renew Sust Energ Rev, 43, (2015). Simell, P., Stahlberg, P., Kurkela, E., Albrecht, J., Deutsch, S., Sjostrom, K., Provisional protocol for the sampling and analysis of tar and particulates in the gas from large-scale biomass gasifier. Version Biomass and Bioenergy, 18, (2000). Zhou J., Masutani S.M., Ishimura D.M., Turn S.Q., Kinoshita C.M., Release of fuel bound nitrogen during biomass gasification, Ind Eng Chem Res, 39, (2000). In this study, Gasification of dried sewage sludge was performed in a three-stage gasifier consisting of an auger as well as fluidized and fixed bed reactors to produce a producer gas with low-levels of contaminants. The application of activated carbon also helped to reduce impurities contents in producer gas. When ER increased, a significant decrease in the H2 and impurities contents of producer gas was observed. The lowest tar, NH3, and H2S contents in the producer gas from the three-stage gasifier were 76 mg/nm3, 713, and 611 ppm, respectively. Acknowledgements This work was supported by the New & Renewable Energy Core Technology Program of the Korea 856
412 Life Cycle Assessment of a Maintenance Process for a Training Aircraft Yasin Sohret 1*, Selcuk Ekici 2, Onder Altuntas 2, T. Hikmet Karakoc 2 1 Suleyman Demirel University, Keciborlu Vocational School, Aircraft Technology Program, Isparta, TR-32700, Turkey 2 Anadolu University, Faculty of Aeronautics and Astronautics, Department of Airframe and Powerplant Maintenance, Eskisehir, TR-26470, Turkey * [email protected] Abstract In aviation industry, safety is one of the most important issues. For a reliable and safe flight, maintenance of aerial vehicles and engines is mandatory. Additionally, maintenance plays a key role for keeping efficiency of the system high. Within this scope, life cycle assessment of a regular 50 hourly maintenance process of Cessna type training aircraft is conducted. During the assessment, start of the engine before maintenance, replacement of the oil filter, test procedure of the sparking plugs, compressor test, cleaning of the engine and start of the engine after maintenance are taken into account. In the end of the study, normalization and characterization values for the maintenance, electricity consumption during the maintenance and utilized fuel are obtained. Regarding number of this type aircraft all over the world, the present study has a significant contribution to the literature. Authors also intend to introduce an approach could be useful for assessment of large body type aircraft still in service. Keywords: Aircraft, aviation, Cessna, LCA, maintenance. I. Introduction In recent years, different sectors have entered to determine their own effect on human health and environment with increasing environmental awareness. Selection of the right methodology is a critical parameter to calculate the effects on human health and environment. One of the most commonly used method is Life Cycle Assessment (LCA) in the literature (Rebitzer et al., 2004; Tukker, 2000). Therefore, LCA can be utilized to create public awareness about energy input/output, resource cunsumption, material production, maintenance and disposal/recyclling (Hamzi et al., 2008). LCA is defined by the ISO (International Organization for Standardization) (European Committee for Standardization, 2006). LCA is used by many researchers in many different fields in the aviation sector. Especially, LCA is a popular method in the evaluation of aviation fuels in aviation sector. Pereira et al. (2014) used the Life Cycle Assessment for aviation fuels and compared the suitability of natural gas with hydrogen as an alternative fuel. Analyses were carried out for the short (<5000 km) and long (>5000 km) flights for six typical aircrafts. As a result, LH2 from SMR has less impacts from jet fuel A in terms of environmental (%13) and social impacts (%21). Blakey et al. (2011) presented a review of the use of alternative fuels in aviation gas turbines. A lot of aviation alternative fuels with conventional fuels is compared in terms of CO2 equivalent used LCA in study. Lokesh et al. (2015) assessed the impact of biojet fuels on jet engine performance. Analyses were made from cradle to grave used life cycle greenhouse gas model (GHG) for Bio-Synthetic Paraffinic Kerosene (Bio-SPKs) versus conventional Jet-A. Han et al. (2013) carried out LCA of bio-based aviation fuels. Bio-based jet fuel was estimated to reduce greenhouse gas (GHG) emissions. Li and Mupondwa (2014) conducted LCA of biodiesel and hydroprocessed renewable jet fuel derived from camelina oil in the Canadian Prairies. Environmental impact assessment parameters are global warming potential, human health, ecosystem quality and energy resource consumption in article. Another field of application of Life Cycle Analysis is service life phase of commercial aircraft in aviation sector. Howe et al. (2013) determined as comparative environmental effect of each servise life phase of an Airbus A320 commercial aircraft used life cycle assessment method. Study was conducted in accordance with ISO 14040/44. As a result, the manufacturing phase has very low contribution in the overall service emissions. Assessing the sustainability of the countries through life cycle analysis is available articles in literature. Atilgan and Azapagic (2016) conducted life cycle sustainability assessment of the electricity sector from the point of environmental, economic and social aspects in Turkey. Study was used twenty life cycle sustainability indicators (11 environmental, 3 economic and 6 social). As a result, Geothermal power is determined most logical power in accordance with 6 environmental impacts. In this study, life cycle assessment of a regular 50 hourly maintenance process of Cessna type training aircraft is conducted. During the assessment, start of the engine before maintenance, replacement of the 857

413 oil filter, test procedure of the sparking plugs, compressor test, cleaning of the engine and start of the engine after maintenance are taken into account. II. Materials and Method II.1. Training Aircraft The training aircraft examined in the current study is a Cessna 172 Skyhawk incidental to Anadolu University Faculty of Aeronautics and Astronautics. It is a four-seat, single-engine, high wing, fixed-wing, piston-prop engine powered aircraft and shown in Fig. 1. Cessna family training aircraft are commonly used all over the world for pilot training. Variations of Cessna family are summarized in Tab. 1. Tab. 2: Emission indexes of IO-540 piston-prop engine (FOCA, 2007). Engine Fuel Load min -1 ) (kg) HC (g) CO (g) NOx (g) In the present study, combustion equation is written based upon emission index data given in Tab. 2. On the other hand, before maintenance engine is run for a length of time and a constant load. That step of procedure aims to check indicators. Operating duration for each engine operating load is given in Tab. 3. Tab.3: Engine operating load and duration Engine Load min -1 ) Duration (min) Fig. 1: Cessna type training aircraft (Anadolu University, 2016) Tab. 1: Cessna training aircraft family variations Cessna 190 Cessna 195 Cessna 205 Super Skywagon Cessna 206 Stationair & Super Skylane Cessna 207 Skywagon, Stationair 7 & 8 Cessna 208 Caravan Cessna 550 Citation II, Cessna Citation Bravo Cessna 551 Citation IISP Cessna S550 Citation SII Cessna Citation 560XL Excel, XLS, XLS+ Cessna 650 Citation III, Citation VI, Citation VII Cessna 680 Citation Sovereign Cessna 750 Citation X Cessna 421 Golden Eagle Cessna 425 Conquest I Cessna 441 Conquest II Cessna 500 Citation I Cessna 501 Citation ISP Cessna 510 Citation Mustang Cessna 525 Citation Jet, CJ1, CJ1+ II.2. Maintenance Process There are many maintenance procedure for piston-prop engines. Respecting its frequency, environmental impact of 50-hours maintenance is practically significant. In the framework of the present study, maintenance procedure of IO-540 Lycoming piston-prop engine is carried out. İn Tab. 2, emissions data of the engine according to FOCA (2007) is given. During the maintenance engine oil filter is replaced. Additionally, lubraction oil is 13 quartz and it is 12.1 litres. From point of training flight, it means 48.1 litres according to 4 maintenance per 225 hours flight duration. Residual lubrication oil is transferred to a cement plant for energy generation. The engine has 12 sparking plugs. At each maintenance process, each plug is tested for 120 seconds period. Thus, electricity consumption is remarkable. Pistons are taken under leakage test. When piston reaches to top dead center, pressurized air by a compressor is supplied for 120 seconds. So, electricity consumption is in question. Pressurized air is also used for cleaning of the engine. This step of the maintenance process takes 10 mins of time. After cleaning, engine is started according to engine loads and operating durations given in Tab. 3. II.3. Life Cycle Assessment The current study was conducted according to ISO 14044, Ecoinvent inventory database, and Eco- Indicator (H) weighting method was used to calculate life cycle impact on human health, eco system quality and resources. Within this scope, three different categories are taken into account: fossil fuels, respiratory inorganics, respiratory organics, climate change, land use, carcinogens, ecotoxicity, minerals, radiation and ozone layer depletion. For this purpose, SimaPro 7.3 software is used to perform life cycle assessment. Damages are significantly beneficial to understand impact of emissions on environment. Thus, damages on human health, ecosystem quality, resource are required to be examined. Human health damage is associated with ozone layer 858
414 depletion, radiation, climate change, respiratory organics and inorganics, carcinogens. Disability Adjusted life years is a defined unit by World Health Organization to measure human health damage. It enables us to comprehend life quality of people by using statistical and medical information. The quality of ecosystem is composed of three damage categories in LCA: These are land use, acidification/eutrophication and ecotoxicity. Ecotoxicity are described as a percentage of all the species living under toxic effects in the environment. Ecotoxic substances diffuse water, soil and air. Hence the unit of damage is measured by the unit of (PAF m 2 yr kg -1 ). Acidification/Eutrophication is used to indicate impact on targeted species in nature. The aforementioned damage is a result of substances diffusing into air. So that, the unit of (PAF m 2 yr kg -1 ) reveals environmental impacts of Acidification/Eutrophication. As a known fact, humankind always intends to consume high quality energy resources. For the future, more effort for high quality consumption requirement is assumed in addition to achieving low quality energy forecasting. The aferomentioned extra effort is called as surplus energy. For each evaluated process and system, limitations of LCA should be well defined. In the present study, system boundaries are designated to be gate to gate. Gate to gate approach contains, fuel and electricity consumptions and maintenance. Another assumption is the training flight duration. Flight duration is commonly hours. Seasonal variation, faulty in planning and health problems of pilot are fundamental reasons of flight duration variation (FAA, 2016). Thus, flight duration for a pilot candidate is assumed to be 250 hours in the present study. III. Results and Discussions In Tab. 4 and Fig. 2, life cycle assessment characterization of a training aircraft s 50 hours periodical maintenance process. According to Fig. 2, characterization values are given for overall engine maintenance, electricity and fuel consumptions. Herein, impact of overall maintenance can be neglected compared to others. On the other hand, electricity and fuel consumptions have different characteristic impacts as comprehended from Fig. 2. Abiotic depletion, acidification, global warming, human toxicity, fresh water aquatic toxicity, marine aquatic ecotoxicity and photochemical oxidation effect of fuel consumption is significant. From prespective of eutrophication and terrestrial ecotoxicity, impact of fuel and electricity consumptions are found to be approximately close to each other. Electricity consumption has a great influence on ozone şayer depletion. The main reason of that is fossil fuel, especially coal, utilization to generate electricity. 859 Fig. 2: Characterization CML2 Baseline Tab. 4: Characterization CML2 Baseline Calculation: Analyze Results: Product: Method: Indicator: Unit: % Skip categories: Exclude infrastructure processes: Exclude long-term emissions: Sorted on item: Sort order: Impact category Abiotic depletion Acidification Eutrophication Global warming (GWP100) Ozone layer depletion (ODP) Human toxicity Fresh water aquatic ecotox. Marine aquatic ecotoxicity Terrestrial ecotoxicity Photochemical oxidation Unit Impact assessment Regular 50 hourly maintenance process of Cessna CML 2 baseline 2000 V2.05 / World, 1995 Characterization Never No No Impact category Ascending Maintena Total nce Electric ity Gasolin e kg Sb eq kg SO eq kg PO eq kg CO eq kg E E E- CFC eq kg 1,4-DB eq kg 1,4-DB eq kg 1,4-DB eq kg 1,4-DB eq kg C2H eq Life cycle assessment normalization results obtained from CML2 baseline 2000 method are given in Tab. 5 and plotted in Fig. 3. Within this scope, the highest impact on marine aquatic ecotoxicity is caused by fuel and electricity consumption because of providing fuel from overseas countries. However, the present study is performed for Eskisehir city of Turkey. Thus, marine aquatic ecotoxicity may be disregarded.
415 Tab. 5: Normalization CML2 Baseline Calculation: Analyze Results: Product: Method: Indicator: Skip categories: Exclude infrastructure processes: Exclude long-term emissions: Sorted on item: Sort order: Impact category Abiotic depletion Acidification Eutrophicatio n Global warming (GWP100) Ozone layer depletion (ODP) Human toxicity Fresh water aquatic ecotox. Marine aquatic ecotoxicity Terrestrial ecotoxicity Photochemic al oxidation Impact assessment Regular 50 hourly maintenance process of Cessna CML 2 baseline 2000 V2.05 / World, 1995 Normalization Never No No Impact category Ascending Total Maintenance Electricity Gasoline E E E E E E E E E E E E E E E E E E E E E E E E E E E E E E-12 Accessed on: March 1, Atilgan, B., & Azapagic, A. (2016). An integrated life cycle sustainability assessment of electricity generation in Turkey. Energy Policy, 93, Blakey, S., Rye, L., & Wilson, C. W. (2011). Aviation gas turbine alternative fuels: A review. Proceedings of the combustion institute, 33(2), European Committee for Standardization, Environmental Management Life Cycle Assessment Principles and Framework (ISO 14040:2006). CEN, Brussels. FAA, Federal Aviation Administration. Available at: ecently_published/media/2120-aj67nprm.pdf. Accessed on: March 1, FOCA, Foca Data Base for Aircraft Piston Engine Emission Factors, (2007). Hamzi R., Londiche H., Bourmada N., Fire-LCA model for environmental decision-making. Chemical Engineering Research and Design 86, Han, J., Elgowainy, A., Cai, H., & Wang, M. Q. (2013). Life-cycle analysis of bio-based aviation fuels. Bioresource technology, 150, Howe, S., Kolios, A. J., & Brennan, F. P. (2013). Environmental life cycle assessment of commercial passenger jet airliners. Transportation Research Part D: Transport and Environment, 19, Fig. 3: Normalization CML2 Baseline IV. Conclusions The current paper presents a life cycle assessment of manintenance process of a training aircraft. Regarding number of this type aircraft all over the world, the present study has a significant contribution to the literature. Authors also intend to introduce an approach could be useful for assessment of large body type aircraft still in service. Acknowledgements Authors are thankful to Anadolu and Suleyman Demirel Universities of Turkey for the provided support. References Anadolu University. Avaliable at: 860 Li, X., & Mupondwa, E. (2014). Life cycle assessment of camelina oil derived biodiesel and jet fuel in the Canadian Prairies. Science of the Total Environment, 481, Lokesh, K., Sethi, V., Nikolaidis, T., Goodger, E., & Nalianda, D. (2015). Life cycle greenhouse gas analysis of biojet fuels with a technical investigation into their impact on jet engine performance. Biomass and Bioenergy, 77, Pereira, S. R., Fontes, T., & Coelho, M. C. (2014). Can hydrogen or natural gas be alternatives for aviation? A life cycle assessment. International journal of hydrogen energy, 39(25), Rebitzer, G., Ekvall, T., Frischknecht, R., Hunkeler, D., Norris, G., Rydberg, T., Schmidt, W.P., Suh, S., Widema, B.P. & Pennington, D.W. (2004). Life cycle assessment: Part 1: Framework, goal and scope definition, inventory analysis, and applications. Environment international, 30(5), Tukker, A. (2000). Life cycle assessment as a tool in environmental impact assessment. Environmental impact assessment review, 20(4),
416 Development and Multi Objective Exergy Based Optimization of a Solar Micro CHP System Based on Organic Rankine Cycle for domestic applications Alireza Noorpoor 1, Parisa Heidarnejad 1*, Shoaib Khanmohammadi 2, Nader Javani 3 1 Faculty of Environment, University of Tehran, Tehran, Iran 2 Department of Mechanical Engineering, School of Energy, Kermanshah Universityof Technology, Kermanshah, Iran 3 Department of Mechanical Engineering, Yildiz Technical University, Besiktas, 34349, Istanbul, Turkey * [email protected] Abstract A micro scale solar based combined heating and power (CHP) system integrated with Organic Rankine Cycle (ORC) is proposed in this study. The thermal storage tank is installed to correct the mismatch between the supply of the solar energy and the demand of thermal source consumed by the CHP subsystem, thus the desired system could continuously and stably operate. The analysis studies are undertaken by developing and constructing the codes in Engineering Equation Solver software. The cycle is investigated and optimized from the viewpoint of thermodynamics and thermoeconomics. In base case design, the thermal efficiency, exergy efficiency and total cost rate are found to be 48.45%, 13.76% and $/h. A multi-objective optimization method based on Genetic Algorithm (GA) is applied to determine the best design parameters for the system. The two objective functions utilized in the analysis are the total cost rate and exergy efficiency of the system. Parametric analysis is conducted to assess the effect of design parameters on technical and economical performance of the system. Keywords: Exergy, exergoeconomic, combined heating and power, solar energy, R123, genetic algorithm. I. Introduction The continual uses of fossil fuels to meet our ever-increasing energy demands have led to environmental pollution to air, water and land. Renewable energy sources are alternatives to the depleting fossil fuels and offer improved security of our future energy supply (Qiu, Shao et al. 2012). Among them, solar energy is clean and free with no gas emissions. Combined Heating and Power (CHP) is an integrated system, which provides more than one product. Several studies have been conducted on thermodynamic and thermoeconimc analysis of CHP systems. (Tempesti, Manfrida et al. 2012) proposed two different layouts for a CHP system with two sources: solar energy and geothermal. The result of energy and exergy analysis of these two systems has been compared and evaluated. The same authors (Tempesti and Fiaschi 2013), applied thermoeconomic analysis for the same systems and results showed that when there is a balance between ambient temperature and the solar radiation are in balance, the lowest cost is achievable for the CHP system. (Ahmadi, Almasi et al. 2012) proposed a CHP system for a paper mill and applied thermodynamic analysis and multi objective optimization for it. (Sahoo 2008) carried out the exergoeconomic analysis and optimization of a cogeneration system through evolutionary algorithm. The results showed that the cost of electricity and in optimum case is 9.9% lower in comparison with the base case. (Ahmadi and Dincer 2010) performed the exergoenvironmental analysis and optimization of a CHP plant using multimodal Genetic Algorithm. The thermodynamic results showed that by applying GA developed code, 9.80% improvement in objective function is achieved. (Mikielewicz and Mikielewicz 2010) proposed a thermodynamic criterion for selection of a fluid both for subcritical and supercritical organic Rankine of a CHP system. Results showed that of the 20 fluids investigated, ethanol, R123 and R141b appear as the most suitable for small-scale domestic CHP applications. (Pantaleo, Ciliberti et al. 2015) proposed different configurations for a 1MW biomass-chp plant and compared them based on thermo-economic analysis. (Campos-Celador, Pérez-Iribarren et al. 2012) applied a thermoeconomic analysis to the annual operation of a micro-cogeneration installation in a tertiary sector building. For determination of the cumulative exergy consumption of the different components of the plant, LCA has been developed. Moreover A combined production cost value has been defined to compare the micro-chp unit and the conventional production system which results in 34.6 and c /kwhex respectively. (Liu, Shao et al. 2011) investigated a biomass-fired micro-scale CHP system with an Organic Rankine Cycle (ORC) comparing three organic working fluids. They also conducted a parametric study to study the variation of the performance of the CHP system with selected design parameters. The main objective of this research is to improve understanding of a CHP system integrated to Organic Rankine Cycle (ORC) driven by solar energy. Thermodynamic and thermoeceonomic analysis of the proposed system is carried out by developing code through EESsoftware. Sensitivity analysis is performed by varying selected design parameters for assessing their effects on exergy efficiency and product cost rate. Multi 861
417 objective optimization of the system is conducted using GA in which exergy efficiency and product cost rate are considered as objective functions in order to determine the optimum design of the system. II. Analysis and Modeling II.1. System description Figure 1 shows the schematic of proposed solar-based CHP system. The extracted flow of the turbine goes to the heater to supply the heat to the heating user. Turbine exhaust enters the condenser to reject the heat to the cooling water, and then these two streams (outlet of heater and condenser) are mixed in mixer and pumped into economizer, evaporator and super heater to absorb heat from heat source. Evacuated tube solar collectors are utilized to collect the solar radiation because of its low costs. A thermal storage system and an auxiliary boiler are used to provide continuous heating and power output when solar radiation is insufficient. Auxiliary boiler utilizes natural gas. II.2. Exergy analysis The maximum amount of work, which can be extracted from a given form of energy, is called exergy. Exergy is an attribute of system and environment together (Kotas 1995). Exergy of a system is sum of 4 components: physical exergy, kinetic exergy chemical exergy E x KN E xch, potential exergy E x PT Ex PH and. Kinetic and potential exergy considered to be negligible here since elevation changes are small and speeds are relatively low (Cengel and Boles 2008). By applying second law of thermodynamics, an exergy balance can be obtained as follows (Khanmohammadi, Ahmadi et al. 2015): E Q m iexi m eexe E w E D (1) i Subscripts i and e represent the entering and existing control volumes, is the exergy destruction and other terms are as follows (Ameri, Ahmadi et al. 2008): E T T E D 0 Q (1 ) Q (2) Ew W (3) Here, E and Q E are the corresponding exergy w rates associated with heat transfer and work across the boundary of a control volume respectively, T is the absolute temperature and the subscript 0 refers to the reference environment conditions. II.3. Exergoenomic Analysis principles to provide the system designer or operator with the information not available through conventional energy analysis and economic evaluations, but crucial to the design and operation of a cost-effective system (Bejan, Tsatsaronis et al. 1996). In SPECO method which is applied in this study, first exergy of all streams should be calculated. Second fuel and product for each component should be defined (Bejan, Tsatsaronis et al. 1996). Third, a cost balance applied to the kth system component shows that the sum of cost rates associated with all exiting exergy streams equals the sum of cost rates of all entering exergy streams plus the appropriate charges due to the capital investment CI Z k and operating and maintenance expenses The sum of the last two terms is denoted by OM Z k Accordingly, for a component receiving a heat transfer and generating power, we have: e i C C C C Z e, k W, k Q, k i, k k i C c E x i i (4) (5) Cost rate balances, auxiliary equations, and the corresponding equations for for the solar based CI Z k micro CHP system are listed in Table 1 and Table 2. Capital investment of a component is converted to the cost rate by multiplying it by 1/t, the Capital Recovery Factor (CRF) and maintenance factor ( ). Here, t is the number of hours per year that the unit operates and the CRF is an economic parameter that depends on the interest rate (i) and the estimated component lifetime (N). The CRF is determined as Eq. (6) (Khanmohammadi, Atashkari et al. 2016): N i(1 i) CRF N (6) (1 i) 1 In the mentioned components in Table 2, investment cost rate is calculated by Eq. (7) (Mohammadkhani, Shokati et al. 2014): Z CI Z CRF t (7) k k / The parameters in Eqs. (6) and (7) are assumed to be: N=20 year, i=10%, =1.06, t=7446h. All cost data used in an economic analysis must be brought to the reference year (in this study 2014) using an appropriate cost index (Bejan, Tsatsaronis et al. 1996). In this study, Chemical Engineering Plant Cost Index (CEPCI) index (CEPCI. 2010) is applied for updating all costs to the year Z k.. Exergoeconomics is an engineering tool that is a combination of exergy analysis and economic 862
418 Fig. 1: Layout of solar micro CHP system based on Organic Rankine Cycle Tab. 1: Cost rate balances and auxiliary equations for components (Khanmohammadi, Azimian et al. 2013) Components Cost rate balance Auxiliary equation Turbine C 1 Zturb C2 C3 C w, turb Pump 2 C11 Cw, pump2 Z pump1 C12 - Heater C 2 C 7 Z H C 8 C 9 Economizer C 12 C 17 Z eco C 13 C 18 Evaporator C 13 C 16 Z eva C 14 C 17 Super Heater C 14 C 15 Z SH C 1 C 16 Condenser C 5 C 3 Z cond C 6 C 4 Auxiliary Boiler C 19 C NG Z AB C 15 - Storage Tank Solar collector 21 c c 1 2 c3 c2 c 9 c17 c 18 c 16 c 17 c 15 c16 c3 c4 C 18 C21 Z ST C19 C20 C L, ST 20 c21 C 20 C s Z coll C c s 0 Tab. 2: Capital cost relations of the system components (El-Emam and Dincer 2013, Martínez-Lera, Ballester et al. 2013, Pierobon, Nguyen et al. 2013, Mohammadkhani, Shokati et al. 2014) Components Capital cost c CI Turbine 2 Electric generator Pump Heat Exchanger log ( Z ) log ( W ) log W CI 0.95 Z 60W Z Z 10 Turb 10 Turb 10 Turb Elec Elec 3540W CI 0.71 pump pump CI HE AHE CI Condenser Z 1773m5 Storage Tank Cond CI Z ST 4042 V ST III. Results and Discussion The thermodynamic and thermoeconomic analyses and optimization of a solar domestic CHP cycle with 2.7 kw electric output and 11kW heating output are conducted. The daily radiation is taken as 2.21 kwh/m 2 (Paul W. Stackhouse 2013). Thermodynamic and thermoeconomic modeling of the system has been conducted based on simulation code in EES software ( using some inputs 863 which are listed in Table 3. The system thermal and exergy efficiency is determined to be 48.45% and 13.76%. Effect of turbine inlet pressure The effect of turbine inlet pressure on total cost rate and exergy efficiency of the system for fixed values of [T1=130 C, P2=300kPa, T29=80 C] is shown in Figure 2.
419 Figure 2 illustrates that investment cost rate decreases 1% as turbine inlet pressure varies, therefore, total cost rate decreases 3%. This means that if turbine works at higher pressures, it would be cost effective. On the other hand, exergy efficiency of the system decreases 5% as turbine inlet pressure increases. Tab. 3: Input data for the system modeling Prameter Value Turbine inlet pressure 1000 kpa Turbine inlet temperature 130 o C Turbine back pressure 300 kpa Turbine mass flow extraction ratio 0.5 Turbine isentropic efficiency 0.85 Pump isentropic efficiency 0.7 Cooling water inlet pressure 300 kpa Cooling water inlet temperature 15 o C Cooling water mass flow rate 0.4 kg/s Condenser temperature difference 10 o C Heater temperature difference 20 o C Heater outlet temperature 80 o C Super heater temperature difference 30 o C Approach temperature difference 15 o C Surface area of solar collector 15.7 m 2 Monthly average insolation, H 7.99 MJ/m 2 day (December) Monthly averaged insolation clearness index, KT 0.52 (December) Tilt angle 37.4 Heating load 11 kw Power 2.7 kw Effect of turbine inlet temperature The influence of turbine inlet temperature on total cost rate and exergy efficiency of the system is illustrated in Figure 3 for fixed values of [P1=1000kPa, P2=300kPa, T29=80 C]. It is indicated that by increasing turbine inlet temperature, investment cost rate decreases slightly because of slight increment in exergy efficiency and as a result, product cost rate decreases only 5%. Effect of turbine outlet pressure Figure 4 represent the effect of turbine outlet pressure on total cost rate and exergy efficiency of the system for fixed values of [P1=1000kPa, T1=130 C, T29=80 C]. Figure 4 indicates that, with variation of about 200kPa in turbine outlet pressure, investment cost rate increases 3% and consequently product coat rate increases 6%. Turbine output power is constant, an increment in turbine outlet pressure leads an increment in heater exergy, and as a result, exergy efficiency improves. Total cost rate ($/h) Turbine inlet pressure (kpa) Fig. 2: Variation of total cost rate and exergy efficiency of the system versus turbine inlet pressure. Total cost rate of system ($/h) Total cost rate of system ($/h) Fig. 3: Variation of total cost rate and exergy efficiency versus turbine inlet temperature. Fig. 4: Variation of total cost rate and exergy efficiency versus turbine outlet pressure. Effect of heater outlet temperature Turbine inlet temperature T 1 (C) Figure 5 represents the effect of heater outlet temperature on total cost rate and exergy efficiency of the system for fixed values of [P1=1000kPa, T1=130 C, P2=300kPa]. Figure 5 represents that, investment cost rate decreases 2% due to increment in exergy efficiency and as a result, product cost rate decreases 1% Turbine outlet pressure (kpa) Exergy efficiency of system (%) Exergyefficiency of system (%) Exergy efficiency of system (%) 864
420 Total cost rate of system ($/h) Exergy efficiency of system (%) Objective 2: C C Z (9) P,tot F,tot tot Tab. 4: Decision variables and constraints values Decision variables value Turbine inlet pressure 850 P1 ( kpa) 1000 Turbine inlet temperature 115 T1 ( C) 145 Turbine back pressure 250 P2 ( kpa) 400 Heater outlet temperature 50 T28( C) Heater outlet temperature (C) Fig. 5: Variation of total cost rate and exergy efficiency versus turbine backpressure. IV. Optimization In this section, multi objective optimization is simultaneously carried out through optimizing exergy efficiency ( tot ) and total cost rate ( C p, tot ) of CHP system. Multi-objective optimization problems, generally, show a possibly uncountable set of solutions whose evaluated vectors represent the best possible trade-offs in the objective function space (Sayyaadi, Saffari et al. 2010, Khanmohammadi, Atashkari et al. 2015). In this work, genetic meta-heuristic algorithm (GA) in Matlab software using the modeling results obtained by EES is applied for optimization of CHP plant. GA is an optimization tool to simulate the natural evolution process and proposed by John Holland (Holland 1992). The structure of GA starts with the random generation of an initial set of individuals, the initial population. The individuals are evaluated and ranked. Since the number of individuals in each population is kept constant, for each new individual an old one has to be discarded, in general the one with the worst fitness value. There are two basic operators to generate new individual: mutation and crossover. The more simple one is mutation. During mutation, a couple of bits of the parameter string are flipped at random. Mutation may be applied to offspring produced by crossover or, as an independent operator, at random to any individual in the population (Koehn 1994). The selected decision variables in this work are turbine inlet temperature ( T 1 ), turbine inlet pressure ( turbine outlet pressure ( P 2 ) and heater outlet T temperature ( 28 ). Constraints are related to decision variables which are illustrated in Table 4. For the CHP considered in this paper, two objectives such as exergy efficiency (to be maximized) and total cost rate (to be minimized) are considered and formulated as follows: Objective 1: Ex H W elec tot Ex Ex (8) s NG P 1 ), By applying GA through Matlab software and using above constraints and objective functions, optimization is carried out and the results are shown in Figure 6. IV. 1. Optimization Results Figure 6 exhibits the Pareto frontier solution for the CHP system shown in Figure 1. The objective functions were indicated in Equations 8 and 9 in multi objective optimization. As shown in this figure, the total cost rate increases slightly, while the exergy efficiency increases to about 15.5%. Increasing the exergy efficiency from 15.5% to 15.75% increases the total cost rate significantly. As shown in Figure 6, both exergy efficiency and total cost rate are maximum at point D. On the other hand, the minimum value for the total product cost rate occurs at design point A which is the optimal situation when total cost rate is the sole objective function, while design point D is the optimum point when exergy efficiency is the sole objective function. In multi-objective optimization, a process of decision-making for selection of the final optimal solution from the available solutions is required. The process of decision-making is usually performed with the aid of a hypothetical point, at which both objectives have their optimal values. The closest point of the Pareto frontier to the ideal point might be considered as a desirable final solution (point C). Fig. 6: Pareto Frontier for CHP system Note that in multi-objective optimization and the Pareto solution, each point can be utilized as the optimized point. Therefore engineering experiences and importance of each objective plays an important role in the process of decision making suggesting that each may select a different point as for the 865
421 optimum solution depending on the needs. Table 5 shows all the design parameters for points A, B, C and D. Tab. 5: Optimized values for design parameters of the system for four points on the Pareto frontier from multi-objective optimization P 1 T 1 P 2 T 29 Exergy efficiency (%) Total cost rate ($/h) A B C D V. Conclusion w Power The present work provides thermodynamic and thermoeconomic modeling to evaluate a solar CHP integrated with ORC. By formulating exergy balance, cost balance and auxiliary equations for each component and solving them through EES software, thermal efficiency, exergy efficiency and total cost rate were calculated to be 48.45%, 13.76% and $/h. Then parametric analysis is done by assessing the effect of thermodynamic variables on total cost rate and exergy efficiency of the system. The results show that lower CHP total cost rate is obtained at higher turbine inlet pressure and temperature and heater outlet temperature but lower turbine outlet pressure. In the last section, multi objective optimizations are carried out through GA in order to determine the best design parameters of the system. Nomenclature A Surface area (m 2 ) c Cost per exergy unit ($/GJ) Ċ Cost rate ($/h) i Interest rate (%) m Mass flow rate (kg/s) t System operating hours (hour) V Volume W X Power (kw) Exergy (kw) Z Investment cost ($) Ż Investment cost rate ($/h) Subscripts AB Auxiliary Boiler Coll Solar collector Cond Condenser e Outlet Eco Economizer elec Electrical gen Electric generator H Heater HE Heat Exchanger i Inlet NG Natural Gas pump Pump Q Heat S Sun SH Super Heater ST Storage Tank turb Turbine 866 Super scripts CI Capital Investment N Component lifetime (year) OM Operating and Maintenance Greek symbols ε Exergy efficiency η Thermal efficiency Maintenance factor Abbreviation CHP Combined Heating and Power CEPCI Chemical Engineering Plant Cost Index CRF Capital Recovery Factor EES Engineering Equation Solver ORC Organic Rankine Cycle SPECO Specific Exergy Costing References Ahmadi, P., A. Almasi, M. Shahriyari and I. Dincer (2012). "Multi objective optimization of a combined heat and power (CHP) system for heating purpose in a paper mill using evolutionary algorithm." International Journal of Energy Research 36(1): Ahmadi, P. and I. Dincer (2010). "Exergoenvironmental analysis and optimization of a cogeneration plant system using Multimodal Genetic Algorithm (MGA)." Energy 35(12): Ameri, M., P. Ahmadi and S. Khanmohammadi (2008). "Exergy analysis of a 420 MW combined cycle power plant." International Journal of Energy Research 32(2): Bejan, A., G. Tsatsaronis and M. J. Moran (1996). Thermal design and optimization. New York, John Wiley & Sons Inc. Campos-Celador, Á., E. Pérez-Iribarren, J. M. Sala and L. A. del Portillo-Valdés (2012). "Thermoeconomic analysis of a micro-chp installation in a tertiary sector building through dynamic simulation." Energy 45(1): Cengel, A. Y. and M. A. Boles (2008). Thermodynamics: An engineering approach. New York, McGraw Hill.
422 CEPCI. (2010). "Chemical Engineering Plant Cost Index." Chem. Eng.: 76. El-Emam, R. S. and I. Dincer (2013). "Exergy and exergoeconomic analyses and optimization of geothermal organic Rankine cycle." Applied Thermal Engineering 59(1): Holland, J. H. (1992). Adaptation in natural and artificial systems: an introductory analysis with applications to biology, control, and artifical intelligence. Massachusetts, MIT Press. "engineering equation solver (EES)." Khanmohammadi, S., P. Ahmadi, K. Atashkari and R. K. Kamali (2015). "Design and Optimization of an Integrated System to Recover Energy from a Gas Pressure Reduction Station." Progress in Clean Energy, Volume 1: Analysis and Modeling: 89. Khanmohammadi, S., K. Atashkari and R. Kouhikamali (2015). "Exergoeconomic multi-objective optimization of an externally fired gas turbine integrated with a biomass gasifier." Applied Thermal Engineering 91: Khanmohammadi, S., A. R. Azimian and S. Khanmohammadi (2013). "Exergy and exergo economic evaluation of Isfahan steam power plant." International Journal of Exergy 12(2): Koehn, P. (1994). "Combining genetic algorithms and neural networks: The encoding problem." Kotas, T. J. (1995). The exergy method of thermal plant analysis. Malabar, Fla., Krieger Pub. Procedia 75: Paul W. Stackhouse, J., Ph.D. (2013). NASA Surface meteorology and Solar Energy. Pierobon, L., T.-V. Nguyen, U. Larsen, F. Haglind and B. Elmegaard (2013). "Multi-objective optimization of organic Rankine cycles for waste heat recovery: Application in an offshore platform." Energy 58(0): Qiu, G., Y. Shao, J. Li, H. Liu and S. B. Riffat (2012). "Experimental investigation of a biomass-fired ORC-based micro-chp for domestic applications." Fuel 96: Sahoo, P. (2008). "Exergoeconomic analysis and optimization of a cogeneration system using evolutionary programming." Applied thermal engineering 28(13): Sayyaadi, H., A. Saffari and A. Mahmoodian (2010). "Various approaches in optimization of multi effects distillation desalination systems using a hybrid meta-heuristic optimization tool." Desalination 254(1): Tempesti, D. and D. Fiaschi (2013). "Thermo-economic assessment of a micro CHP system fuelled by geothermal and solar energy." Energy 58: Tempesti, D., G. Manfrida and D. Fiaschi (2012). "Thermodynamic analysis of two micro CHP systems operating with geothermal and solar energy." Applied Energy 97: Liu, H., Y. Shao and J. Li (2011). "A biomass-fired micro-scale CHP system with organic Rankine cycle (ORC) Thermodynamic modelling studies." Biomass and Bioenergy 35(9): Martínez-Lera, S., J. Ballester and J. Martínez-Lera (2013). "Analysis and sizing of thermal energy storage in combined heating, cooling and power plants for buildings." Applied Energy 106: Mikielewicz, D. and J. Mikielewicz (2010). "A thermodynamic criterion for selection of working fluid for subcritical and supercritical domestic micro CHP." Applied Thermal Engineering 30(16): Mohammadkhani, F., N. Shokati, S. M. S. Mahmoudi, M. Yari and M. A. Rosen (2014). "Exergoeconomic assessment and parametric study of a Gas Turbine-Modular Helium Reactor combined with two Organic Rankine Cycles." Energy 65(0): Pantaleo, A. M., P. Ciliberti, S. Camporeale and N. Shah (2015). "Thermo-economic Assessment of Small Scale Biomass CHP: Steam Turbines vs ORC in Different Energy Demand Segments." Energy 867
423 Evaluation of Bio oils produced from Pomegranate Pulp Catalytic Pyrolysis Eylem Pehlivan 1*, Nurgul Ozbay 1 1 Bilecik Şeyh Edebali University, Faculty of Engineering, Department of Chemical and Process Engineering, Bilecik, 11000, Turkey * [email protected] Abstract In order to increase the oil yield, biomass pyrolysis experiments were performed in a fixed bed tubuler reactor with selected commercial catalyst, namely ZSM-5. Experiments were conducted in a sweeping gas flow rate of 100 cm 3 min -1 nitrogen atmosphere with a heating rate of 100 C min 1, pyrolysis temperature of 550 C and mean particle size of 0.53 mm. In the experiments, the catalyst was used with various percentages, and the effects of the catalyst on the yields and chemical composition of the oils obtained were investigated. Oil yield reached % with the use of ZSM-5, while it was only 35.36% without a catalyst. The pyrolysis oils were examined by using spectroscopic and chromatographic analysis techniques. Bio-oils obtained at the optimum conditions were separated into aliphatic, aromatic and polar sub-fractions. After the application of column chromatography, bio-oils were subjected into elemental, FT-IR and 1H NMR analyses. Aliphatic sub-fractions of bio-oils were analyzed by GC-MS and the obtained results were compared with the results of similar experiments achieved without a catalyst. It was deduced that the fuel obtained via catalytic pyrolysis mainly consisted of lower weight hydrocarbons in the diesel range. Catalysts had productivity and selectivity in converting aliphatic hydrocarbons to aromatic and cyclic compounds in oil products. The most important compounds present in pomegranate pulp bio-oils was phenols. The main phenolic compounds identified in the bio-oils was phenols, alkyl phenols and methoxy phenols. Finally, obtained results were compared with petroleum fractions and evaluated as a potential source for liquid fuels and chemical feedstock. Keywords: Pomegranate Pulp, Catalyst, Pyrolysis, Fuel, Chemical raw materials I. Introduction Due to the advantages of being CO2 neutral, having low sulfur content compared to petroleum fuels, and being easy to transport, renewable biomass-based liquid fuels will become more important in the future as partial alternatives to fossil fuels. In particular, technology that can convert biomass wastes to valuable liquid fuels and chemicals will be important for solving our energy and environmental problems (Murata et al. 2016). Pyrolysis is one of a thermochemical process that is an efficient way of converting biomass into liquids (bio-oil) with gases and char at temperature as relatively low as 300 ºC-600 ºC. Pyrolysis liquids can not be used as transportation fuels directly without prior upgrading due to their high oxygen (40-50 wt. %) and water content (15-30 wt.%), and low H/C ratios. Hydrotreatment and catalytic cracking are the convenient methods for upgrading of bio-oils. Upgrading reactions are similar to petroleum refining with conventional metal catalysts (Co, Mo, and Ni) (Pütün 2010). This is the most probable route to remove the oxygen containing functional groups of bio-oils but these reactions need high H2 pressure. Consequently, to improve bio-oil quality by a removal of oxygen, an increase of calorific value and stability of bio-oil by catalytic reforming of pyrolytic vapors product would require catalysts effective under atmospheric pressure. As known, zeolite cracking of pyrolysis oils has been widely studied (Nokkosmaki 2000-Adam 2006) Zeolite catalysts were are effective to convert the highly oxygenated compounds to aromatic hydrocarbons. Pomegranate (Punica granatum L., punicacea) is one of the oldest fruit species which has been produced and consumed in its native land Cappadocia and the Middle East for thousands of years. In addition to pomegranate being consumed fresh, it can be processed into many products such as pomegranate juice, sour and wine. After production of these products, the pomegranate seed constitutes an important part of the portion of the pulp. The oil content of pomegranate seed is reported to range from % depending on many factors such as seed, growing conditions and climate (Saxena1987). Half of the total world production of pomegranate being held in India by approximately tons followed by Iran by million tons, Turkey by million tons and USA by million tons. According to the data of 2008; Mediterranean region with the amount of tons production (54.46%) meets more than half of Turkey's total pomegranate production. Aegean and southeastern Anatolia regions have 24.42% and 12.88% production rate, respectively ( This study deals with the pyrolysis of pomogranate pulp to examine if it can be considered as a potential renewable energy source. The Pomogranate pulp was pyrolyzed in a fixed-bed reactor. Effect of catalyst 868

424 on the pyrolysis yields was investigated. The chemical composition of the pyrolytic oil was analyzed using a combination of chromatographic and spectroscopic techniques. rate of 100 cm 3.min -1 II. Experimental II.1. Materials Pomegranate pulp have been taken from a fruit factorty in west Anatolia, Turkey. Before the experiments, the sample was dried, milled, sieved and then separated in fractions. Average particles of biomass with a size of mm were used. The main characteristics of the pomegranate pulp (PP) are presented in Table 1. A commercial catalyst ZSM-5 was used as catalyst in the experiments. For its activation, the catalyst was calcinated at 600 ºC for 3.5 hand kept in a desiccator for the experiments. The specifications of the catalyst are given in Table 2. Tab. 1: Properties of the Pomogranate Pulp and Bio-oil Proximate analysis % Ultimate analysis % Bio-oil % Moisture 8.38 C Volatile H Ash 2.51 N Fixed carbon O* Bulk density Empirical CH N 0.03 (g/cm 3 ) 0.50 formula 1O Component analysis % CH 1.502N 0.036O 0. H/C Extractive material 3.70 O/C Hemicellulose Higher calorific value (Mj/kg) Lignin Cellulose* Catalyzer type Tab. 2: Specifications of zeolites. Physical form Surface area (m 2 /g) Pore size (A ) SiO2/Al2O3 ZSM toz II.2. Pyrolysis Experimental studies were conducted in a fixed-bed tubular reactor with a heating rate of 100 ºC.min -1 a final pyrolysis temperature of 550 ºC and a mean particle size of mm. A detailed description of the pyrolysis experiments has already been reported elsewhere (Uzun 2010) and a schematic diagram of the unit is presented in Fig. 1. Dry mixing of the catalyst with samples in-bed mode in the inert gas and performed the pyrolysis experiments. The experiments were conducted to determine the effect of catalyst with various catalyst ratio on the pyrolysis yields in nitrogen atmosphere. The catalyst was mixed with feedstock in different percentages. The catalyst ratio used were 0% (no catalyst) 5, 10, 20 and 25% (w/w) under nitrogen atmosphere with flow 869 Fig. 1: Schematic diagram of the fixed-bed tubular reactor system II.3. Structural analyses Elemental analyses (Leco CHN628, S628) were carried out on bio-oil sample. The analyzed oil was obtained under the experimental conditions giving the maximum oil yield. The elemental composition and calorific value of the bio-oils were determined. An IR spectrometer was used to detect the infrared spectra. The IR spectra were made using a Perkin Elmer Frontier FTIR LR64912C infrared spectrophotometer. Measurements were recorded on thin films between KBr plates. The chemical class compositions of the oils were determined by liquid column chromatographic technique. Oil was separated on activated silica gel ( mesh) pretreated at 170 ºC for 6 h before packing a 0.2x m 2 i.d. column. The column was then sequentially evaluated with n-pentane, toluene and methanol to obtain fractions enriched in aliphatic, aromatic and polar fractions, respectively. Each fraction was dried by rotary evaporation and weighed. All of the oil samples were separated into two fractions as pentane soluble and insoluble compounds (mostly cyclic compounds) by using pentane. The pentane soluble materials were further separated by adsorption chromatography as aliphatic, aromatic and polar bases. Aliphatic base subfraction contains predominantly paraffins and olefins. Aromatic-base subfraction contains mono aromatic compounds usually benzene or its derivatives or PAHs, and considering polar base subfraction it contains phenols, ketones and oxygenated compounds, especially (Ozbay 2006). GC analyses for liquid samples were performed using a GC-MS-Qp 2010 ultra Schimadzu model gas chromatograph and a mass selective detector (HP, USA); a thin film (30 m 0.32 mm, 0.5 μm film thickness), TRB-5MScapillary column supplied from
425 Teknokroma was used. Carrier gas was helium with a flow rate of 1 cm 3 min 1. The temperature program was 35 C for 3 min. followed by 5 C min 1 heating rate to 280 C. The 1 H NMR (Proton nuclear magnetic resonance) spectrum of the bio-oil was recorded using an Agilent VNMRS 500 MHz High Performance Digital FT-NMR Instruments. The samples were dissolved in deuterated chloroform containing TMS (tetramethylsilane) as a standard. III. Results and discussion III.1. Effect of Catalysist on the Product Yields The dependence of the product yields of pomegranate pulp., having an average particle size of mm, pyrolysis temperature of 550ºC, and heating rate of 100ºC min -1 at a sweeping gas flow rate of 100 cm 3 min -1 on the catalyst percentage is shown in Fig.2. Oil yield raised with increased catalyst percentage and reaches its maximum with using 20% by weight of ZSM-5. The oil yield, which was 35.36% without catalyst, reached the maximum value of 43.56% by using this catalyst at 20% by weight. The gaseous product yield was reduced when compared to the without catalyst test with the catalyst While looking at the gaseous product yield, it can be seen that the 25.32% gaseous product without catalyst reduces to 13.21% with use 5% of the catalyst. When looking at the results with ZSM-catalyst, it can be seen that the highest oil yield was 43.56% (Table 2). This means that the oil yield increases from 35, 36 to 43.56% when 20% of the catalyst was added into the pyrolysis system. In other words, the oil yield in the catalyst system increased at 23.19% when it was compared with the non-catalyst system. Therefore, it concluded that the catalyst is a significant improvement in the oil yield decarboxylation reactions occurring in the presence of catalysts. It is preferable for the oxygen to be eliminated as decarboxylation and decarboxylation reactions, rather than dehydration to obtain a suitable H/C ratio in upgraded oil (Gerçel 2013). In this study, ZSM-5catalyst was used for the reduction of oxygen content. Even though the results show that oxygen content in the biomass was 44.09% (Table 1), when the biomass was upgraded catalysts were decreased to 16.95%. As can be seen, the oils contain less amounts of oxygen content with a higher H/C ratio than the original feedstock (Table 1). Further comparison of the H/C ratio with conventional fuels indicates that the H/C ratios of the oils obtained in this study are very similar to those of light petroleum products (H/C= ). Pyrolytic oils are complex mixtures consisting of organic compounds from wide variety of chemical groups. To characterize the pyrolytic oil, the oils were separated into four fractions; asphaltenes, aliphatics, aromatics and polars. The results of the adsorption chromatography of the oil showed that the pyrolysis oil consists of % n-pentane soluble and the rest is asphaltenes. The aliphatic, aromatic, and polar fractions of the n-pentane soluble were 18.35, 62.18, and %, respectively. FT-IR spectra of the bio-oil and its sub-fractions are shown in Fig. 3.Table 3 shows the results of Fourier transform infrared (FTIR) spectra, representing functional group compositional analysis of pyrolysis oil and its subfractions. The O H stretching vibrations between 3244 and 3400 cm 1 indicate the presence of phenols and alcohols. The C H stretching vibrations with absorbance between 1650 and 1717 cm 1 indicate the presence of ketones or aldehydes. The figure shows that no peaks exist between these wave numbers for the aliphatic subfraction of the bio-oil and this indicates that aliphatic sub-fraction do not contain oxygenated compounds like bio-oils. Therefore the subfraction obtained in this study are very similar to diesel Without Catalyst 5% 10% 15% 20% Oil % Char % Water % Gas % Fig.2: Effect of catalyst on product distribution. III.2. Bio-oil characterization The main aim of the use of a catalyst is to reduce the oxygen content in the bio-oil to obtain valuable hydrocarbon products. Three main reaction mechanisms for removing oxygen from the vapors are via simultaneous dehydration, decarboxylation and 870 Fig.3: FT-IR spectra of the bio-oil and its column chromatographic sub-fractions; Bio-oil (d) n-pentane(c) Toluene(b) Methanol (a)
426 Tab. 3: Results of FTIR spectra for bio-oil and bio-oil subfractions Functional group Wave number (cm -1 ) Bio-oil Pentane Toluene Methanol O-H C-H t(ʋas) C-H (ʋ s) ʋ (C=C) ʋ (C=O) δas (CH 3. CH 2 scissor) C-H (δs) ʋas (-C O C) ʋas (C O C)/OH secondary. OH primary H NMR spectroscopy was applied to the bio-oil obtained under optimum conditions. The hydrogen distribution of 1 H NMR is given in Table 4. Generally, based on the chemical shifts of specific proton types. 1 H NMR spectra can be divided into three main regions; aromatic, olefinic and aliphatic whose resonances occur in the chemical shift regions of and ppm, respectively (Uzun 2010). The results showed that larger proportions of aliphatic structural units existed in the bio-oil from catalytic pyrolysis of pomegranate pulp. Fig. 4 shows the GC/MS spectrum of catalytic bio-oil and the aliphatic sub-fraction of pentane soluble bio-oil. The aliphatic fractions consist of n-alkanes, alkenes and branched hydrocarbons. The catalytic pyrolysis oil was very complex containing many aromatic and aliphatic compounds such as single ring and polycyclic aromatic compounds and their alkylated derivatives. Carboxylic acids and their derivatives ketones and aldehyde phenol alkylated phenols and oxyphenols, etc. (a) (b) Fig. 4.GC/MS analysis of bio-oil (a) and aliphatic subfraction of the bio-oil (b) 871 Tab.4: Results of 1 H-NMR for the bio-oil Hydrogen type Chemical shift (ppm) Bio-oil (%) CH 3 γ or further from aromatic ring and parafinic CH CH 3; CH 2 and CH β to aromatic ring CH 2 and CH attached to naphthenes CH 3; CH 2 and CH α to aromatic or aceytlenic Total aliphatics Hydroxyl. ring-joining methylene. methine or methoxy Phenols. non-conjugated olefins Aromatics. conjugated olefins Tab. 5: Relative proportions (area %) of main pyrolysis compounds in the bio-oil. Product Retentio n Time Empirical Formula Area % Phenol C6H6O 0.35 Phenol. 2-methyl C7H8O 1.32 Phenol. 4-methyl C7H8O Cyclopenten-1-one 2-hydroxy-3-methyl C6H8O Phenol. 2-methoxy C7H8O Methoxy-5-methyl C8H10O phenol Naphthalene. 2-methyl C11H Dianhydromannitol C6H10O Benzene. pentyl C11H Phenol. 4-ethenyl-2-methoxy C9H10O Benzen.1-methoxy-2-(methoxymethyyl) C9H12O Phenol. 4-ethyl-2-methoxy C9H12O Phenol. 2.6-dimethoxy C8H10O Nonanoic acid C9H18O Benzene C12H hexyl Benzene. (1.3-dimethylbutyl) C12H Phenol. 2-methoxy-4-propyl C10H14O trimethoxybenzene C9H12O Benzene. heptyl C13H tert-Butylpyrogallol C10H14O Benzene. octyl C14H Spiro[3.6]deca-5.7-dien-1-one trimethyl ; C13H18O Dimethyl-2-Vinyl-Bicyclo[3.1.1]Hept-2-Ene C13H18O Dodecanoic acid C12H24O Benzene. nonyl C15H Benzene. decyl C16H Benzene. (1-methyldecyl) ; C17H ; L-(+)-Ascorbic acid 2.6-dihexadecanoate C15H30O Heptadecane nitrile C17H33N Propanediol. 2-((acetyloxy)methyl)-2-ethyl C12H20O diacetate Androst-5-ene-3.17-diol.17-benzoate C19H (3.beta..17.beta.) Hexadecanoicacid. methyl ester C17H34O Octadec-9-enoic acid C18H34O l-(+)-ascorbic acid 2.6-dihexadecanoate ; C18H34O Pentadecylbenzene C21H Heneicosane C21H Methyl Commate B C32H52O In order to determine the distribution of these hydrocarbons in aliphatic. A semi-quantitative study was made by means of the percentage of area of the chromatographic peaks (Table 5-6). According to these results, the aliphatics and phenolics take the value of 14 and 16.6 %respectively in catalytic PP bio-oil. The most important point at investigating the similarity of bio-oil as a fuel is the aliphatic compounds, i.e. alkanes and alkenes. A resemblance was determined as a result of the comparison of the aliphatic subfractions of PP bio-oil with standard diesel in GC.In Fig. 7, the straight chain of alkanes and alkenes ranges from C12 C36 for the aliphatic
427 fraction of bio-oil. Distributions of straight chains of alkanes exhibited a maximum in the range of C12 C29. Tab.6: Relative proportions (area %) of main pyrolysis compounds in the aliphatic sub-fraction of bio-oil Product Retention Empirical Area% Time Formula Dodecane C 12H Bıcyclo[4.2.1]nona trıen C 13H butyl Tetradecane C 14H Hexadecane 31.33; C 16H Nonadecene 37.55; C 19H ; Neophytadıene C 20H Eicosene 55.70; C 20H Hexadecane tetramethyl 37.78; 46.24; C 20H Dotriacontane 51.24; C 32H ; 57.98; 60.04; Hexatriacontane C 36H of Analytical and Applied Pyrolysis (2016). Nokkosmaki M.I.,Kuoppala E.T., Leppamaki E.A., Krause A.O.I., Catalytic conversion of biomass pyrolysis vapourswith zinc oxide. Journal of Analytical and Applied Pyrolysis. 55, (2000). Ozbay N. Uzun B.B., Apaydın Varol E. Putun A.E., Comparative analysis of pyrolysis oils and its subfractions under different atmospheric conditions. Fuel Process Technolgy , (2006). Putun E., Catalytic pyrolysis of biomass:effects of pyrolysis temperature.sweeping gas flow rate and MgO catalyst. Energy , (2010). Saxena, A.K., Manan. J.K., Berry. S.K., Pomegranates: Post-Harvest Technology. Chemistry & Processing. Indian Food Packer (1987). Uzun B.B., Apaydın Varol E. Ateş F.,Ozbay N.,Putun A.E., Synthetic fuel production from tea waste: Characterisation of bio-oil and bio-char. Fuel (2010). IV. Conclusion Conversion of biomass from pomogranate pulp into liquid hydrocarbon fuels by catalytic pyrolysis under nitrogen atmosphere was demonstrated. According to the results of this study, biocrude obtained by catalytic pyrolysis over zeolite provide a highly aliphatic product including considerably olefinic and aromatic fractions. When considering the yields and characteristics of the bio-oils, it is apparent that cherry pulp is a more promising feedstock for bio-oil production and represents a promising candidate for the near future bio-fuel applications. References Adam J., Antonakou E., Lappas A., Stoecker M., Nilsen. A. Bouzga M.H., Hustad J.E., Oye G., In situ catalytic upgrading of biomass derived fast pyrolysis vapours in a fixed bed reactor using mesoporous materials. Microporous Mesoporous Materials (2006). Gerçel F., The Effects of Different Catalysts on the Pyrolysis of Thistle. Onopordum Acanthium L.,Energy Sources. Part A. 35: ( 2013). Horne P.A., Williams P.T., Upgrading of biomass-derived pyrolytic vapours over zeolite ZSM-5 catalyst: effect of catalyst dilution on product yields. Fuel. 75(9) (1996). Murata K., Kreethawate L., Larpkiattaworn S. Inaba1M., Evaluation of Ni-based catalysts for the catalytic fast pyrolysis of Japropha residues. Journal 872
428 Effect of Air Exchange Rate on the Economic Outputs of Aircraft Environmental Control Systems Ramazan Atilgan 1*, M. Ziya Sogut 2, Onder Turan 1 1 Anadolu University, Faculty of Aeronautics and Astronautics, Eskişehir-TURKEY 2 Bursa Orhangazi University, Mechanical Engineering Department, Bursa-TURKEY * [email protected] Abstract Aircraft environmental control system uses pneumatic power from several sources. Main source is the jet engine bleed air which are extracted from intermediate stages of the jet engine compressor. Bleed air (approximately at 200 C) is cooled by ambient air (approximately at -55 C) in the heat exchangers. Then, the conditioned bleed air is distributed to the passenger compartment and flight compartment to provide a comfortable environment for both passengers and flight crew. Conditioned bleed air is combined with recirculated air in the mixing manifold. The rate of the mixture changes according to aircraft type and operator s choice. Commonly, it is selected as 50 % fresh air and 50 % recirculated air. In this study, effect of air exchange rate varies from 9,7 to 22,8 in terms of economic cost is investigated. Results showed that the effect of aircraft environmental control system should be considered to reduce total operational cost of airlines. Keywords: Aircraft, Environmental control system, Air conditioning, Efficiency I. Introduction The aircraft engines have some extra duties to accomplish in addition to provide thrust, like delivering electrical, pneumatic and hydraulic power to the aircraft systems. Aircraft environmental control system (ECS) aims to maintain a comfortable environment for both passengers and flight crew. The system keeps temperature, pressure and humidity of aircraft cabin and cockpit within acceptable limits. ECS uses pneumatic power and it is the main power consumer among all other aircraft systems. The ECS uses 75 % of non-propulsive power on cruise, which is 1 % of thrust (Martinez, 2015). ECS uses bleed air (compressed air) as input power. Compressed air is delivered from pneumatic system. Generally, bleed air is extracted from two different ports located at compressor stages. One is located at low/middle pressure stages of compressor, while other one is located at high pressure stages of compressor (Elwood and Space, 2016). Bleed system provides pneumatic power (compressed air) at required suitable conditions (temperature and pressure) to many aircraft subsystems such as wing/engine anti ice protection, air driven hydraulic pumps, potable water pressurization hydraulic reservoir pressurization, cargo heat, cabin pressurization and ECS (Reddy, 2013). Bleed air rate from low and high pressure port is determined parallel to varying conditions of the flight envelope, and system selects the best rate option in regards to engine conditions (for example, bleed air from the port which is located at the high pressure compressor stages is used at low engine power settings). II. System Description Systematical description of a typical aircraft ECS system is shown in Fig. 1. In a typical aircraft ECS system, bleed air is extracted from jet engine compressor stages. Compressed air is then cooled by ambient air (approximately -55 C at cruise altitude) in the air conditioning cooling packs which include heat exchangers. There is a one cooling pack for each engine. Then, conditioned air leaves cooling packs, and enters mixing chamber. It is mixed here with filtered and recirculated air. The rate of mixture is generally selected as 50 % fresh air and 50 % recirculated air. Finally, conditioned air is continuously supplied to aircraft cabin and then exhausted from aircraft to the outside. Fig. 2 shows ECS systems with and without recirculation. System A describes a system without a recirculation system. That means all the conditioned air supplied to the cabin is fresh outside air. This sounds good, but that means engine will burn more fuel to generate same thrust value to compensate the decrease at mass air flow. A recent study shows the importance of recirculation system (Hunt et al., 2016). They claimed that eliminating recirculation system of ECS would waste more than 40 million gallons of fuel to date for only Boeing 767 fleet. System B describes a system with a recirculation system. It is the system used on modern aircrafts and as stated before, the rate is generally selected as 50 % fresh air and 50 % recirculated air. 873
429 Fig. 1: Boeing 767 Aircraft ECS System (Elwood et. al, 2016) Fig. 2: Cabin air supply without recirculation and with recirculation:(a) without recirculation, (B) with recirculation (National Research Council, 2002). 874


430 III. Analysis As stated before, ECS uses engine bleed air as pneumatic power source during flight. Using mass air flow for air conditioning and pressurization purposes, instead of generating thrust, means stealing from thrust. The mass air flow used for ECS directly effects specific fuel consumption (SFC) of the engine. In this study, seven different air exchange rate and its economic cost for a twin engine commercial jet airliner is investigated. Table 1 shows air exchange rates and mass flow rates. exchange rate value as 720 USD. Keep in mind that these fuel costs are calculated for each engine. In this analysis, a two engine aircraft is investigated, so these fuel cost values should be doubled. Thus, total energy costs of the ECS system are found as 612 USD, 656 USD, 898 USD, 986 USD, 1124 USD, 1244 USD and 1440 USD for the air exchange rates of 9.7, 10.4, 14.2, 15.6, and 22.8, respectively. Operational cost of ECS system can be determined roughly by multiplying these fuel cost values by flight hours. Tab. 1: Air exchange rates and mass flow rates (Ex. Rate) / hr v (m3/hr) m tot (kg/s) m rec (kg/s) m fresh (kg/s) 9, ,1 4,57 2,28 2,28 10, ,2 4,90 2,45 2,45 14, ,6 6,69 3,34 3,34 15, ,8 7,35 3,67 3,67 17, ,4 8,38 4,19 4,19 19, ,1 9,28 4,64 4,64 22, ,4 10,74 5,37 5,37 The air inside the cabin during a flight is exchanged in an hour 9,70 times to 22,80 times as shown in Table 1. This rate is relatively high, compared to a building s rate which is 1 to 2,5 times per hour, while a hospital s rate which is 5 times per hour. That s because to overcome extreme conditions of aircraft cabin during flight (National Research Council, 1986). For instance; outside temperature at cruise altitude of ft is C and outside pressure is approximately kpa. Fig. 3: Total energy cost of ECS Several assumptions is made in this analysis and these can be listed as follows: Air is modeled as ideal gas, Cp for air is taken as 1,005 kj/kg.k Lower heating value (LHV) of jet fuel is taken as kj/kg, Fuel price is taken as 1,1518 USD/kg, Only cruise phase is evaluated, Cruise altitude is taken as ft. IV. Results and discussions Total energy cost of an ECS can be defined as the work spent in compressing of the bleed air. Fig. 3 shows total energy cost of ECS for seven different air exchange rates. The lowest energy cost is calculated for air exchange rate of 9,7 per hour as 63,55 kw. The highest energy cost is calculated for air exchange rate of 22,8 as 149, 37 kw. Increasing air exchange rate means increasing energy cost of ECS because of the increase at mass bleed air flow used for the system. Fig. 4 shows fuel cost of used bleed air by the ECS system according to air exchange rates. These costs are calculated as 306 USD, 328 USD, 449 USD, 493 USD, 562 USD, 622 USD and 720 USD for the air exchange rates of 9.7, 10.4, 14.2, 15.6, and 22.8, respectively. More bleed air used means more energy cost and as a result more fuel cost. The highest fuel cost is calculated for the highest air 875 V. Conclusions Fig. 4: Total energy used by ECS One third of operational costs of an airline is spent on fuel. It is reported as 33 % in a recent study (ATAG, 2015). In this study, we examined effect of the ECS system to the economic outputs of a twin engine aircraft. This analysis is based on seven different air exchange rates. The difference in air exchange rate per hour is directly effects mass flow rate of bleed air which is extracted from main engine compressors. This causes a loss of aircraft thrust. Also, fan air is used for precooling of bleed air and that is also a waste for aircraft thrust force. In addition to this, ram air is used to cool bleed air in the heat exchangers which are located in air conditioning packs, and that increases drag force of the aircraft. To overcome all these losses engine power setting should be increased and that means more fuel consumption. Results showed that the effect of aircraft environmental control system should be considered to reduce total operational cost of airlines.
431 Acknowledgements Authors are gratefully acknowledged to the Anadolu University for the financial support to the study. Nomenclature ECS hr LHV m rec SFC USD : Environmental control system : Hour : Lower heating value (kj/kg) : Mass flow rate (kg/s) : Recirculation : Specific fuel consumption : United States Dollars References ATAG, Air Transportation Action Group, Facts and Figures. Available at Accessed on 14/02/16. Elwood H. H., Reid D. H., Space D.R. and Tilton F.E., Commercial Airliner Environmental Control System - Engineering Aspects of Cabin Air Quality, Boeing Document. Available at cs/&file=engineering_aspects_of_cabin_air_quality. pdf. Accessed on January Elwood H. H. and Space D.R., The Airplane Cabin Environment Issues Pertaining to Flight Attendant Comfort, Boeing Document. Available at &rep=rep1&type=pdf. Accessed on January Martinez I., Lecture notes on Aircraft Environmental Control. Available at Accessed on 20/01/16. National Research Council, The Airliner Cabin Environment: Air Quality and Safety, National Academy Press., pp , Washington DC, USA (1986). National Research Council, The Airliner Cabin Environment and the Health of Passengers and Crew, National Academy Press., pp , Washington DC, USA (2002). Reddy P.K.P., Environmental Control System of Military Aircraft, LCA, International Journal of Engineering Research and Technology, (2013). 876
432 Interactions between Polysaccharide and Anionic Surfactant and Their Effects on the Interfacial and Rheological Behaviours Nedjhioui Mohammed 1*, Moulai Mostefa Nadji 1, Tir Mohamed 1, Skender Abdelhak 2 1 Materials and Environmental Laboratory, University of Medea, Ain D Heb 26001, Algeria, 2 Sciences and Technology Faculty, University of Medea, Ain D Heb 26001, Algeria [email protected] Abstract Surfactants and polymers have very broad ranges of applications. Their combined occurrence is found in diverse formulated products such as food, drugs (pharmaceuticals), cosmetics, paints, detergents, pesticides and also in processes such as polymer synthesis, wastewater treatment and enhanced oil recovery (EOR). In this work, we examine the effect of sodium dodecylsulfate (SDS) on solutions containing oil and biopolymer (xanthan gum) by interfacial tension (IFT) and rheological measurements. The results show an important effect on surface tension, interfacial tension and rheological properties; they also indicate that the synergetic action of the surfactant SDS, alkali and biopolymer greatly influences interfacial tension. Keywords: interaction, anionic surfactant, interfacial tension, polysaccharide, viscosity. I. Introduction Interactions between surfactants and polymers are a rapidly growing field of interest. Indeed, many practical systems for industrial applications such as cosmetics, paints, detergents, food, pharmaceuticals, and pesticides contain mixtures of polymers and surfactans. The basic idea behind using polymers is to reduce aqueous phase mobility and to increase its viscosity D. Langevin, (1997) and A. Avarnas, (2003). It is known that solutions containing polymers and surfactants can give rise to molecular interactions that may affect their rheological and physicochemical properties L. M. Smitter and all (2001). These interactions also display features that depend on polymer and surfactant electrical charges and hydrophobicity, polymer conformation and flexibility and the presence of additives such as salts. It is generally accepted that the hydrophobic character of both polymer and surfactant is responsible of the interactions. The nature of these interactions has been investigated for several decades and is extensively documented R. Barreiro- Iglesias, and all (2003) and P.L Dubin and all (1992). Oil/aqueous phase interfacial tension is one of the most important parameters in chemical enhanced oil recovery (EOR), alkaline flooding is one of the most promising EOR methods, and alkali, surfactant and polymer have significant effects on some physicochemical and rheological properties (interfacial tension, viscosity, ). Alkalies have been considered among chemicals to be added to water in water flooding to remove oil from porous walls and mobilize the globules entrapped mechanically in porous media. The type and concentration of alkali and surfactant dictate the level of interfacial tension reduction and, therefore, the oil recovery efficiency by interfacial tension lowering. Mobility is also an essential parameter in alkali/polymer/surfactant EOR and is modified through polymer addition: K. Wanli, and all, (2000), M. S. Almalik,and all (1997) and J. Lakatos- Szabo and all (1999). As regards the function of alkali in flooding process, it is generally accepted that acidic species present in crude oil can migrate to the interface, where they react with aqueous phase hydroxide to form surface-active species such as petroleum soaps, which themselves are complex mixtures and contribute to decrease oil/aqueous phase interfacial tension: G-Z. Li, and all (2000), K. C. Taylor and all (1996) and G. Horvath-Szabo and all (2002). The results of interfacial tension and viscosity measurements as a function of alkali/surfactant/polymer formulation show an important effect on these two properties, including a synergetic behaviour G. Horvath-Szabo and all (2002) and E. Minatti and all, (1996). II. Experimental II.1. Materials Sodium dodecylsulfate (99%) and n-dodecane (analytical grade) were purchased from Fluka; xanthan gum was purchased from Rhodia (France). Kerosene (density: 775 kg/m 3-6 m 2 /s) and crude oil (density: 806 kg/m 3, = 22. mpa.s.) were obtained from an Algerian oil field. NaOH (reagent grade, 97%) was supplied by Panreac (Spain). These products were used because they gave conclusive results: M. L. Fishman, (1975), M. Nedjhioui and all (2005) and Touhami and all (2001). The brine was prepared according to injection and underground water quality (real case). 877
433 II.2. Methods Interfacial tensions, critical micelle concentrations and critical aggregation concentrations of mixtures were measured with a Du Noüy tensiometer, model (CSC Scientific Co.) with a platinum ring. Rheological measurements were performed with a CSL2 rheometer (TA instruments). Its characteristics are the following: temperature range, - 20 to 99.9 C and viscosity range: to Pa.s. III. Results III.2 Effect of Alkali/Surfactant /Polymer/Oil Nature on Viscosity The influence of oil nature on the viscosity and the shear rate is shown in Figure 2. This Figure shows that, at lower shear rates (< 10 s -1 ), the system shows a Newtonian behaviour, and that the viscosity drops at higher shear rates (> 10 s -1 ) (shear-thinning behaviour). In this non-newtonian region, the variation of the viscosity versus shear rate is almost linear. Increasing Besides, viscosity increases with hydrocarbon chain length. III.1. Effect of Alkali / Surfactant / Polymer/ Crude Oil on Interfacial Tension The ability to lower the interfacial tension between an aqueous solution and some other phases is one of the most significant aspects of surfactant properties. In the case of ionic surfactant, this property is modified by the presence of polymer in the solution. In EOR, the alkali/surfactant process relies on the addition of alkali to lower the interfacial tension (IFT) between crude oil and a displacing aqueous phase. The addition of polymer to the system is required to reduce the mobility of the aqueous phase, thus improving sweeping efficiency: Taylor and all (1996), Touhami and all (2001) and Goddard (2002). Addition of surfactant to the system containing crude oil can affect IFT behaviour and oil recovery in several ways. As shown in Figure 1, the effect of dodecane, kerosene and Algerian crude oil (already separated from its aqueous phase) on IFT was investigated. IFT decreases with increasing surfactant concentration at constant NaOH content and the minimum values obtained with crude oil, kerosene and dodecane are 13, 15 and 24.4 mn/m, respectively. Fig.2: Effect of the viscosity on the shear rate IV. Conclusion The effects of the combination of surfactant (sodium dodecylsulfate), polymer (xanthan gum) and alkali on the interfacial and the rheological properties of mixtures were investigated. Based on the experimental results, the following conclusions can be drawn. 1. The alkaline solution with 0.7 wt. % and polymer with 0.2 wt. % gives the most significant interfacial tension lowering. 2. With the system alkali surfactant polymer, the minimum value of the interfacial tension is obtained in presence of Algerian crude oil (IFT= 13 mn/m). 3. The system shows a Newtonian behaviour at lower shear rates and shear-thinning behaviour at higher shear rates. References Almalik M. S., Attia A. M., L. K. Jang, J. Petr. Sci. Eng. 17(1997) Fig.1: Effect of oil nature on IFT in presence of polymer and alkali The dependence of IFT on surfactant concentration in the presence of alkali may be interpreted as follows: when aqueous and oil phases are in contact, alkali in the aqueous phase and organic acids in crude oil migrate towards the interface and produce surface active species (petroleum soap). Austad T., Taugbol K., Colloids and Surfaces. A: 103 (1995) Avarnas A., Panagiotis I., J. Colloid Interface Sci. 258 (2003) Barreiro-Iglesias R., C. Alvarez-Lorenzo, A. Concheiro, Int. J. Pharm. 258 (2003)
434 Bi Z.C., Xu F., Yang P.H., Yu J.Y., Colloids and Surfaces. A: 180 (2001) Deng S., Ba R., Chen J. P., Yu G., Jiang Z., Zhou F., Colloids and Surfaces A: 211 (2002) Dubin P.L, Gruber J.H, Xia J., Zhong H., J. Colloid. Interface Sci. 148 (1992) 35. Fishman M. L., Eirich F. R., J. Phys. Chem. 79 (1975) Goddard E. D., J. Colloid Interface Sci. 256 (2002) Han D-K.,. Yang C-Z, Zhang Z-Q., Lou Z-H., J. Petr. Sci. Eng. 22 (1999) Hemar Y., Tamehana M., Munro P.A., Singh H., J. Food hydrocolloids, 15 (2001)565 Horvath-Szabo G., Czarnzecki J., Masliyah J. H., J. Colloid interface Sci. 253 (2002) Lakatos-Szabo J., Lakatos I., Colloids and Surfaces. A: 149 (1999) Langevin D., Rev. Inst.Fr. Pet. 52, 2, (1997) Li G-Z.,. Mu J-H, Li Y., Yuan S-L., Colloids and Surfaces. A: 173 (2000) Minatti E., Zanette D., Colloids and Surfaces. A: 113 (1996) Nedjhioui M., Moulai Mostefa N., Bensmaili A., Morsli A., Desalination 185 (2005), Smitter L. M., J. Guédez, A. J. Müller, J. Colloid Interface Sci. 236 (2001) Svante N., Lohne A, Veggeland K., Colloids and surfaces. A: 127 (1997) Taylor K. C., Nasr-El-Din H. A., Colloids and Surfaces. A: 108 (1996) Touhami Y., Rana D., Neale G.H., Hornof V., Colloid Polym. Sci. 279 (2001) 297. Türksoy U., Bagci S., J. Pet. Sci. Eng. 26 (2000) Wanli K., Liu Y, Baoyan Q,, Guangzhi L,, Colloid and surfaces, A: 175 (2000)
435 Numerical Study of Latent Heat Thermal Energy Storage inside a Porous Matrix Mehdi Fetiti 1*, Amel Alidrous 2 1 Umm Al-Qura university, College of Preparatory Year, Physics departement, Al-Abidia, Makkah Al Mukarramah, 24231, KSA 2 Umm Al-Qura university, Faculty of Applied Sciences, Departement of mathematics, Al-Azizia - Makkah, 24235, KSA [email protected] Abstract A latent heat thermal energy storage (LHTES) system, based on the melting of a phase change material (PCM) will be investigated in the present study. The unit of storage is a rectangular cavity containing a porous structure, of high thermal conductivity, saturated with a PCM. The inclusion of the porous matrix has the role to increase the thermal conductivity, because most of PCMs used for LHTES suffer from a low thermal conductivity.the cavity is subjected along its vertical side to a constant temperature, higher than the melting temperature, while the remaining walls are kept insulated. Initially the PCM is at its melting temperature and in thermal equilibrium with the matrix structure. The latent heat storage process starts with the melting of the PCM. The problem was solved using a theoretical model based on the volume averaging approach and a numerical method based on the control volume-finite element technique. The study includes the examination of the effects of the natural convection, the porosity of the system, the permeability of the domain and the influence of the effective thermal conductivity due to the inclusion of the high thermal conductivity matrix. The performance of the storage process will be studies through the investigation of the rate of melting, during the period of charge (melting). Results will be presented in terms of temperature field, front position, and the amount of heat energy stored vs time. Keywords: Thermal energy storage, Phase change material, Porous media, natural convection I. Introduction Thermal energy storage (TES) had attracted considerable attension in the recent years. Although sensible heat storage (SHS) is widely used; latent heat storage (LHS) during solid/liquid phase change is much more beneficial, because it provides a high storage capacity within a constant or a small range of temperature corresponding to the fusion temperature. Furthermore, LHS requires much smaller volume in comparison with storing the same amount of energy using SHS. Substances that have the ability to fulfil these conditions are called phase change materials PCMs. Hence, an important field of research has been developed to provide different types of PCMs with a variety of characteristics. A detailed review was presented by Agyenim & al. (2010) and Sharma & al. (2009). Different kinds of organic, inorganic PCMs and of their mixtures have been used in many engineering applications. Inorganic PCMs such as salts, salt hydrates, metals and alloy, have a good thermal conductivity and a high heat of fusion, but they are not suitable for solar thermal storage because of their high melting temperature and also due to their high corrosive and super cooling effects. Organic PCMs such as Paraffin waxes have been extensively used due to their large latent heat, good chemical stability and their low phase change temperature. However, the major disadvantage that they present is that of their low thermal conductivity, which severely reduces the performance of the storage process. Different techniques for the enhancement of the thermal conductivity of PCMs have been studied both numerically and experimentally. These techniques include: -The use of extended surfaces like fins Gharebagh & al. (2008), Sharifi & al. (2011) or heat pipes Shabgard et al. (2010). -The incorporation of dispersed high thermal conductivity particles within the PCM with different volume proportions Jgdheeswarn & al. (2010). The size of these particles varies from Nano-scale Min (2013), Seulgi (2014) to microscopic scale Eman-Bellah & al. (2007) and also to the macroscopic scale with the including metal promoters, such thin strips and copper chips. -The incorporation of a high thermal conductivity porous matrix with the PCM. Mesalhy & al. (2005) studied numerically the melting between, two concentric cylinders of a PCM insid a porous matrix of a high thermal conductivity. Recently Zhuo Zhi (2014) investigated the melting of Sodium Nitrate NaNO3 inside a metal skeleton of Copper where they numerically analysed the effects of heat conduction through metal structure, natural convection of liquid PCM, and the detailed parameters such as porosity and pore density of the metal matrix, on the TES systems in both melting and solidification processes. In a recent work Sayed & al. (2015) have used a Nano-PCM to analyse the enhancement of thermal conductivity during the melting inside a porous structure. Most of previous works show that the enhancement of the porous thermal conductivity contributes to the increase of the storage performance of LHTES systems. But there is a lake 880
 that is saturated with a PCM.")
436 of results about the effects of the structural properties, mainly the porosity and the permeability, of the added porous matrix on the storage operation. The objective of this study is to emphasize on these effects. II. Problem formulation Consider a two-dimensional rectangular porous matrix of size L H (Fig.1) that is saturated with a PCM. Initially the solid matrix and the PCM are supposed to be in thermal equilibrium at the melting temperature of the PCM. At the time t=0, a constant and uniform temperature is applied to the left vertical wall of the cavity, while the remaining walls are kept insulated. The development of the mathematical model is based on the volume averaging approach, Lei (2003), coupled with the enthalpy method for the treatment of the phase change part. The mathemaltical model is based on the following approximations: -Physical properties are constant in both liquid and solid phases, except for the density which is supposed to obey the Boussinesq assumption. - The fluid is newtonian in the liquid region. - The porous matrix is homogenous and isotropic and the Darcy-Brinkman model is retained for the treatment of the flow dynamics part. Fig. 1: Physical domain Based on the above assumptions and the following dimensionless variables: X = x, Y = y, F H H o = αt U = uh,v = vh ph, P = and H 2 α α α 2 ρ θ = T T m, the governing equations are: T H T C Mass conservation: U V 0 (1) X Y x-momentum conservation: U 1 U U P 1 Pr U U (U V ) ( ) F X Y X X Y o 1 1 Pr U (2) Da y-momentum conservation: V 1 V V P 1 Pr V V (U V ) ( ) F X Y Y X Y o Pr V RaPrθ (3) Da -Energy conservation: 2 2 θ θ θ θ θ 1 fl 2 U V ( ) 2 2 F X Y X Y Ste F o 1 o (4) Where 1 (1 )( ) (1 ) and pm pcm C C 2 (1 ) p pm p ε is the porosity of the solid matrix, χ the ratio thermal conductivity of the solid matrix over the thermal conductivity of the PCM. In the dimensionless form equations (1)-(4) are controlled by some parameters, such as the Rayleigh number Ra, the Prandtl number Pr, the Stefan number Ste, and the Darcy number Da. These parameters are defined in the nomenclature. III. Numerical method and code validation A control-volume based finite element method CVFEM has been used to numerically solve this problem. This method was historically introduced by Baliga Patankar (1980) for handling convection-diffusion problems. A total implicit schema was used for the time discretization and the SIMPLER algorithm has been adopted for the pressure-velocity decoupling. The resulting algebraic system was solved by the TDMA line by line solver. The numerical method was first tested for a case of natural convection in a square enclosure filled with a porous medium saturated with air, without considering the phase change problem. The configuration of the test is a two dimensional square enclosure, submitted to a horizontal temperature gradient while the bottom and the top walls are insulated. Results are presented in terms of average Nusselt number and compared with the works of Bennacer & al., and Lauriat & al. As shown in table 1, a good agreement was obtained. Tab. 1: Average Nusselt number, natural convection in porous medium (A=1, Pr=0.71) Darcy- Brinkman model. Da Ra Da Present work Lauriat Bennacer Present work Lauriat Bennacer pcm 881
437 In second stage, to validate the capability of the numerical method to solve phase change problems, melting of pure material (tin) inside a square cavity has been considered. The cavity was initially filled with a solid at a uniform temperature, equal to the melting temperature. At t=0 the left side wall is warmed to a constant temperature, higher than the melting point, while the horizontal walls are kept insulated. Comparison with numerical benchmark solutions, Bertran & al. (1998), was made for the selected case, corresponding to the dimensionless parameters: Ra = , Pr = 0.02 and Ste = Results are illustrated in Figure 2, where a comparison of the interface locations at three instants shows a reasonable agreement. After a grid sensitivity analysis a mesh of 81x81 nodes was retained for the next simulation τ = F o Ste which is a characteristic parameter of time for solid-liquid phase change problems. IV.1 Effect of the Porous Properties To examine the effect of the inclusion of a porous structure on the energy storage, a comparison has been made between the storage process using a pure PCM and in a porous medium saturated with a PCM Fig. 2 Interface location at different times (Benchmark test) IV. Results and Discussion present work Benchmark The problem of melting inside a rectangular cavity heated by the vertical side and cooled by the opposite one has been extensively studied. In the present study we consider the case where the opposite side is adiabatic and in addition melting occurs inside a porous media. The cavity is considered as unit of a latent heat storage. The problem is governed by a multiple set of dimensionless parameters such as: the Rayleigh and the Prandlt numbers playing a role in the study of interaction between natural convection and liquid-solid phase change. The porosity and the Darcy numbers, reflecting the impact of the porous matrix on the fluid flow. The ratio of thermal conductivities between the porous matrix and the PCM (χ = λ pm λ pcm ). To ensure that the condition of thermal equilibrium between the solid matrix and the PCM is kept valid, so that the model of one equation can be used, a medium values of χ have been considred (1 χ 50). In addition the dimensionless time was taken as the product of the Fourier and the Stefan numbers, (a) Pure PCM (b) PCM with solid matrix Da = 10 1 andχ =
438 (c) PCM with solid matrix Da = 10 3 and χ = 10 Fig. 3 Interface location, isotherms and velocity filed at the dimensionless time τ = 0.012, All simulations were performed for Ra = 10 6, Pr = 10 and ste = 0.1. Figure 3 reports the isotherms, the front position and the velocity field in the liquid zone for three different cases named (a), (b) and (c) respectively for a pure PCM, a PCM embedded with a porous structure of high porosity ( ε = 0.9), high permeability (Da = 10 1 ) and of ratio χ = 10, and for a porous matrix of low permeability (Da = 10 3 ). It s clearly shown that at late stages, the melting process is dominated by natural convection. The velocity field shows an upward flow of the warm liquid along the hot wall. When the warm melt reaches the top of the cavity, it exchanges heat with the cold solid interface. Latent Heat/Sensible Heat Permeability Effect Da=1e-4 Da=1e-3 Da=1e-2 Da=1e Dimensionless time Fig. 4 Effect of the permeability ofn the storage process At the melting temperature the energy exchanged is equal to the latent heat of fusion, the solid is turned to liquid and the latent heat of fusion is stored in the liquid phase. The latent heat energy exchanged between the liquid and the solid phases causes the liquid next to the interface to be cooled, its density is increased, and this is why it falls down. Heat transfer is then decreased along the solid front and the interface becomes more in advance at the top of the cavity rather than at the bottom. The locations of the interface at the dimensionless time τ = for the previous three cases show that with the inclusion of a solid matrix of χ = 10, the interface is more in advance (Fig 3.b) compared to the case of pure PCM (Fig. 3.a). The interface reaches the left wall for the case (b) while it seems to need more time to attain the same stage for the case (a). This is explaned by the enhancement of the effective thermal conductivity which contributes to the the improvement of the heat transfer and speeds up the melting process. As a consequence, the rate of heat storage is increased. The case (c) corresponds to the inclusion of a solid matrix of the same ratio of thermal conductivities(χ = 10)and the same porosity ( ε = 0.9), but of a lower permeability (Da = 10 3 ). Figure 3.c shows that in this case the interface is more regressed because the flow is damped due to the inclusion of a porous structure of low permeability. Heat transfer by convection is, then, reduced and the liquid-solid interface progresses slowly. Therefore, the rate of melting and of thermal storage are decreased. Figure 4 illustrates more clearly the effect the permeability on the storage process. For a porosity ε = 0.9 and a ratio of thermal conductivity χ = 20, the time evolution of the ratio of energy stored by latent heat to sensible heat, shows a decrease of the storage energy for a low permeability (low Darcy number). A large gap is observed from Da = 10 4 to Da = This gap becomes insignificant for a relatively high permeability as shown in figure 4 where the curves are close to each other for Da = 10 2 and Da = Another property which has an effect of the storage process is the porosity. A small porosity means that the fraction of the included porous structure is large. The effective thermal conductivity is better enhanced for a low porosity; then the rate of thermal storage should be enhanced. Nevertheless, for a small porosity the volume fraction of the PCM used for the thermal storage is reduced. As a result, the amount of stored heat energy at the end of the melting process should be decreased. Figure 5 illustrates the effect of the porosity on the rate and the capacity of storage for χ = 10 and Da = For a porosity ε = 0.5 the capacity of storage is reduced by about 35%. The capacity of storage is maximum for the porosity ε = 0.9. It s reduced by 10% and 20% respectively for ε = 0.8 and ε = 0.7 but at an intermediate stage of the melting process, the rate of storage is more important for these values of the porosity 883
439 Latent Heat/Sensible Heat Porosity Dimensionless time Fig. 5 Effect of the porosity ofn the storage process IV.2 Effect of the Ratio of Thermal Conductivities The effect of the thermal conductivities ratio was analysed for the parameters Ra = 10 6, Pr = 10, ste = 0.1 Da = 10 4 and a porosity fixed to ε = 0.9. Results in figure 6 illustrate the effect of χ on the phase change process. The location and the shape of the interface reveal that the melting progress becomes faster with the inclusion of a porous matrix of thermal conductivity higher than the PCM. In figure 7, the liquid volume fraction of the melted PCM is plotted with time. The liquid fraction can be considered as an indicator of the speed of melting and then of the heat storage capacity. The amount of stored heat in a latent form is proportional to the liquid fraction. It s clearly shown in figure 7 that the melting fraction becomes higher when χ increases. Calculations show that, for example, for small values of χ (5~10) the liquid fraction at the dimensionless time τ = is improved only by a percentage between12% and 30%, but it becomes more significant as χ is increased. As shown in table 2 the storage capacity may be enhanced by 140% forχ = 50. Liquid volume fraction Dimensionless time Fig. 7 Time evolution of the melting fraction for different values of χ Tab. 2: Percentage of the melting fraction at τ = for different values of χ χ Liquide fraction Enhancemet % % % % % V. Conclusions During the present study it has been shown that the enhancement of the themal conductivity of the PCM, is beneficial to the performance of a latent heat storage system. The improvement of the thermal conductivity was realized with the inclusion of a porous structure of thermal conductivity higher than the thermal conductivity of the storage material. Results are in accordance with the literature and show that the rate of PCM energy storage increases. It was, also, found that the rate of melting can be increased by decreasing the porosity. Nevertheless, for a porosity less than 0.7 the flow can be damped because the permeability is decreased and the enhancement of the melting rate is not significant. If the porosity is decreased to ε = 0.5 the capacity of storage is significantly decreased. It can be then concluded that the best way to improve performance of the storage process is to include a porous matrix of high thermal conductivity, high porosity (ε 0.9 ) and high permeability. Fig. 6 Time evolution of the liquid/solid interface for different values of χ at the dimensionless time τ = Acknowledgement: Authors are gratefull to the King Abdulazizi City for Science and Technology KACST for supporting this reaserch project Nomenclature C p : Specific heat (J. kg 1 K 1 )
440 Da : Darcy number Da = K L 2 F o : Fourier Number F o = αt L 2 f l : Volume liquid fraction K : Permeability (m 2 ) L, H : Length and Height of the vavity (m) L H : Latent heat of fusion (J. kg 1 ) Pr : Prandtl number Pr = ν α p : Pressure (N. m 2 ) Ra : Rayleigh Number Ra = gβl3 T αν Ste : Stefan number Ste = C pδt T : Temperature ( C) t : Time (s) u, v : Velocity components (m. s 1 ) x, y : Spatial coordinates (m) Greek letters α : Thermal diffusivity (m 2 s 1 ) β : Thermal expansion coefficient (K 1 ) ε : Prosoity θ : Dimensionless Temperature λ : Thermal conductivity (W m. K) ν : Kinematic viscosity m 2 s 1 ρ : Density (kg m 3 ) τ : Dimensionless time χ : Ratio of thermal conductivities Subscripts l m pm pcm References : Liquid : Melting : Porous matrix : Phase change material Agyenim F., Hewitt N., Eames Ph.and. Smyth M, A review of materials, heat transfer and phase change problem storage systems (LHTESS), Renewable and Sustainable Energy reviews, 14, (2010) Sharma A., Tyagi V.V, Chen C.V and Budhhi D., Review on thermal energy storage with phase change material and applications, Renewable and Sustainable Energy reviews, 13, (2009) Baliga B.R., Patankar S.V., A new finite-element formulation for convection-diffusion problems, Numerical Heat Transfer, 3, (1980). Bennacer R., Tobbal A. et Béji H., Convection naturelle thermosolutale dans une cavité poreuse anisotrope : formulation de Darcy-Brinkman, Rev. Engrg. Ren. Vol. 5(2002)1-21 Bertrand O., Binet B., Cambeau H., Couturier S., Delannoy Y. Gobin D, Lacroix M, Le Quéré P., Médale M, Mencinger J., Sadat H., Vieira G., Melting driven by natural convection, a comparison: first results, Int. J. Therm. Sci., 38, 5-26 (1999) L H 885 Eman-Bellah S. M, Ghazy M.R. Assassa, Thermal conductivity enhancement in a latent heat storage system, Solar Energy 81, (2007) Jgadheeswarn S., Pohekar S.D, energy and exergy analysis of particle dispersed latent heat storage system Int. J of Energy 1(3) (2010). Lauriat G.et Prasad V., Natural convection in a vertical porous cavity: a numerical study for brinkman-extended Darcy formulation. J. Heat Transfer, 109, , 1987 Lei Wan, Numerical investigation of directional solidification processes using a volume averaging technique. Thesis, Cornell University January Mesalhy O., Lafdi K., Elgafy A., Bowman K., Numerical study of enhancing the thermal conductivity of a phase change material (PCM) storage using high thermal conductivity porous matrix, Energy Conversion and Management 46, (2005) Min Li, A nano-graphite/paraffine phase change material with high thermal conductivity, Applied Energy 106, (2013) Gharebaghi M, Sezai I., Enhancement of heat transfer in latent heat storage modules with internal fins, Numer Heat Transfer Part A-Appl. 53(7) (2008) Shabgard H., Bergman L.T Sharifi N., Fagari A., High temperature latent heat thermal energy storage using Heat pipes. Int. J. Heat and Mass Transfer 53(15-16) (2010) Sharifi N., Bergman T.L, Fagari A., Enhancement of PCM melting in enclosures with horizontally-finned internal surface Int. J. Heat and Mass Transfer 54, (2011) Seulgi Y., Su-Gwang J., Okyoung Ch., Sumin K. Bio-based PCM/carbon nanomaterial composites with enhanced thermal conductivity. Solar energy materials and solar cells, 120, (2014) Syeda H T., Rakib H., Shohel M., Animesh D., Convection effect on the melting process of nano-pcm inside porous enclosure. International Journal of Heat and Mass Transfer 85, (2015) Zhuo Li, Zhi-Gen W. Numerical study on the thermal behavior of phase change materials (PCMs) embedded in porous metal matrix. Solar Energy 99, (2014).
441 12 CD4 effective Hamiltonian in order 6 for the Pentad (2ν4, ν2+ν4, ν1, 2ν2, ν3). A simultaneous Line Position analysis of GS-GS, Dyad (ν2, ν4)-dyad, Dyad-GS and Pentad- GS Ouardi Okkacha 1*, Kaarour Abdelkrim 1 1 Laboratoire d études physico-chimiques, Université Dr. Moulay Tahar, BP138, EN-NASR , Saida, Algeria * [email protected] Abstract We report the global analysis of 12 CD4 line positions from high-resolution rovibrational spectra, including accurate lines in the region cm -1. In addition to the lines of P0-P0 and P1-P1, this region covers two cold polyads: the Dyad (ν2,ν4) or P1 ( cm -1, 2 vibrational levels, 2 sublevels) and the Pentad (2ν4, ν2+ν4,ν1,2ν2,ν3) or P2 ( cm -1, 5 vibrational levels, 9 sublevels). In this analysis, 2724 data points from four sources are fitted using an effective Hamiltonian expanded up to the sixth order for the Pentad. For the assignments and analysis, we use the SPVIEW and XTDS software programs that implement the tensorial formalism developed in the Dijon group for tetrahedral molecules. Experimental transitions are assigned up to J 24 for P0-P0, and up to J 20 for P1-P1, P1-P0 and P2-P0. Among the 454 parameters of the effective Hamiltonian for the Pentad (of which 10 are relative to the Ground State (GS or P0) and 72 are relative to the Dyad), 233 were fitted (10 of which are GS and 37 of which are Dyad). The 47 parameters for the Dyad and the 233 parameters for the Pentad allow very good simulations to be made. For this study, a total of 2724 line positions were used in the least squares adjustment characterized by the following global root mean square deviations drms for line positions: 0,01 x 10⁻⁴ cm -1 for P0-P0, 0,4 x 10⁻⁴ cm -1 for P1-P1, 1,3 x 10⁻⁴ cm -1 for the Dyad and 0,7 x 10⁻⁴ cm -1 for the Pentad. This paper presents a reanalysis of 12 CD4 infrared absorption data in order to perform a global fit of line positions for two polyads of this molecule. Keywords: 12 CD4, high-resolution infrared spectra, tetrahedral tensorial formalism, vibrational states, rovibrational line position analysis, XTDS, SPVIEW I. Introduction Valentin et al. (1983) have recorded and analyzed the wave numbers of rovibrational transitions between the Ground State (GS or P0) and the Dyad (ν2,ν4) or P1 of the molecule 12 CD4. Poussigue et al. (1085) have recorded and analyzed the wave numbers of rovibrational transitions between the GS and the Pentad (2ν4, ν2+ν4, ν1, 2ν2,ν3) or P2. Recently, 2308 data points (19 for P0-P0, 893 for P1-P0 and 1396 for P2-P0) from three sources are fitted by Ouardi et al. (2014) using an effective Hamiltonian expanded up to the fourth order for the Pentad, and the ν3 band of 12 CD4( Line Position Analysis and Unambiguous Fit of q 2 J 4 Terms) was studied by Ouardi et al. (2015). In this study, we suggest combining the experimental data of Dyad-GS with those of Pentad-GS, and including some of P0-P0 and P1-P1(see the Experimental Data section) and to reanalyze simultaneously this set of experimental data. Additionally, we report the global analysis of 12 CD4 line positions from high-resolution rovibrational spectra, including accurate lines in the region cm -1. This region covers two cold polyads: the Dyad or P1 ( cm -1, 2 vibrational levels (ν2, ν4), 2 sublevels) and the Pentad or P2 ( cm -1, 5 vibrational levels (2ν4, ν2+ν4, ν1, 2ν2 and ν3), 9 sublevels). So, in this analysis, 2724 data points (31 for P0-P0, 12 for P1-P1, 1126 for P1-P0 and 1555 for P2-P0) from four sources are fitted using an effective Hamiltonian expanded up to the sixth order for the Pentad. For the assignments and analysis, we use the SPVIEW and XTDS software programs that implement the tensorial formalism developed in the Dijon group for tetrahedral molecules. Experimental transitions are assigned up to J 24 for P0-P0, and up to J 20 for P1-P1, P1-P0 and P2-P0. Among the 454 parameters of the effective Hamiltonian for the Pentad (of which 10 are relative to the Ground State (GS or P0) and 72 are relative to the Dyad), 233 were fitted (10 of which are GS and 37 of which are Dyad). The 47 parameters for the Dyad and the 233 parameters for the Pentad allow very good simulations to be made. II. Experimental Data We created an experimental file containing the wave numbers and the intensities of the experimental lines recorded by Valentin et al. (1983). We then used SPVIEW to operate on the file such that the appropriate experimental lines were chosen. These experimental lines were compared with the 886
442 calculated lines, which allowed us to attribute 1126 lines relative to the Dyad (ν2, ν4) of the 12 CD4 molecule. Poussigue et al. (1085) have recorded and analyzed the rovibrational frequencies of the Pentad lines. In their analysis, Poussigue et al. (1085) fixed the GS and (ν2, ν4) parameters and were able to determine the parameters relative to the Pentad 2ν4, ν2 + ν4, ν1, 2ν2, ν3. For our purposes, we created an experimental file containing the wave numbers and the intensities of the experimental lines of the Pentad. Using a similar approach as that used for the Dyad, SPVIEW was then used to choose the appropriate experimental lines, which were then compared with our calculated lines. From this analysis, we were able to attribute 1555 lines relative to the Pentad 2ν4, ν2+ν4, ν1, 2ν2, ν3 of the 12 CD4 molecule. Thus, from both works of Valentin et al. (1983) and Poussigue et al. (1085), we have two sources of data (source (a) and source (b)): Source (a): 1126 data points for the P1-P0 transition. The source of these data is the laboratoire de Spectronomie Moléculaire Université Pierre et Marie Curie, Paris, France Valentin et al. (1983) Source (b): 1555 data points for the P2-P0 transition. The source of these data is the laboratoire d'infrarouge, Université de Paris Sud, Orsay, France Poussigue et al. (1085). The distribution of the 2681 data points by polyads (P1-P0 or P2-P0) and by vibrational levels (ν2, ν4 for the Dyad, and 2ν4, ν2+ν4, ν1, 2ν2, ν3 for the Pentad ) is indicated in Table 1. Tab. 1: Distribution of the number of data by vibrational level data of (P 2-P 0) 1126 data of (P 1-P 0) 122 data of v data of 2 v data of v data of v 2 + v data of v data of 2 v 4 In addition to the data sets for the Dyad and Pentad of 12 CD4, we included in the present analysis 31 experimental data points due to Robiette et al. (1977), Kreiner and Robiette (1979)(1981)and Oldani et al. (1985) for GS-GS transitions (Source (c)), and 12 experimental data points due to Kreiner and Robiette (1981) for P1-P1 transitions (Source (d)). III. Theory: Tensorial Model for The Hamiltonian As with all XY4 tetrahedral molecules, 12 CD4 possesses the stretching modes ν1 (A1) and ν3 (F2) and the bending modes ν2 (E) and ν4 (F2). The mode ν1 (A1) is a non-degenerate oscillator, while the mode ν2 (E) is doubly degenerate and both ν3 (F2) and ν4 (F2) modes are triply degenerate. The fundamental frequencies exhibit a simple approximate relation: 887 ν1 (A1) ν3 (F2) 2 ν2 (E) 2 4 (F2) (1) This relation leads to a well-defined polyad structure, with each polyad P n defined by the integer n as: n = 2(v 1 + v 3) + v 2 +v 4 (2) where the vi = 0, 1, 2 (i = 1 to 4) are the vibrational quantum numbers. P0 is the Ground State (GS) or Monad. Each set of vibrational quantum numbers (i.e., v1, v2, v3, v4) defines a vibrational level. Due to the degeneracy of three of the normal vibrations, each vibrational level contains a certain number of vibrational sublevels, whose symmetries can be determined by means of group theoretical methods Herzberg (1945). The theoretical model used in this paper is based on the tetrahedral tensorial formalism and the vibrational extrapolation methods developed in Dijon, France. Details concerning notations and operator constructions is described by Champion (1977), and by Loëte (1983). Let us consider an XY4 molecule for which the vibrational levels are grouped in a series of polyads P k (k =0, n) as defined above. The effective Hamiltonian operator can be constructed in the following form: ~ H ~ H ~ H 1 ~... H P0 P P K (3) H ~ where each term, P K, contains rovibrational operators that have vanishing matrix elements within the PK K basis sets, and each term is expanded in the form: ~ H K, P t ss K ~ allindexes n v v T K, s s n v v (4) ~ K, n vv In this equation, the t ss are the effective Hamiltonian parameters to be determined by fitting K, nv v experimental line positions and the T ss are the rovibrational operators. The order of each individual term in (4) is defined as: O 2 (5) H Where operators. v is the degree in the a or a The present work is dedicated to the simultaneous analysis of cold bands involving the polyads P 0 to P 2 of 12 CD4. For this purpose, we will use the following effective Hamiltonian:
443 H ~ P entad P2 P2 P2 H ~ H ~ P0 P P P entad GS H ~ 1 H ~ ~ H P entad Dyad 2 H ~ P entad P entad (6) The coupled vibrational basis containing the functions relevant for the 4 normal modes of vibration is: C C 23 V l4,n4c sc V A1 l2,c2 l3,n3c3 V 4 V ν V (7) Here, l 2, l 3 and l 4 are the usual vibrational angular momentum quantum numbers for degenerate vibrations and n 3 and n 4 are multiplicity indexes. The effective Hamiltonian matrix is diagonalized numerically, and this leads to eigenfunctions obtained from: ~ H eff E (8) J, c J, c Where = 1, 2... numbers the functions of the same symmetry C in a given J block. In order to calculate transition intensities (as in the case, for example, of infrared absorption spectroscopy), the dipole moment operator is expanded by Champion et al. (1992), in a similar way as for the Hamiltonian. IV. Analysis of Line Positions H ~ H ~ and H ~ Pentad Pentad Pentad GS, Dyad Pentad were expanded up to orders 6, 6 and 6, respectively. As already mentioned, we performed a simultaneous analysis of the Dyad and the Pentad, refining the effective Hamiltonian parameters for the two polyads using two sources of data (Source a and Source b) and for GS-GS and Dyad- Dyad, using the two sources of data (Source c and Source d). The development of Pentad the effective Hamiltonian H results in 454 ~ ( K, n ) v v t parameters ss, among which 10 are relative to GS and 72 are relative to the Dyad. These parameters are determined by the analysis of the experimental line positions. We have experimental data for all the polyads under consideration, so that, in principle, all parameters can be fitted (apart from ambiguity problems). In this work we use the SPVIEW (for assignments) and XTDS (for analysis) software programs that implement the tensorial formalism developed in the Dijon group for tetrahedral molecules: - SPVIEW is a multi-platform Java application that allows graphical assignment of high-resolution molecular spectra. It is possible to load, display and manipulate experimental and simulated spectra (XY ASCII format), as well as stick spectra in various formats (including HITRAN). - XTDS is a Java front-end to the different programs implementing the tensorial formalism developed in the Dijon group. XTDS allows the simulation and analysis of any polyad system for molecules of various symmetries (Td and Oh spherical tops, C2v and C4v quasi-spherical tops and D2h). Its capabilities have been recently augmented and improved. Thus, the attributed lines from four data sources (1555 data for P2-P0, 1126 data for P1-P0, 31 for P0-P0 and 12 for P1-P1) have been analyzed with the XTDS software program. With the software included in XTDS, we analyzed 2724 experimental data points, and among the 454 ~ ( K, n ) v v t parameters of the type ss used in the development of the effective Hamiltonian 233 parameters have been determined. H Pentad A total of N = 2724 experimental line positions were used. The non-linear least squares fit minimized the standard deviation: c 2 1 (9) N i where the the e ~ i N ~ e ~ i i 1 ~ e i c ~ i are the calculated wave numbers and are the experimental uncertainties. Each experimental line position e ~ i has the weight 1 ~ e. Figure 1 shows the observed and i calculated line positions and detailed statistics for all the transitions included in the fit for P0-P0, P1-P1, P1-P0 and P2-P0 regions. Figure 2 and Figure 3 shows the calculated reduced energy levels for the Pentad and Dyad as defined by: ~ 0,0 A1 A1 A1 tgsgs c ~ c red E hc ( J ( J 1)) B J ( J 1) D J ( J 1) 2 (10) (This simply corresponds to the subtraction of the average rotational energy, which allows a clearer representation)., 888
 for the Pentad.The colors, which indicate the mixings of the different normal vibrations, were obtained through projection on the initial basis set.")
444 Fig. 1: Observed and calculated line positions and fit statistics for the different transitions of P0-P0, P1-P1, P1-P0 and P2-P0 regions. Fig.2: Calculated reduced energy levels (see text) for the Pentad.The colors, which indicate the mixings of the different normal vibrations, were obtained through projection on the initial basis set. Table 2 indicates the number of parameters (i.e., the total number and the fitted parameters) for each order and each part of the effective Hamiltonian. In this case, we used a pragmatic approach; that is to say, the non-fitted parameters are those that could not be determined. We did not attempt to algebraically determine the contact transformation that performs the reduction because this would be an enormously complex task. Fig.3: Calculated reduced energy levels (see text) for the Dyad.The colors, which indicate the mixings of the different normal vibrations, were obtained through projection on the initial basis set In the analysis of the 2724 data points, 233 parameters were determined with very good uncertainties (see Table 3). Note that in addition to the parameters of purely vibrational order 0 (of which there are 5, among which 2 are relative to the Dyad and 2 are relative to the Pentad and 1 is relative to the GS), the parameters of order 1 (of which there are 7, among which 2 are relative to the Dyad and 5 are relative to the Pentad) were also determined. 889

445 In Table 4, the distribution of the number of parameters of the three cold polyads (i.e., GS, Dyad and Pentad) and the different orders of the Hamiltonian development are reported. Note that the numbers in parentheses indicate the number of fitted parameters. Non-fitted parameters are fixed to zero. The number given before every parenthesis is the total number of the parameters of the Hamiltonian development in the indicated order. Tab. 2: The number of parameters in the effective Hamiltonian for the different orders.the numbers in parentheses indicate the number of fitted parameters in each case; non-fitted parameters are fixed to zero. Order H ~ Pentad GS 1 (1) 0 (0) 2 (2) 0 (0) Pentad H ~ Pentad Dyad H ~ Pentad 2 (2) 2 (2) 6 (6) 6 (5) 2 (2) 5 (5) 21 (15) 35 (21) H ~ Pentad 5 (5) 7 (7) 29 (23) 41 (26) (3) 0 (0) 4 (4) 13(9) 11(5) 22(8) 71 (38) 94 (40) 154(65) 87 (50) 105(45) 180(77) Total 10(10) 62(37) 382(186) 454(233) With these parameters, which are determined with a standard deviation of 0.103, we have performed a calculation of the complete spectrum of 12 CD4 to J 20 of the Dyad (using only 47 of the first 72 parameters of the Hamiltonian) and Pentad (using 233 of the 454 parameters of the Pentad Hamiltonian). XTDS and SPVIEW, which can simulate spectra, allowed us to verify and compare the calculated spectrum to the experimental spectrum for the Dyad and Pentad regions of 12 CD4. Figs. 4 and 5 illustrate comparisons between these calculated and experimental spectra, respectively. Fig. 4: Selected comparisons between the simulation and experimental spectra of the Dyad region of 12 CD4. 890
446 Fig. 5: Selected comparisons between the simulation and experimental spectra of the Pentad region of 12 CD4. V. Conclusions We have presented a detailed reinvestigation of the available high-resolution spectroscopic data for the 12 CD4 molecule in the cm -1 region. A global analysis of this entire region for line position fits for the two cold polyads under consideration was performed: the Dyad or P1 ( cm -1, 2 vibrational levels, 2 sublevels) and the Pentad or P2 ( cm -1, 5 vibrational levels, 9 sublevels). In this analysis, 2724 data points from four sources are fitted using an effective Hamiltonian expanded up to the sixth order for the Pentad. For assignments and analysis, we use the SPVIEW and XTDS software programs that implement the tensorial formalism developed in the Dijon group for tetrahedral molecules. Experimental transitions are assigned up to J 24 for P0-P0, and up to J 20 for P1-P1, P1-P0 and P2-P0. Among the 454 parameters of the effective Hamiltonian expanded up to the sixth order for the Pentad (of which 10 are relative to the Ground State (GS or P0) and 72 are relative to the Dyad), 233 were fitted (10 of which are GS and 37 of which are Dyad). The 47 parameters for the Dyad and the 233 parameters for the Pentad allow very good simulations to be made. For this study, a total of 2724 line positions were used in the least squares adjustment characterized by the following global root mean square deviations drms for line positions: 0,01 x 10⁻⁴ cm -1 for P0-P0, 0,4 x 10⁻⁴ cm -1 for P1-P1, 1,3 x 10⁻⁴ cm -1 for the Dyad and 0,7 x 10⁻⁴ cm -1 for the Pentad. 891 Our prediction is that the 233 parameters of the effective Hamiltonian expanded up to the sixth order for the Pentad will permit more assignments to be made to higher J values, and these can then be included in further adjustments. The present results represent a very significant improvement compared to the other studies. The 233 Hamiltonian parameters determined by our study should be sufficiently reliable to allow a successful (and long-awaited) analysis of additional polyads, such as the Octad and Tetradecad. 12 CD4 is a rare isotopologue that would hardly be found in natural environments, but its study is useful because it provides constraints on the potential energy surface of methane. References Valentin A., Chazelas J., and Henry L., J. Mol. Spectrosc. 99, (1983). Poussigue G., Pascaud E., and Guelachvili G., J. Mol. Spectrosc. 111, (1985). Ouardi O., Kaarour A., and Meskine M., J. Mol. Spectrosc. 306, (2014) Ouardi O., Kaarour A., J. Mol. Spectrosc.312, (2015) Robiette G., Broersen S., Gray D.L., Mol.Phys.34, (1977). Kreiner W.A., Robiette A.G., Canal.J. Chem. Phys. 57, (1979).
447 Kreiner W.A., Robiette A.G., J. Chem. Phys. 74, (1981). Oldani M. et al J. Mol. Spectrosc (1985). Herzberg G., Molecular Spectra and Molecular Structure, Volume II: Infrared and Raman Spectra, Van Nostrand, Toronto, (1945). Champion J.-P., Can. J. Phys. 55, 1802 (1977). Loëte M., Can. J. Phys (1983). Champion J.-P., Loëte M., Pierre G., in: K.N. Rao, A. Weber (Eds.), Spectroscopy of the Earth s Atmosphere and Interstellar Medium, Academic Press, San Diego, p. 339 (1992). 892
448 Study of the ν3 Fundamental Band of 12 CD4 Kaarour Abdelkrim 1*, Ouardi Okkacha Laboratoire d études physico-chimiques, Université Dr. Moulay Tahar, BP138,EN-NASR , Saida, Algeria * [email protected] Abstract We report the analysis of 12 CD4 line positions from high-resolution rovibrational spectra, including accurate lines in the region cm -1. In this analysis, 181 data points are fitted using an effective Hamiltonian expanded up to the sixth order for the ν3 fundamental band. For the assignments and analysis, we use the SPVIEW and XTDS software programs that implement the tensorial formalism developed in the Dijon group for tetrahedral molecules. Experimental transitions are assigned up to J 15 for the ν3 cold band. Among the 37 parameters of the effective Hamiltonian for the ν3 fundamental band (of which 10 are relative to the Ground State (GS or P0), and 27are relative to ν3), 22 relative to ν3 were fitted. The 32 parameters for ν3 allow very good simulations to be made. For this study, a total of 181 line positions were used in the least squares adjustment characterized by the root mean square deviation drms for line positions: x cm -1. Keywords: 12 CD4, high resolution infrared spectra, tetrahedral tensorial formalism, XTDS, SPVIEW, I. Introduction Valentin et al. (1983) have recorded and analyzed the wave numbers of rovibrational transitions between the Ground State (GS or P0) and the Dyad (ν2,ν4) or P1 of the molecule 12 CD4, and Poussigue et al. (1985) have recorded and analyzed the wave numbers of rovibrational transitions between the GS and the Pentad (2ν4, ν2+ν4, ν1, 2ν2,ν3) or P2. Recently, and in addition to 19 experimental data points due to Kreiner and Robiette (1981) for GS-GS, 2308 data points (19 for P0-P0, 893 for P1-P0 and 1396 for P2-P0) from the three sources are fitted by Ouardi et al. (2014), using an effective Hamiltonian expanded up to the fourth order for the Pentad. These experimental data were reanalyzed simultaneously, allowing a global analysis of 12 CD4 line positions in the region cm -1. This region covers two cold polyads: the Dyad (ν2, ν4) or P1 ( cm -1, 2 vibrational levels, 2 sublevels) and the Pentad (2ν4, ν2+ν4, ν1, 2ν2, ν3) or P2 ( cm -1, 5 vibrational levels, 9 sublevels). Among the 1396 data of P2-P0, 112 data of v3, where analyzed in polyad scheme. To ensure assignments for each isolated band 2ν4, ν2+ν4, ν1, 2ν2 and ν3, we proposed to study each cold band, considering the upper states as isolated states. And In this concept, the v3 isolated band, which summed intensity is high compared to other bands of the pentad will be studied in this work. In this analysis, 181 data points from the source of data determined by Poussigue et al. (1985) are fitted using an effective Hamiltonian expanded up to the sixth order for the ν3 fundamental band. For the assignments and analysis, we use the SPVIEW and XTDS software programs that implement the tensorial formalism developed in the Dijon group for tetrahedral molecules. Experimental transitions are assigned up to J 15 for the ν3 cold band. Among the 37 parameters of the effective Hamiltonian for the ν3 fundamental band (of which 10 are relative to the Ground State (GS or P0), and 27are relative to ν3), 22 relative to ν3 were fitted. The 32 parameters for ν3 allow very good simulations to be made.. II. Experimental Data Poussigue et al. (1985) have recorded and analyzed the rovibrational frequencies of the Pentad lines. (The details of the experimental conditions are given in work of Poussigue et al. (1985)). In their analysis, Poussigue et al. (1985) fixed the GS and (ν2, ν4) parameters and were able to determine the parameters relative to the Pentad 2ν4, ν2 + ν4, ν1, 2ν2, ν3. This expérimental spectra were recorded at room temperature and at sample pressures and absorption path lengths ranging from 4.8 Torr and m to 3.0 Torr and 32.2 m. This allowed a good determination of lines ranging from the very strong v3 lines (line strengths of about cm/molecule) to the very weak lines of, e.g., 2υ2 (line strengths of about 5. 1O -24 cm/molecule), forbidden in the infrared spectrum in the zeroth-order approach. For our purposes, we created an experimental file containing the wave numbers and the intensities of the experimental lines of the Pentad from Poussigue et al. (1985) study. SPVIEW was used to choose the appropriate experimental lines, which were then compared with our calculated lines of ν3. From this analysis, we were able to attribute 181 lines relative to the ν3 cold band of the 12 CD4 molecule. 893
449 Taken together, these data sets allowed us to determine the distribution of the 181 data points by the rotational quantum number J, and the broad distribution of data points suggests that very good results may be obtained from this study. III. THEORY: Tensorial model for the Hamiltonian As with all XY4 tetrahedral molecules, 12 CD4 possesses the stretching modes ν1 (A1) and ν3 (F2) and the bending modes ν2 (E) and ν4 (F2). The mode ν1 (A1) is a non-degenerate oscillator, while the mode ν2 (E) is doubly degenerate and both ν3 (F2) and ν4 (F2) modes are triply degenerate. The fundamental frequencies exhibit a simple approximate relation: ν1 (A1) ν3 (F2) 2 ν2 (E) 2 4 (F2), and this relation leads to a well-defined polyad structure, with each polyad P n defined by the integer n as: n = 2(v1 + v3) + v2 + v4 (1) where the vi = 0, 1, 2 (i = 1 to 4) are the vibrational quantum numbers. P0 is the Ground State (GS) or Monad. Each set of vibrational quantum numbers (i.e., v1, v2, v3, v4) defines a vibrational level. Due to the degeneracy of three of the normal vibrations, each vibrational level contains a certain number of vibrational sublevels, whose symmetries can be determined by means of group theoretical methods Herzberg (1945). The theoretical model used in this paper is based on the tetrahedral tensorial formalism developed in Dijon, France. Details concerning notations and operator constructions are described by Boudon et al. (2004). Let us consider an XY4 molecule for which the vibrational levels are grouped in a series of polyads P k (k =0, n) as defined above. If the study is in a polyad scheme, the effective Hamiltonian operator can be constructed in the following form: H ~ H ~ P H ~... H ~ 0 1 P P k (2) In this work, where the v3 isolated band will be studied, we use the following effective Hamiltonian: v3 v3 v3 H ~ H ~ H ~ GS v3 (3) where each term,, is expanded in the form: ~ H ~ k, nv v k, nv v H ~ ts s T ss allindexes (4) In this equation, the ~ K, n vv t are the effective s s Hamiltonian parameters to be determined by fitting experimental line positions and the K, n vv T are s s the rovibrational operators Rey et al. (2003). The order of each individual term in (4) is defined as: O H v where 2 is the degree in the a or (5) a operators. 894 The effective Hamiltonian matrix is diagonalized numerically, and this leads to eigenfunctions obtained from: ~ eff J, c J, c H E (6) Where = 1, 2... numbers the functions of the same symmetry C in a given J block. In order to calculate transition intensities (as in the case, for example, of infrared absorption spectroscopy), the dipole moment operator is expanded in a similar way as for the Hamiltonian. IV. Analysis of Line Positions ~ 3 H GS and ~ 3 3 H were expanded up to orders 6 and 6, respectively. As already mentioned, we performed an analysis of the ν3 cold band, refining the effective Hamiltonian parameters for the ν3 cold band using one source of data (Source: The source of the data is the laboratoire d'infrarouge, Université de Paris Sud, Orsay, France (Poussigue et al. (1985)). The development of the effective Hamiltonian ~ 3 H results in 37 parameters ~ ( K, n) v v t, among which s s 10 are relative to GS. These parameters are determined by the analysis of the experimental line positions. In this work we use the SPVIEW (for assignments) and XTDS (for analysis) software programs that implement the tensorial formalism developed in the Dijon group for tetrahedral molecules: - SPVIEW is a multi-platform Java application that allows graphical assignment of high-resolution molecular spectra. It is possible to load, display and manipulate experimental and simulated spectra (XY ASCII format), as well as stick spectra in various formats (including HITRAN). - XTDS is a Java front-end to the different programs implementing the tensorial formalism developed in the Dijon group. XTDS allows the simulation and analysis of any polyad system for molecules of various symmetries (Td and Oh spherical tops, C2v and C4v quasi-spherical tops and D2h). Its capabilities have been recently augmented and improved. Thus, the 181 attributed lines for ν3 have been analyzed with the XTDS software program. With the software included in XTDS, we analyzed the 181 experimental data points, and among the 37 parameters of the type ~ ( K, n) v v t used in the s s development of the effective Hamiltonian ~ 3 H, 22 parameters have been determined. A total of N = 181 experimental line positions were used. The non-linear least squares fit minimized the
450 standard deviation: 2 N ~ e ~ c 1 i i (7) N i1 ~ e i c ~ i where the are the calculated wave numbers and e the ~ i are the experimental uncertainties. Each e experimental line position ~ 1 e i has the weight ~ i. Fig. 1 shows the observed and calculated line positions and detailed statistics for the different Transitions of the ν3 Band, and Fig. 2 shows the calculated reduced energy levels for the for the ν3 cold band as defined by: ~ c ~ c 0,0A A A red t ( J ( J 1)) GS GS (8) 2 2 E B0J ( J 1) D0J ( J 1) hc In columns 3,4 and 5, we give the value of the determined parameter for Ω max= 4, Ω max= 5 and Ω max= 6 where the standard deviation is indicated in brackets. We note that, when the value and standard deviation of a parameter are indicated by 0. * in Table 3, the parameter was eliminated and its value was set equal to zero. The 10 first parameters ti (i=1 to 10) are relative to the Ground State, and in our work we fixed this parameters in the values determined by Ouardi et al. (2014). With these parameters (Ω max= 6), which are determined with a standard deviation of 1.277, we have performed a calculation of the complete spectrum of 12 CD4 to J 20 of the ν3 cold band. XTDS and SPVIEW, which can simulate spectra, allowed us to verify and compare the calculated spectrum to the experimental spectrum for the ν3 cold band regions of 12 CD4. Figs. 3 illustrate comparisons between these calculated and experimental spectra. (This simply corresponds to the subtraction of the average rotational energy, which allows a clearer representation). Fig. 1: Observed and calculated line positions and fit statistics for the different Transitions of ν3 Fig. 3. Selected comparisons between the simulation and experimental spectra of the υ3 region of 12 CD4. V. Conclusions Fig. 2: Calculated reduced energy levels (see text) for the ν3 cold band. The values of these 22 parameters are given in Table 1. In the first column we indicate the number of the parameter, and in the second column we give the rovibrational characteristics of K, n K, nf 2F 2 T T and consequently of the 3 3 parameter K, n t. 895 We have presented an analysis of 12 CD4 line positions from high-resolution rovibrational spectra, including accurate lines in the region cm -1. In this analysis, 181 data points are fitted using an effective Hamiltonian expanded up to the sixth order for the ν3 fundamental band. For the assignments and analysis, we use the SPVIEW and XTDS software programs that implement the tensorial formalism developed in the Dijon group for tetrahedral molecules.
451 Experimental transitions are assigned up to J 15 for the ν3 cold band. Among the 37 parameters of the effective Hamiltonian for the ν3 fundamental band (of which 10 are relative to the Ground State (GS or P0), and 27are relative to ν3), 22 relative to ν3 were fitted. The 32 parameters for ν3 allow very good simulations to be made. For this study, a total of 181 line positions were used in the least squares adjustment characterized by the root mean square deviation drms for line positions: x cm -1. Tab. 1: Values of Fitted Parameters for υ3 of 12 CD4, with J 15 ti= t Ω(k,nΓ) Values of ti with Ω 4 Values of ti with Ω 5 Values of ti with Ω 6 Kreiner W.A., Robiette A.G., J. Chem. Phys. 74, (1981). Loëte M., Can. J. Phys (1983). Ouardi O., Kaarour A., Meskine M., J. Mol. Spectrosc (2014) Poussigue G., Pascaud E., and Guelachvili G., J. Mol. Spectrosc. 111, (1985). Rey, M. Boudon V., Wenger C., Pierre G., Sartakov B., J.Mol.Spectrosc (2003). Valentin A., Chazelas J., and Henry L., J. Mol. Spectrosc. 99, (1983). t 2(0,0A1) t 4(0,0A1) t 4(4,0A1) t 6(0,0A1) t 6(4,0A1) t 6(6,0A1) t 8(0,0A1) t 8(4,0A1) t 8(6,0A1) 0.* 0.* 0.* t 8(8,0A1) 0.* 0.* 0.* t 0(0,0A1) (34) (21) (12) t 1(1,0F1) (14) (65) (54) t 2(0,0A1) (12) (83) (68) 10-2 t 2(2,0E ) 4.509(28) (14) (13) 10-3 t 2(2,0F2) 1.24(23) (10) (10) 10-4 t 3(1,0F1) 1.771(95) (71) (81) 10-5 t 3(3,0F1) 0.* 0.* -2.03(35) 10-5 t 4(0,0A1) 2.30(10) (78) (1.1) 10-7 t 4(2,0E ) 2.49(32) (16) (85) 10-6 t 4(2,0F2) -1.51(26) (17) (82) 10-6 t 4(4,0A1) 1.11(19) (1.0) (59) 10-7 t 4(4,0E ) -1.66(33) (30) (1.3) 10-6 t 4(4,0F2) -7.6(2.4) (23) (91) 10-6 t 5(1,0F1) 0.* -2.12(29) (2.6) 10-9 t 5(3,0F1) 0.* 2.5(2.1) * t 5(5,0F1) 0.* 5.7(2.3) (1.1) 10-8 t 5(5,1F1) 0.* 2.32(52) (23) 10-8 t 6(0,0A1) 0.* 0.* 5.06(54) 10-9 t 6(2,0E ) 0.* 0.* -1.42(22) 10-8 t 6(2,0F2) 0.* 0.* 1.38(22) 10-8 t 6(4,0A1) 0.* 0.* 2.56(74) t 6(4,0E ) 0.* 0.* 2.11(34) 10-8 t 6(4,0F2) 0.* 0.* 1.27(24) 10-8 t 6(6,0A1) 0.* 0.* 0.* t 6(6,0E ) 0.* 0.* 0.* t 6(6,0F2) 0.* 0.* 0.* t 6(6,1F2) 0.* 0.* 0.* drms / cm -1 St dev References Boudon V., Champion J.-P., Gabard T., Loëte M., Michelot F., Pierre G., Rotger M., Wenger C., Rey M., J. Mol. Spectrosc. 228, 620 (2004). Herzberg G., Molecular Spectra and Molecular Structure, Volume II: Infrared and Raman Spectra, Van Nostrand, Toronto, (1945). 896
452 Exergy Analysis of Benzene Production Cycle Masoud Taghavi 1*, Gholamreza Salehi 2, Rasoul Hajibabaei 3 1 Department of Mechanical Engineering, Nowshahr Branch, Islamic Azad University, Nowshahr, Iran 2 Department of Mechanical Engineering, Central Tehran Branch, Islamic Azad University, Tehran, Iran 3 School of Marine Science Mahmoud Abad, Petroleum University of Technology, Iran * [email protected] Abstract An Exergy analysis tool in the evaluation process of the second law of thermodynamics Barry chemical processes after the process design is used to reduce possible losses. In this study, the use of simulated benzene quick-detachable and availability analysis that has been done. For exergy analysis, physical and chemical Exergy Exergy also been used. The results show that different equipment amongst separator, heat exchanger, distillation column, pumps, compressors and expander, expansion valve, reactor and mixer have exergy losses in the order of this cycle distillation tower T-110, E-100 heat exchanger, heater H100 and heat exchanger E-101 to have the highest Exergy loss and heat exchanger E-101, T-101 and T-102 distillation tower respectively, have the lowest yield and efficiency. As to enhance exploitation and reduce the tremendous waste of energy in distillation towers and heat exchangers that is most harmful to sign an appeal to raise the efficiency of energy exploitation, is the highest value. Keywords: Exergy, Analysis, C6H6, Production Cycle. I. Introduction Exergy is a system which is defined as the maximum possible shaft job which is characterized by system combination and specified environment combination. The reference environment must be infinite and is in balance and contains all other systems as well. The reference environment by temperature, pressure and chemical composition was determined. Exergy isn t a thermodynamic properties is not simple, but is profile of both the reference system and the reference environment. ex called Exergy from the Greek word that Eragon meaning of the work. Exergy could rise if Exergy enter, (for example, work done on it). The available energy, accessible and energy consumption are words that are used in the equivalent literature or close to the concept of Exergy. Exergy is as energy including several components. In the absence of the effects of nuclear, magnetic, electrical fields and surface stretch, the following equation could be written for the total Exergy: E = E PH + E CH + E KN + E PT (1) Above formula if potential energy E PT and kinetic energy E KN ignored would be written in the below form: The physical Exergy is maximum accessible work from material which from its original state would transformed to dead state by the fully reversible process which has just heat exchange with the environment, that it s amount can be obtained from this equation: e ph = h h 0 T 0 (s s 0 ) (3) Where h 0, s 0 are flow enthalpy and entropy in environment temperature and pressure. chemical exergy is amount of accessible work of a material that substance could be produced in environment state in the way that substance reacted with constituents and final products would eventually reach the dead state and it s value of these can be obtained from the following equation: e ch = x i e i 0 + RT 0 x i LNγ i x i (4) That is i th standard Exergy in environment temperature and pressure and x i is mole percent of i component in the mixture and y i is the i th coefficient which could be obtained c p /c v in any substance. physical and chemical Exergy related to each flow and total exergy is related to cycle flow (Figure 1) is given in Table 1 (related Calculations are presented in excel file). E = E PH + E CH (2) 897

453 Fig. 1: physical and chemical Exergy related to each flow. Tab. 1: Specifications Flows. Flow Physical Chemical Exergy Exergy Main feed E+05 liquid E+05 Toluene feed E+05 Hydrogen E+04 H2r from c E+05 recovered Toluene E+04 vapor E+03 hydrogen feed E+04 HPS E+02 LPC E+02 to next section E+05 to heater E+05 to the next section E+05 reaction product E+05 Cwout E+05 Cwin E+05 cooling out E+05 heater out E+05 PFR Outlet E+05 V-101 Liquid E+05 TO distillation unit E+05 Vent T E+03 Benzene E+05 v-101 off Gas E+05 recovered H E+05 off gas E+04 Bottum T E+04 Unreactrd toluene E+04 Biphenyl E+03 II. Exergy destruction and efficiency Exergy 1.38E E E E E E E E E E E E E E E E E E E E E E E E E E E E E+03 In Exergy analysis, irreversibility which resulted to loss of work increase in system is identified and their effects are determined by the efficiency of the process. The results of the analysis will be the basis for structural optimization of process. Exergy efficiency and destruction are two indicators of the device acceptability which according to them can be the sign and exploitation of energy devices could be increased. Exergy destruction and efficiency could be attained by Exergy balance formula which is as follows:... E in + E Q = E out + W + I (5) Overall Exergy efficiency could be gained through front formula: Rational Efficiency: product fuel (6) Fine calculations related to the destruction of Exergy and it s efficiency are presented in excel file. 1. Separator (separator+tee): We don t have work and heat in sperator thus exergy formula would be written in below from:... E in + E Q = E out + I (7) E main feed = E liquid + E vapor + I I v 100 = 1.08E + 01 (8) and η v 100 = E vapor+e liquid E main feed 9.99E 01 (9) E cooling out = E v 100 liquid + E v 100 off gas + I I v 101 = 1.99E + 02 (10) 898
. Fig. 5: Destruction of Exergy, (Heat exchanger).")

 η v 101 = E v 101 liquid+e v 101 off gas E cooling out 9.")
 and η TEE 100 = E off gas+e Recovered H2 η E TEE 100 9.99E v 100 off gas 01 (13) Fig.")

 Fig. 4: Destruction of Exergy, (Separator). 2.")
454 and η heater = E heater out+e to heater E Q H100 η heater = (16) Fig. 2: Destruction of Exergy, (Separator). Fig. 5: Destruction of Exergy, (Heat exchanger). Tr in the above equation equals to T0 and Tto heater is considered as the ambient temperature. In heatexchanger, there is no heat and work, so exergy balance equation is presented as follow: Fig. 3: Destruction of Exergy, (Separator)... E in = E out + I (17) η v 101 = E v 101 liquid+e v 101 off gas E cooling out 9.99E 01 (11) and E v 101 off gas = E Recovered H2 + E off gas + I TEE 100 I TEE 100 = 2.54E + 01 (12) and η TEE 100 = E off gas+e Recovered H2 η E TEE E v 100 off gas 01 (13) Fig. 6: Destruction of Exergy, (Heat exchanger). E to next section + E Reaction Product = E to heater + E to the next section + I E 100 I E 100 = 3.55E + 03 (18) and η E 100 = E to heater E to next section E reaction product E to the next sectiom η e 100 = 7.75E 01 (19) Fig. 4: Destruction of Exergy, (Separator). 2. Heat exchanger: In heater and air cooler, Exergy balance equation is presented as follows:... E in + E Q = E out + I (14) E to heater + E Q H100 = E heater out + I E heater out (E to heater + Q (1 T 0 T r )) and I heater = 2.70E + 03 (15) Fig. 7: Destruction of Exergy, (Heat exchanger). E to the next section + E cwin = E cwout + E cooling out + I E 101 I E 101 = 1.92E + 03 (20) and 899

. E liquid = E toluene feed + w p 100 + I P 100 I P 100 = 4.46E + 00 (28) and η P 100 = E liquid E toluene feed w η P 100 = 0.")
455 η E 101 = E cwin E cwout E to the next section E cooling out It should be considered that the Qc is inserted by minus symbol and Qr is inserted by positive symbol. and η E 101 = 2.65E 03 (21) 3. Distillation column: Thermal energy in the distillation column is used for both sections means the boiler and condenser so the balance equation is simple which is presented as follows: 4. Pumps, compressors and expander: In this equipment there is only work, so Exergy balance equation could be obtained as follows:.. = E out + W + I (27) E in... E in + E Q = E out + I (22) Fig. 10: Destruction of Exergy, (Pumps, compressors and expander). E liquid = E toluene feed + w p I P 100 I P 100 = 4.46E + 00 (28) and η P 100 = E liquid E toluene feed w η P 100 = (29) Fig. 8: Destruction of Exergy, (Distillation column). E to Distillation Uit + E Q c101 + E Q t101 = E Bottum T E Vent T E Benzene + I T 101 I T 101 = (E to Distillation Uit + Q reboiler (1 T 0 T r ) + Q cond (1 T 0 T c )) ( E Bottum T E Vent T E Benzene ) I T E + 02 (23) and η T 101 = (E bottum t 101+E benzene +E vent t 101 ) (E to distillation uit ) E Q t101 +E Q c101 = (24) Fig. 11: Destruction of Exergy, (Pumps, compressors and expander). E unreacted toluene = E recovered toluene + w p I P 101 I P 101 = 3.34E + 01 (30) And η P 101 = E unreacted toluene E recovered toluene η w P 101 = 8.07E 01 (31) Fig. 12: Destruction of Exergy, (Pumps, compressors and expander). Fig. 9: Destruction of Exergy, (Distillation column). E Bottum T E Qc T102 + E Qr T 102 = E Unreacted Toluene + E Biphenyl + I T 102 I T 102 = E bottum t Q ct 102 (1 ( T 0 T c )) + Q rt 102 (1 ( T 0 T r )) (E unreacted toluene + E biphenyl ) I T 102 = 1.01E + 02 (25) E recovered H2 = E H2 from c W c I c 101 I c 101 = 3.42E + 02 (32) and η c 101 = E recovered H2 E H2 from c 101 w η c 101 = (33) and η T 102 = (E biphenyl+e unreacted toluene ) (E bottum t 101 ) E Qr +E Qc = (26) 900 Fig. 13: Destruction of Exergy, (Pumps, compressors and expander).
 and η PFR 101 = E PFR outlet E Heater out η PFR 101 = 9.99E 01 (42) Fig. 14: Destruction of Exergy, (Pumps, compressors and expander). E HPS = E LPC + w T 100 + I T 100 I T 100 = 7.")
 It should be noted that the done work at the pump and compressor with a minus sign and the work done by the expander is presented by a positive sign. 5.")
456 E hydrogen feed = E hydrogen + w c I c 100 I c = 4.69E + 01 (34) E heater out = E PFR outlet + I PFR 101 I PFR 101 = 4.22E + 02 (41) and η c 100 = E hydrogen feed E hydrogen w η c 100 = (35) and η PFR 101 = E PFR outlet E Heater out η PFR 101 = 9.99E 01 (42) Fig. 14: Destruction of Exergy, (Pumps, compressors and expander). E HPS = E LPC + w T I T 100 I T 100 = 7.99E + 01 (36) and η T 100 = w E HPS E LPC η T 100 = 7.86E 01 (37) It should be noted that the done work at the pump and compressor with a minus sign and the work done by the expander is presented by a positive sign. 5. Expansion valve: Because we don t have production in valve, productive output consider zero (It is noteworthy that we can increase efficiency by applying turbo expander and instead of pressure drop derived from facet that does nothing for us here) and due to this fact that we don t have work and heat, Exergy balance for that is as follows:.. E in = E out + I (38) Fig. 17: Destruction of Exergy, (Reactor). E PFR outlet = E reaction product + I ERV 101 I ERV 101 = 6.84E + 01 (43) and η ERV 101 = E reaction product η E ERV 101 = 9.99E 01 (44) PRF outlet 7. Mixer: There isn t any work and heat in a blender and balance equation can be obtained in the following exergy... E in = E out + I (45) Fig. 18: Destruction of Exergy, (Mixer). E recycle H2 + E hydrogen + E recycle toluene + E toluene feed = E to next section + I MIX 100 I Mix 100 = 6.42E + 02 (46) Fig. 15: Destruction of Exergy, (Pumps, compressors and expander). E v 101 liquid = E to distillation uit + I vlv 100 I vlv 100 = 2.32E + 01 (39) η Mix 100 = E to the next section E toluene feed + E Recycle Toluene + E Hydrogen + E Recycle H2 η Mix 100 = 9.99E 01 (42) 6. Reactor: In PFR (plug flow reactor) and ERV (equilibrium reactor) we don t have work and heat, so Exergy balance equation is as follows:.. E in = E out + I (40) Fig. 16: Destruction of Exergy, (Reactor). 901 Fig. 19: Exergy destruction Chart.

457 and exergy analysis, Journal of Cleaner Production, 1-43 (2016). Yusuf Bicer Y., Dincer I., Energy and exergy analyses of an integrated underground coal gasification with SOFC fuel cell system for multigeneration including hydrogen production, International Journal of Hydrogen Energy, (2015). III. Conclusions Fig. 20: Efficiency Chart. Exergy has the property that remains sustainable only if all the processes and the system are reversible. Exergy is destroyed in the process. When Availability analysis on a power plant, chemical processing factories or refrigeration plants, defects can be as destructive of Exergy thermodynamic states, which indicates that it is without compromising quality or energy (work stoppage) Just like energy, Exergy can be cross border, each corresponding type of transfer and transportation of energy are there for Exergy. In this cycle distillation tower T-110, E-100 heat exchanger, heater H100 and heat exchanger E-101 to have the highest Exergy loss and heat exchanger E-101, T-101 and T-102 distillation tower respectively, have the lowest yield and efficiency. This cycle distillation Exergy is capable of the highest losses. And distillation towers are to have the lowest efficiency. So as to enhance exploitation and reduce the tremendous waste of energy in distillation towers and heat exchangers that is most harmful to sign an appeal to raise the efficiency of energy exploitation. References Dincer I., M. Rosen, Energy and Exergy Assessments, Exergy Analysis of Heating, Refrigerating and Air Conditioning, Chapter 2, (2015). Shudo Y., Ohkubo T., Hideshima Y., Akiyama T., Exergy analysis of the demonstration plant for co-production of hydrogen and benzene from biogas, International Journal of Hydrogen Energy, (2009). Mokhatab S., Mak J., Valappil J., Wood D., Exergy and Exergy Tools, Handbook of Liquefied Natural Gas, (2004). Dimopoulos G., Stefanatos C., Kakalis P., Exergy analysis and optimisation of a marine molten carbonate fuel cell system in simple and combined cycle configuration, Energy Conversion and Management, (2016). Barrera L., Rosa E., Spanjers H., Romero O., Meester D., Dewulf J., A comparative assessment of anaerobic digestion power plants as alternative to lagoons for vinasse treatment: life cycle assessment 902

458 8 th INTERNATIONAL EXERGY, ENERGY AND ENVIRONMENT SYMPOSIUM May 1-4, 2016 Antalya, Turkey ISBN:
Why SSD failed after abnormal power-off?
 Why SSD failed after abnormal power-off? Considering the SSD must be based on FTL to realize the data transfer between logical address and physical address, if there happens abnormal power-off in case
. Condensing Water Heater Daxom. Industrial Type TS 615 EN 26
 Wall Hung Boilers Water Heaters Daxom Condensing Water Heater Industrial Type TS 615 EN 26 2195 Condensing Water Heater Daxom 33 lt (UKDAX -33BT) / 20 lt (UKDAX-20BT) Technical Features UKDAX-33BT Model
About QDenetim and QDestek (Sistem Danışmanlık)
") About QDenetim and QDestek (Sistem Danışmanlık) Sistem Danışmanlık began its operations in 2001 and continues to improve its products and services to enhance its customers' performances and productivity.
About QDenetim and QDestek (Sistem Danışmanlık) Sistem Danışmanlık began its operations in 2001 and continues to improve its products and services to enhance its customers' performances and productivity.
Analysis of Energy Evaluation on Lighting Programs
 Proceedings of the XVIII IAHS World Congress April 16-19, 2012, Istanbul, Turkey Analysis of Evaluation on Lighting Programs Res. Assist. Arzu CİLASUN Department of Architecture Yaşar University, İzmir,
THE AMERICAN SOCIETY OF MECHANICAL ENGINEERS 345 E. 47th St., New York, N.Y. 10017
 THE AMERICAN SOCIETY OF MECHANICAL ENGINEERS 345 E. 47th St. New York N.Y. 007 Lr The Society shall not be responsible for statements or opinions advanced in l^ papers or discussion at meetings of the
3 Important Pillars of a website : Sunita Network Pvt Ltd
 3 Important Pillars of a website : Sunita Network Pvt Ltd There are numerous advantages of having a website and for business entities, it is must to own a website dedicated to their organization. In such
Renice R-SATA Storage Solution for Aerospace and Defense Application
 Renice R-SATA Storage Solution for Aerospace and Defense Application The Aerospace and Defense Industries: Unique Challenges Aerospace and Defense storage applications require the highest level of reliability,often
MACHMBR. Treatme nt Units for Sewage Water.
 MACHMBR Treatme nt Units for Sewage Water www.machinno.com.tr MACHMBR Treatment Units for Sewage Water MACHMBR System is and biological treatment system that combines activated sludge process and submerged
Background of Wear Leveling Algorithm
 1 A kind of algorithm that extend life expectancy by 3 folds : Renice Non-Balance Wear Leveling Algorithm The first portion of this article introduces the background of wear leveling and some commonly
First Solar Series 4 PV Module ADVANCED THIN FILM SOLAR TECHNOLOGY
 First Solar Series 4 PV Module ADVANCED THIN FILM SOLAR TECHNOLOGY INDUSTRY BENCHMARK SOLAR MODULES As a global leader in PV energy, First Solar s advanced thin film solar modules have set the industry
MACHMEC. Mekanik Package Treatment Unit.
 MACHMEC Mekanik Package Treatment Unit www.machinno.com.tr MACHMEC Mekanik Package Treatment Unit Using low-cost,high-capacity MACHMEC Mechanical Package Treatment Units completely manufactured from stainless
Published by: PIONEER RESEARCH & DEVELOPMENT GROUP (www.prdg.org) 33
 33") Control of Dc Motor Based On Linear Quadratic Regulator Method Ishak ERTUGRUL, Osman ULKIR 2, Nihat AKKUS 3,2,3 Department of Mechatronics Engineering, Marmara University, Istanbul, 34722, Turkey Abstract
Control of Dc Motor Based On Linear Quadratic Regulator Method Ishak ERTUGRUL, Osman ULKIR 2, Nihat AKKUS 3,2,3 Department of Mechatronics Engineering, Marmara University, Istanbul, 34722, Turkey Abstract
COIL SLITTING LINES COMBINATION OF CUT TO LENGTH & SLITTING LINE CUT TO LENGTH LINES
 COIL SLITTING LINES COMBINATION OF CUT TO LENGTH & SLITTING LINE CUT TO LENGTH LINES COMPANY SACFORM Established in 2006 TEAM Engineers, technicians 35 employees SERVICE & SALES 7/24 Authorized Technical
Evaluation of Energy Performance on Lighting by Using Dialux and Bep-Tr
 Evaluation of Energy Performance on Lighting by Using Dialux and Bep-Tr Res. Assist. Arzu CILASUN, Department of Architecture, Yaşar University, İzmir, Turkey [email protected] Murat ANBARCI, Istanbul
Energy Conversion and Management
 Energy Conversion and Management 52 (2011) 615 620 Contents lists available at ScienceDirect Energy Conversion and Management journal homepage: www.elsevier.com/locate/enconman Design, construction and
SUN Filters,Kendi kendini temizleyen filtre,Otomatik geri yıkamalı filtre,Otomatik ters yıkamalı kum filtresi,
 AUTOMATIC SELF CLEANING SYSTEM VGA1 SUN Filters 25.82 SUNFILTER VGA1 Filters are motorized compact designed models which are perfectly suitable for use in a wide range of application areas with low liquid
Erasmus+ KA2 (Sample Projects)
") Erasmus plus projects are a kind of innovation tool that are used not in the school education system but also in other civil society structures.i have been working as a teacher and project writer for more
Erasmus plus projects are a kind of innovation tool that are used not in the school education system but also in other civil society structures.i have been working as a teacher and project writer for more
Renice NFA100 NandFlash Test Platform
 Test Tray Chamber Pile up the probe board and press Layer1 Layer2 Layer3 Layer4 Layer5 Layer6 Layer7 Layer8 Layer9 Layer10 Contorol BOX Renice NFA100 NandFlash Test Platform Accurate and Fast Nand flash
POWERSTRIPS WHERE DOES IT HURT? ANCIENT WISDOM MEETS NEW TECHNOLOGY
 POWERSTRIPS WHERE DOES IT HURT? Is your busy life and uncomfortable mattresses causing you to move a little slower these days? If you suffer from minor aches and pains, you're not alone. Frequent pain
EFFECTS OF FERTILIZATION DIFFERENT LEVELS OF WATER SALINITY ON TOMATO PLANT GROWN
 1997-ISHS Symposium on greenhouse management for better yield and quality in mild winters climates, Antalya, 491, 277-281 EFFECTS OF FERTILIZATION DIFFERENT LEVELS OF WATER SALINITY ON TOMATO PLANT GROWN
Is the P/E cycle of MLC really only 3,000 times as its datasheet said?
 Is the P/E cycle of MLC really only 3,000 times as its datasheet said? Firstly, let s see the conclusion that Renice draw based on the test from Nand Flash test platform NFA100. 1, the P/E cycle of some
ShenZhen Renice Technology Co., Ltd. PCIe M SSD. Datasheet V
 ShenZhen Renice Technology Co., Ltd PCIe M.2 2280 SSD Datasheet V1.0 2018-6-15 CATALOGUE 1. INTRODUCTION... 2 1.1 PRODUCT OVERVIEW... 2 1.2 FEATURE... 2 2. FUNCTIONAL BLOCK DIAGRAM... 3 3. PRODUCT SPECIFICATIONS...
Aytok Automatic Self-Cleaning Filters
 Aytok Automatic Self-Cleaning Filters Efficient filtration from 5000 down to 15 micron Aytok Automatic Self-Cleaning Filters, with their stainless steel structure, large filtration and hydraulic pressure
Improving Energy Efficiency
 BOILERS AND HEATERS Improving Energy Efficiency Natural Resources Canada Office of Energy Efficiency Ressources naturelles Canada Office de l'efficacité énergétique August 2001 Written by Paul Dockrill
Management Science Letters
 Management Science Letters 7 (2017) 241 246 Contents lists available at GrowingScience Management Science Letters homepage: www.growingscience.com/msl The perspectives of banking and health sector administrators
CHAPTER 4 NICKEL-CADMIUM BATTERIES
 CHAPTER 4 NICKEL-CADMIUM BATTERIES Nickel-cadmium alkaline batteries have gained respect as a very reliable, long life electrochemical system from their performance in (4-1) industrial starter and standby
Fire Resistant Fiber Optic Cable, Fire proof fiber optic cable, Central Loose Tube Double LSZH Jacket Indoor/outdoor Type
 A-DQ(MK)(BN)H(SR)H Central Loose Tube Double LSZH Jacket Indoor/outdoor Type Fire Resistant Fiber Optic Cable Overview - A-DQ(MK)(BN)H(SR)H Central Loose Tube Double LSZH Jacket Indoor/outdoor Type Fire
shown as follows: Fig. 2 Timing mode selection Fig. 4 Interrupt 1 Fig. 3 Interrupt 0
 Design and Implementation of a Microcontroller Based LCD Screen Digital Stop Watch Mr. Khalid I. Saad, Ms. Nusrat Afrin and Mr. Rajib Mikail Abstract The stop watch is used to measure the time required
Wall hung electric boiler DAXOM / Naviels. Electric Boiler. Comfort and Confidence Proper To Your Life
 Naviels DAXOM / Naviels Electric Boiler Comfort and Confidence Proper To Your Life Electric Boiler Daxom 10,5 ~72 kw Electric Boiler Model UKDAX-12EDT UKDAX-16EDT UKDAX-18EDT UKDAX-20EDT UKDAX-24EDT UKDAX-30EDT
INTERNATIONAL EXERGY, ENERGY AND ENVIRONMENT SYMPOSIUM
 8 th INTERNATIONAL EXERGY, ENERGY AND ENVIRONMENT SYMPOSIUM May 1-4, 2016 Antalya, Turkey Proceedings of the 8 th International Exergy, Energy and Environment Symposium ISBN: 978-605-030-218-9 http://www.ieees2016.org
INTERNATIONAL EXERGY, ENERGY AND ENVIRONMENT SYMPOSIUM
 8 th INTERNATIONAL EXERGY, ENERGY AND ENVIRONMENT SYMPOSIUM May 1-4, 2016 Antalya, Turkey Proceedings of the 8 th International Exergy, Energy and Environment Symposium ISBN: 978-605-030-218-9 http://www.ieees2016.org
The Role of Social Marketing in Creating Obesity Awareness and Its Effects on Life Quality
 Special Issue, International Conference on Military and Security Studies,ICMSS-2015 Research Article The Role of Social Marketing in Creating Obesity Awareness and Its Effects on Life Quality Mustafa Karadeniz
Fragility analysis of mid-rise R/C frame buildings
 Engineering Structures 28 (2006) 1335 1345 www.elsevier.com/locate/engstruct Fragility analysis of mid-rise R/C frame buildings Murat Serdar Kirçil,Zekeriya Polat Department of Civil Engineering, Yıldız
Electric Boiler Daxom. Confort and Confidence Proper To Your Life
 Wall Hung Boilers Daxom Electric Boiler Confort and Confidence Proper To Your Life Electric Boiler Daxom 10,5 ~48 kw Electric Boiler Tecnical Specifications Power Dimensions (kw) L*W*H (mm) Model UKDAX-12EDT
Interfacing a GPS Receiver with a Microprocessor via UART
 ECE 480 DESIGN TEAM 6 Interfacing a GPS Receiver with a Microprocessor via UART Michael Carpenter Dr. Shanker Balasubramaniam Facilitator Application Note Friday, November 13, 2009 Executive Summary For
Science and the Importance of the Scientific Approach
 European International Journal of Science and Technology Vol. 4 No. 1 January, 2015 Science and the Importance of the Scientific Approach Dr. Hasan ALPAGU 1 Abstract The objective of this article is to
The Economy of Conflicts. Hasan ALPAGU. Keywords: Conflict, Economy, Integration, Evaluation, Security, Globalization, Change
 The Economy of Conflicts Hasan ALPAGU Any behavior of individuals and the change in the society have consequences and these consequences lead to tangible effects and costs. The migration and refugees also
BC546/547/548/549/550
 Switching and Applications High oltage: BC546, CEO =65 Low Noise: BC549, BC550 Complement to BC556... BC560 NPN Epitaxial Silicon Transistor TO-92. Collector 2. Base 3. Emitter Absolute Maximum Ratings
ANALYSIS OF TURKISH PHARMACEUTICAL SECTOR. Author Mehmet ATASEVER
 ANALYSIS OF TURKISH PHARMACEUTICAL SECTOR Author Mehmet ATASEVER About the Author Having begun his education life in Erzurum province, his hometown, earned a Master s Degree in Product Management and Marketing
Marketing and Financial Aspects With Micro Credit and Turkey Sample
 Journal of Modern Accounting and Auditing, ISSN 1548-6583 September 2011, Vol. 7, No. 9, - Marketing and Financial Aspects With Micro Credit and Turkey Sample Turgut Özkan, Güzide Öncü Eroğlu Pektaş, Merve
EVALUATION OF TURKEY'S FOREIGN TRADE COMPOSITION AFTER 1980 ACCORDING TO THE COUNTRIES
 EVALUATION OF TURKEY'S FOREIGN TRADE COMPOSITION AFTER 1980 ACCORDING TO THE COUNTRIES ABSTRACT In this study, It was tried to analyse effects of growth rate of Turkey, EU and the World country economies,
Learn how to get started with Dropbox: Take your stuff anywhere. Send large files. Keep your files safe. Work on files together. Welcome to Dropbox!
 Learn how to get started with Dropbox: 1 2 3 4 Keep your files safe Take your stuff anywhere Send large files Work on files together Welcome to Dropbox! 1 Keep your files safe Dropbox lets you save photos,
Information Storage and Management Version 3 Student Guide
 Information Storage and Management Version 3 Student Guide Education Services August 2015 Welcome to Information Storage and Management Version 3. Copyright 2015 EMC Corporation. All Rights Reserved.
Tourism, Cumalıkızık, rural tourism, tourist satisfaction, sustainability, one-way ANOVA
 Uludag University, Faculty of Agriculture, Department of Agricultural Economics, Bursa, Turkey Tourism has become the largest and fastest growing industry in the world. As the tourism industry grows faster,
Electric arc furnace flue dusts: characterization and leaching with sulphuric acid
 Hydrometallurgy, 31 (1992) 213-231 213 Elsevier Science Publishers B.V., Amsterdam Electric arc furnace flue dusts: characterization and leaching with sulphuric acid M. Cruells, A. Roca and C. Nti~ez Department
Design For Commercial Kitchen
 www.scr-tr.com EKOTEK ENGINEERING Ekotek was established in 01.03.2000 year as an engineering company. It was founded by Mr.AYDIN and Mr.YILDIZ as a partnership. We provides for our customers operating
Within the largest 500 industrial companies of Turkey
 since 1988 Umur has established in 1988 Umur has 3 Main Complemantary Businesses 1.Printing 2.Paper Converting and Trading 3.Stationery Within the largest 500 industrial companies of Turkey Umur in Figures
How to read the reliability of each MLC Nand chip from Page performance?
 www.renice-tech.com How to read the reliability of each MLC Nand chip from Page performance? If all Page performance is basically the same when programming every time, this Nand Flash chip should be the
IMPACT OF SOCIAL MEDIA ON MARKETING:A VIEW ON SUCCESS STORIES Selçuk SERT & Utku KÖSE SOSYAL MEDYANIN PAZARLAMA ÜZERİNDEKİ ETKİSİ: BAŞARI HİKAYELERİNE BİR BAKIŞ
 IMPACT OF SOCIAL MEDIA ON MARKETING: A VIEW ON SUCCESS STORIES Selçuk SERT 1 Utku KÖSE 2 Abstract As it is known, social media has a great impact on daily life because of its functions and features related
A Comparison of Performance Metrics of Turkish Twitter Messages Using Text Representations
 A Comparison of Performance Metrics of Turkish Twitter Messages Using Text Representations Abdullah Ammar 1*, Tolga AYDIN 1 1 1 Ataturk University, Department of Computer Engineering, Erzurum, Turkey *
CASE OF ISTANBUL Yazar / Author:
 CASE OF ISTANBUL Yazar / Author: i ii Abstract Tax ethics is an internal behavior in terms of taxation and is expressed as paying taxes voluntarily, a positive attitude, belief and value judgments related
TABLE LIST 1. INTRODUCTION 1 2. CONCEPTUAL FRAMEWORK Foreign Language Teaching In Turkey 3
 TABLE LIST ii 1. INTRODUCTION 1 2. CONCEPTUAL FRAMEWORK 3 2.1. Foreign Language Teaching In Turkey 3 2.1.1 Historical Background To Foreign Language Teaching In Turkey 4 2.1.2. Foreign Language Teaching
Daxom Plus / Daxom Hermetic Gas Water Heater
 Wall Hung Boilers Water Heaters Daxom Plus / Daxom Hermetic Gas Water Heater Copper Heat Exchanger TS 615 EN 26 Hermetic Gas Water Heater Daxom Plus 12 lt (UKDAX-12CT) The Thinest Hermetic Gas Water Heater
Renice Embedded Memory & Storage Solutions in Railway Application
 Renice Embedded Memory & Storage Solutions in Railway Application Control Center CF card in PIS/Control server Ticketing & Passenger Information Platform Read/Write: 100MB/70 MB/S Fully compliant with
Relationship between oxidative stress and clinical pregnancy in assisted reproductive technology treatment cycles
 DOI 10.1007/s10815-013-0005-2 ASSISTED REPRODUCTION TECHNOLOGIES Relationship between oxidative stress and clinical pregnancy in assisted reproductive technology treatment cycles Yunus Aydin & Orhan Ozatik
Fashion Phenomenon in Postmodern Marketing Applications and Effects on the Marketing Components
 Available online at www.sciencedirect.com Procedia Social and Behavioral Sciences 24 (2011) 325 339 7 th International Strategic Management Conference Fashion Phenomenon in Postmodern Marketing Applications
Journal of Statistical Software
 JSS Journal of Statistical Software January 2008, Volume 23, Issue 10. http://www.jstatsoft.org/ yaimpute: An R Package for knn Imputation Nicholas L. Crookston USDA Forest Service Andrew O. Finley Michigan
About the Author. He is married with four children. He is accessible through his personal website.
 About the Author Mehmet Atasever: Having begun his education life in Erzurum province, his hometown, earned a Master s Degree in Product Management and Marketing at Ataturk University. He is studying for
EFFECT OF CALIFORNIAN RED WORM (Eisenia foetida) ON THE NUTRIENT DYNAMICS OF A MIXTURE OF SEMICOMPOSTED MATERIALS
 ON THE NUTRIENT DYNAMICS OF A MIXTURE OF SEMICOMPOSTED MATERIALS") RESEARCH 465 EFFECT OF CALIFORNIAN RED WORM (Eisenia foetida) ON THE NUTRIENT DYNAMICS OF A MIXTURE OF SEMICOMPOSTED MATERIALS Hugo Castillo 1*, Adriana Hernández 2, David Dominguez 1, and Damaris Ojeda
RESEARCH 465 EFFECT OF CALIFORNIAN RED WORM (Eisenia foetida) ON THE NUTRIENT DYNAMICS OF A MIXTURE OF SEMICOMPOSTED MATERIALS Hugo Castillo 1*, Adriana Hernández 2, David Dominguez 1, and Damaris Ojeda
Sepam IEC communication
 Electrical network protection Sepam IEC 60870-5-03 For Sepam series 20/40/60/80 User s manual 0/203 Safety instructions 0 Safety symbols and messages Read these instructions carefully and look at the equipment
The Economy and the Power of Money
 The Economy and the Power of Money Dr. Hasan ALPAGU 1 Abstract This paper is an attempt to bring light into relations between economic developments and the developments in the society. The key and fundamental
TOWARD A NEW HORIZON IN DIGITAL MARKETING: SOCIAL MEDIA MARKETING - Naciye Güliz UĞUR - Merve TÜRKMEN BARUTÇU & DİJİTAL PAZARLAMADA YENİ BİR UFUK: SOSYAL MEDYA PAZARLAMA
 i HONORARY PRESIDENT Prof.Dr. Mehmet Yavuz COŞKUN (Rector of Gaziantep University) CONFERENCE PRESIDENTS Prof. Dr. Mehmet ÖZASLAN (Dean of Nizip Education Faculty, Gaziantep University) Prof. Dr. Mustafa
The aim of this thesis is to measure scientifically whether brand equity dimensions have any
 ABSTRACT Brand equity compromises all the feelings and considerations of consumers towards a brand of a company. Brand equity provides benefit to both brand and consumer. At the same time, brand equity
ERP 1100 Functional Emergency Stretcher
 erpomed.com.tr ERP 1100 Functional Emergency Stretcher General Specifications Full length X-ray translucent mattress platform Possibility of X-ray examination on the stretcher by C-Arm machine on stretcher
The long and longing relations of the EU with its neighbors and the case of Turkey Why the collaboration works but integration does not work?
 European International Journal of Science and Technology Vol. 4 No. 1 January, 2015 The long and longing relations of the EU with its neighbors and the case of Turkey Why the collaboration works but integration
VIRTUAL MUSEUM and REVIEW OF VIRTUAL MUSEUMS IN TURKEY. Research Assistant Arzu Cilasun, Yasar University, Department of Architecture
 VIRTUAL MUSEUM and REVIEW OF VIRTUAL MUSEUMS IN TURKEY Research Assistant Arzu Cilasun, Yasar University, Department of Architecture [email protected] Museums can be defined in many different ways.
Wolf Safety Lamp Company. ATEX Explained. Ex Equipment
 Wolf Safety Lamp Company ATEX Explained Ex Equipment This guide is provided to aid in the selection of Wolf lighting products for use in potentially explosive atmospheres. Information given is based on
Estrogen deprivation can cause vaginal atrophy symptoms. Frequency and determinants of urogenital symptoms in postmenopausal Islamic women
 Menopause: The Journal of The North American Menopause Society Vol. 21, No. 2, pp. 000/000 DOI: 10.1097/gme.0b013e3182937966 * 2013 by The North American Menopause Society Frequency and determinants of
Get started with Google Drive
 Get started with Google Drive 1 Store any file Use Drive s 15GB of free Google storage to keep anything you want. Learn how to add a file Share files and folders Everyone can see and edit files at the
CORROSION OF ALUMINIUM
 CORROSION OF ALUMINIUM Elsevier Internet Homepage- http://www.elsevier.com Consult the Elsevier homepage for full catalogue information on all books, journals and electronic products and services including
THE EFFECTS OF EXPERIENTIAL MARKETING AND SERVICE QUALITY ON CUSTOMER SATISFACTION AND COSTOMER LOYALTY AT SHOPPING CENTERS
 Journal of Naval Science and Engineering 2013, Vol.9, No.1, pp.46-66 THE EFFECTS OF EXPERIENTIAL MARKETING AND SERVICE QUALITY ON CUSTOMER SATISFACTION AND COSTOMER LOYALTY AT SHOPPING CENTERS Ph.D. Mustafa
Remotus. Robust radio remote control for safety critical industrial applications ROBUST SWEDISH DESIGN SINCE 1918
 Remotus Robust radio remote control for safety critical industrial applications ROBUST SWEDISH DESIGN SINCE 1918 Content INTRODUCTION... 4 REMOTUS JUPITER... 6 TRANSMITTERS RECEIVERS REMOTUS MERCURY...
Just Enough ENGLISH GRAMMAR. Illustrated. Gabriele Stobbe
 Just Enough ENGLISH GRAMMAR Illustrated Gabriele Stobbe New York Chicago San Francisco Lisbon London Madrid Mexico City Milan New Delhi San Juan Seoul Singapore Sydney Toronto Copyright 2008 by Gabriele
English for Academic Research: Grammar Exercises
 English for Academic Research: Grammar Exercises wwwwwwwwwwwwwwww Adrian Wallwork English for Academic Research: Grammar Exercises Adrian Wallwork Via Carducci 9 56127 Pisa, Italy [email protected]
A Plan for Center City, Philadelphia. Daniel Schack, AICP, PTP
 Congestion Management Solutions for Dense Urban Corridors: A Plan for Center City, Philadelphia Presented by: Daniel Schack, AICP, PTP ITE 2010 Annual Meeting and Exhibit August 11, 2010 1 Project Background
Composting with Worms Let Worms Eat Your Garbage
 U N I V E R S I T Y o f C A L I F O R N I A Agriculture & Natural Resources C O O P E R A T I V E E X T E N S I O N Y O L O C O U N T Y 70 Cottonwood Street, Woodland, CA 95695 Tel. (530) 666-8143 Fax
SERVICE MANUAL. SC-T7000 series SC-T5000 series SC-T3000 series. Confidential. Large Format Color Inkjet Printer SEIJ12008
 SERVICE MANUAL Large Format Color Inkjet Printer SC-T7000 series SC-T5000 series SC-T3000 series SEIJ12008 Notice: All rights reserved. No part of this manual may be reproduced, stored in a retrieval system,
Factors predictive of clinical pregnancy in the first intrauterine insemination cycle of 306 couples with favourable female patient characteristics
 Human Fertility, 2013; 16(4): 286 290 ISSN 1464-7273 print/issn 1742-8149 online DOI: 10.3109/14647273.2013.841328 ORIGINAL ARTICLE Factors predictive of clinical pregnancy in the first intrauterine insemination
The effects of a heterochromatin polymorphism in chromosome 6 on
 Asian Pacific Journal of Reproduction 2015; 4(1): 41-43 41 Asian Pacific Journal of Reproduction Journal homepage: www.apjr.net Document heading doi: 10.1016/S2305-0500(14)60056-7 The effects of a heterochromatin
Turks in Transoxiana. Richard N. Frye
 Turks in Transoxiana Richard N. Frye It is over half a century since my roommate, the late Professor Aydin Sayili, and myself jointly investigated the disputed question of Turks in the Near East in the