Doğu Akdeniz Bölgesindeki Aerosollerin İklimsel Önemi
|
|
|
- Ömer Savas Poyraz
- 5 yıl önce
- İzleme sayısı:
Transkript
1 Doğu Akdeniz Bölgesindeki Aerosollerin İklimsel Önemi Proje No: 15Y368-GSRT Prof. Dr. Nilgün KUBİLAY Dr. Mustafa KOÇAK MAYIS 29 ERDEMLİ-MERSİN
2 ÖNSÖZ Doğu Akdeniz atmosferindeki yüksek aerosol yoğunluğunun önemli bir çevresel etki potansiyeline sahip olduğu Türkiye ve Yunanistan gibi bölgeyi çevreleyen ülkelerde gerçekleştirilen bilimsel araştırmalar ile gösterilmiştir. Bu araştırmaların sonucunda aerosollerin bölgede iklim, hava kalitesi, atmosferden denizel ortama materyal taşınması ve hidrolojik döngü üzerinde etkili olduğu veriler ile ispatlanmıştır. Ancak elde edilen verilerin miktarı ve niteliği iklim modellerinin bölgesel ölçekte güvenilir sonuçlar vermesi için yetersiz kalmıştır. Burada final raporu sunulan projede Orta Doğu Teknik Üniversitesi-Deniz Bilimleri Enstitüsü ve Girit Üniversitesi-Kimya Bölümünün işbirliği kapsamında doğu Akdeniz aerosolleri araştırılmıştır. Proje süresince yürütülen ikili işbirliği kapsamında Ek de sunulan iki adet makale ve bir adet konferans bildirisi üretilmiştir. Ayrıca bu süreçte her iki grubunda ortak olduğu ve FP7 kapsamında desteklenen bir AB projesinde yer alınmıştır. Proje kapsamında ODTÜ Deniz Bilimleri Enstitüsü (ODTÜ-DBE) kampüsünde ve Girit Adasında 23 yılı içerisinde eş zamanlı toplanmış aerosol numunelerine ait veriler analiz edilmiştir. Ayrıca ODTÜ-DBE ye ait araştırma gemisi R/V BİLİM II ile Avrupa Birliği destekli SESAME projesi kapsamında gerçekleştirilen deniz seferleri süresince Akdeniz, Ege Denizi, Marmara ve Karadeniz atmosferlerinden aerosol örnekleri toplanmış, analizleri gerçekleştirilerek sonuçları yorumlanmıştır. Proje Türkiye Bilimsel ve Teknolojik Araştırma Kurumu (TÜBİTAK) ve Yunanistan Kalkınma Bakanlığı-Araştırma ve Teknoloji Genel Sekreterliği (GSRT) arasındaki ikili işbirliği protokolü çerçevesinde her iki kurum tarafından desteklenmiştir. ii
3 İÇİNDEKİLER ÖNSÖZ...İİ İÇİNDEKİLER... İİİ ŞEKİLLER...İV TABLOLAR... V ÖZET...Vİ ABSTRACT... Vİİ 1.GİRİŞ Küresel Ölçekte Aerosol Araştırmalarının Önemi Akdeniz Bölgesinde Aerosol Araştırmalarının Önemi GEREÇ VE YÖNTEM BULGULAR Erdemli ve Finokalia İstasyonlarına ait 23 Yılı Verileri TARTIŞMA Yılına Ait Verilerin Değerlendirilmesi Aerosollerin 23 Yılına Ait Optik Özellikleri Suda Çözünebilir İyonlar ile Aerosol Optik Kalınlıklar ve Angström Katsayısı Arasındaki İlişkiler Mart-Mayıs ve Eylül-Ekim 28 Yılana Ait Verilerin Değerlendirilmesi ÖNERİLER REFERANSLAR EKLER iii
4 ŞEKİLLER Şekil 1. Eylül 2 dönemine ait MODIS uydusu verileri ile türetilmiş AOT nin küresel dağılımı (KAUFMAN ve diğ., 22). (a) İnce tanecikli aerosollere ait AOT; (b) Kaba tanecikli aerosollere ait AOT Şekil 2. Endüstriyel devrim öncesi (175) ile günümüz (199 ların ikinci yarısından 2 lere uzanan dönem) atmosfer bileşenlerinin (gazlar ve aerosoller) miktarlarındaki, arazi kullanımındaki ve güneş ışıma miktarlarındaki değişimlerin neden olduğu radyasyon zorlanmaları (IPCC, 21) Şekil 3. Atmosferin tepesinde aerosollerin neden olduğu soğuma etkisinin küresel dağılımı (a) Ocak, (b) Temmuz (HATZIANASTASSIOU ve diğ., 24)... 4 Şekil 4. Küresel AERONET ölçüm ağına ait istasyonların lokasyonları... 5 Şekil 5. (a) Yaz mevsimine ait toplam aerosol optik kalınlığı (AOT) (b) deniz tuzuna ait AOT;(c) çöl tozuna ait AOT; (d) karasal (antropojenik) emisyonlardan kaynaklanan aerosollere ait AOT (BARNABA ve GOBBI, 24)... 6 Şekil Ağustos ayına ait (a) aerosol optik kalınlığı; (b) sera gazları ve aerosollerin neden olduğu radyasyon değişimi; (c) ince (fine) ve kaba (coarse) tanecik boyutuna sahip aerosollerin kimyasal bileşimi (LELIEVELD ve diğ., 22)... 7 Şekil 7. Aerosol örneklerinin toplandığı istasyonların lokasyonları... 8 Şekil 8. SESAME projesi kapsamında BİLİM II gemisi ile gerçekleştirilen araştırma seferlerinin rotası... 9 Şekil 9. Erdemli istasyonunda bulunan güneş fotometresi Şekil 1. Erdemli ve Finokalia istasyonları atmosferine ait aerosollerin suda çözülebilir iyonların mevsimsel zaman serileri (a) Na + ; (b) Cl - ; (c) Mg 2+ ; (d) Br - ; (e) nssca 2+ ; (f) nssk + ; (g) nssso 4 2- ; (h) NO 3 - ; (i) NH 4 + ve (j) C 2 O Şekil Nisan 23 tarihine ait Erdemli için (a) geri yörüngeler, (b) TOMS Aerosol Index (AI) ve (c) MODIS uydu resmi Şekil Mayıs 23 tarihine ait kompozit TOMS Aerosol Index (AI) Şekil 13. Erdemli ve Finokalia istasyonları için türetilen aerosol optik kalınlıkların (AERONET: 44, 87 ve 12 nm, MODIS: 55 nm) ve angström katsayıların (α ) aylık ortalamaları Şekil 14. MODIS Aerosol optik kalınlıkları ile AERONET aerosol optik kalınlıklarının (AOT) karşılaştırılması. (a) Erdemli ve (b) Finokalia. Siyah çizgiler regresyon eğrilerini ve kesikli çizgiler regresyon eğrisinden MODIS AOT ye karşılık gelen teorik değerlere MODIS AOT nin standart sapmasının (Erdemli: %5 ve Finokalia: %56) eklenip ve değerlerden çıkarılarak hesaplanan rakamlara karşılık gelmektedir Şekil 15. MODIS Aerosol optik kalınlıkları ile AERONET aerosol optik kalınlıklarının karşılaştırılması. (a) Erdemli ve (b) Finokalia Şekil 16. nssso 4 2- ve AOT 44 arasındaki bağıntı. (a) Erdemli ve (b) Finokalaia Şekil 17. Gözlenen PM 1 konsantrasyonlarına kaynakların göreceli katkısı. MT: Mineral Toz; DT: Deniz Tuzu; IK: İyonik Kütle; OC: Organik Karbon; EC: Elemental Karbon Şekil Nisan 28 gününe ait OMI-Aerosol Index (a) ve 3 günlük hava kütlelerinin geri yörüngeleri (b) iv
5 TABLOLAR Tablo 1. Erdemli ve Finokalia dan eş zamanlı toplanan aerosol örneklerinde belirlenen suda çözülebilir iyon konsantrasyonlarına ait istatistiksel veriler. (Tablodaki tüm konsantrasyonlar µg m-3 cinsinden sunulmuştur) Tablo 2. Erdemli ve Finokalia istasyonlarında belirlenen aerosol optik kalınlıkları ve Angström katsayıları için istatistiksel özet. 1 ve 2 sırası ile yer ölçümleri (AERONET) ve uzaktan algılama (MODIS) yöntemlerini simgelemektedir Tablo 3a. Mart-Mayıs 28 döneminde gerçekleştirilen deniz seferinde toplanan aerosol numunelerine ait PM 1, iz metaller, suda çözülebilir iyonlar ile organik karbon (OC) ve elemental karbon (EC) konsantrasyonlarına ait istatistiksel bilgiler (Sefer rotası Şekil 8 de sunulmuştur). PM 1 konsantrasyonları μg m -3, diğer aerosol bileşenlerinin konsantrasyonları ise ng m -3 cinsinden sunulmuştur Tablo 3b. Eylül-Ekim 28 döneminde gerçekleştirilen deniz seferinde toplanan aerosol numunelerine ait PM 1, iz metaller, suda çözülebilir iyonlar ile organik karbon (OC) ve elemental karbon (EC) konsantrasyonlarına ait istatistiksel bilgiler (Sefer rotası Şekil 8 de sunulmuştur). PM 1 konsantrasyonları μg m -3, diğer aerosol bileşenlerinin konsantrasyonları ise ng m -3 cinsinden sunulmuştur Tablo 3c. Eylül-Ekim 28 döneminde Erdemli de toplanan aerosol numunelerine ait PM 1, iz metaller, suda çözülebilir iyonlar ile organik karbon (OC) ve elemental karbon (EC) konsantrasyonlarına ait istatistiksel bilgiler. PM 1 konsantrasyonları μg m -3, diğer aerosol bileşenlerinin konsantrasyonları ise ng m -3 cinsinden sunulmuştur Tablo 4. Suda çözünebilir iyonlar arasındaki karşılıklı bağıntı (a) Erdemli ve (b) Finokalia. Kuvvetli korelasyon katsayıları gri ile vurgulanmıştır... 2 Tablo 5. Sefer-I,II ve Erdemli de elde edilen verilerin Finokalia verileri ile karşılaştırılması. PM 1 konsantrasyonları μg m -3, diğer aerosol bileşenlerinin konsantrasyonları ise ng m -3 cinsinden sunulmuştur. * SMOLIK ve diğ., (23); BARDOUKI ve diğ., (23); # SCIARE ve diğ., (28) v
6 ÖZET Bu çalışma, 23 yılında Türkiye (Erdemli) ve Girit (Finokalia) kıyılarında bulunan iki istasyondan toplanan kapsamlı veri seti kullanılarak Doğu Akdeniz deki suda çözünebilir aerosol iyon (Na +, NH 4 +, K +, Mg 2+, Ca 2+, Cl -, NO 3 -, SO 4 2-, C 2 O 4 2 ) derişimlerinin ve aerosol optik ölçümlerinin mekansal ve zamansal değişimlerini değerlendirilmiştir. Ayrıca, Mart- Mayıs 28 (Sefer I) ve Eylül-Ekim 28 (Sefer II) dönemlerinde BILIM II araştırma gemisi ile Doğu Akdeniz, Ege Denizi, Marmara Denizi ve Karadeniz atmosferlerinden aerosol örnekleri toplanmıştır. Sefer II süresince aerosol örneklemeleri gemide ve Erdemli de eş zamanlı olarak yapılmıştır. Her iki istasyondan 23 yılında toplanan örneklerdeki suda çözünebilir iyon derişimlerinin mevsimsel değişimlerinin yağışla ilişkili olduğu gösterilmiştir. Ölçülen atmosferik türlerin konsantrasyonları (Deniz tuzu kaynaklı olanlar hariç) minimum değerlerine kışın düşmekte ancak yazın yağmur olmaması bu türlerin atmosferde birikmesine sebep olmaktadır. Toprak kökenli iyonlar aralıklı fakat kuvvetli pik konsantrasyonlarını bölgeye Sahra ve Arap Yarımada sından gelen mineral tozlar nedeniyle yağışlı olmasına karşın geçiş mevsimleri süresince göstermektedir. Yerde konuşlandırılmış optik ölçümler Aerosol Robotic Network (AERONET) programı çerçevesinde Erdemli de ve Finokalia da yapılmıştır. Ölçümler bölgenin baskın aerosol optik özelliklerinin belirlenmesinde ve tanımlanmasında kullanılmıştır. Sülfat (nss-so 4 2- ) aerosolü ve aerosol optik kalınlık (AOT 44 ) arasındaki ilişki her iki istasyonda da 44 nm için türetilen optik kalınlığın ana nedenin sülfat partikülleri olduğunu göstermiştir. Gemiden toplanan örneklerde belirlenen ortalama PM 1 konsantrasyonu, suda çözünebilir aerosol iyon ve elemental kompozisyonlar kıyısal Erdemli ve Finokalai istasyonları için rapor edilen konsantrasyonlarla aynı seviyelerdedir. Sahra kaynaklı toz girişleri nedeniyle Sefer I süresince gözlenen aerosol konsantrasyonları (özellikle toprak kökenli elementler) Sefer II ye kıyasla yüksek gözlenmiştir. PM 1 kütle konsantrasyonuna mineral tozun, deniz tuzunun, iyonik kütlenin, organik ve elemental karbonun göreceli katkıları hesaplanmış ve Finokalia verileri ile karşılaştırılmıştır. Anahtar Kelimeler: aerosol; doğu Akdeniz; kimyasal komposizyon; optik özellikler; mevsimsel değişkenlik; uzun menzilli taşınım vi
7 ABSTRACT The current study considers the spatial and temporal variability in aerosol water soluble ions (Na +, NH 4 +, K +, Mg 2+, Ca 2+, Cl -, NO 3 -, SO 4 2-, C 2 O 4 2 ) concentrations and aerosol optical measurements in the eastern Mediterranean, utilizing an extensive data library collected in 23 at two stations along the Turkish (Erdemli) and Cretan (Finokalia) coastline. In addition, aerosol samples were collected aboard the research vessel s BILIM II cruising the eastern Mediterranean, Aegean Sea, the Sea of Marmara and Black Sea during two periods in March-May 28 (Cruise I) and September-October 28 (Cruise II). During Cruise II aerosol sampling was performed both on board and at the Erdemli station simultaneously. The ionic concentrations of aerosols collected in 23 at both stations indicated that the seasonal variability were related to precipitation events. The atmospheric concentrations of measured species (except those of marine origin) decreases to minimum values during winter, whereas, during dry summer months the lack of precipitation resulted in their accumulation in the atmosphere. During the transition periods, although there was still precipitation, crustal ions exhibited sporadic but intense concentration peaks due to the intrusion of dust from the Sahara and the Arabian Peninsula. Ground based aerosol optical measurements were conducted within framework of the Aerosol Robotic Network (AERONET)I program both at Erdemli and Finokolia. The measurements were used to identify and define predominant regional aerosol optical properties. A relationship between aerosol sulfate (nss-so 4-2 ) and aerosol optical thickness (AOT 44 ) at both stations denoted that sulfate particles are the main components of the optical thickness derived at 44 nm. Geometric mean concentrations of PM 1, aerosol water soluble ions and elemental compositions determined in samples collected on board are at similar level with the concentrations reported for the coastal stations of Erdemli and Finokalia. High concentrations of aerosols (especially for crustal elements) collected during Cruise I relative to Cruise II corresponded to incursions of Saharan dust. The relative contribution of mineral dust, sea salt, ionic mass, organic and black carbon on PM 1 mass concentrations was calculated and compared with Finokalia data. Key Words: aerosol; eastern Mediterranean;chemical composition; optical properties; seasonal variation; long-range transport vii
8 1.GİRİŞ 1.1.Küresel Ölçekte Aerosol Araştırmalarının Önemi Geçtiğimiz yüzyılda Yeryüzü sıcaklığı.6 C artarak son bin yıllık dönemin en yüksek seviyesine ulaşmıştır. İklim değişimi üzerinde etkili olan bir çok etmenin yanısıra antropojenik seragazlarının ve aerosollerin gözlenen sıcaklık değişimi üzerinde önemli bir rolü olduğu belirlenmiştir (IPCC, 21). Yeryüzü tarafından soğurulan güneş ışınları ısıya dönüşerek kızılötesi ışımalar oluşur. Bu ışımalar ise atmosferdeki sera gazları (fosil yakıtların kullanılması ile açığa çıkan CO 2 en bilinen sera gazıdır) tarafından soğurularak ısınmaya neden olurlar. Sera gazlarının atmosferde kalış süresi 1 yıl civarında olup küresel ölçekte homojen bir biçimde dağılmıştır. Bu sebeple küresel ölçekte CO 2 in artış miktarı tek bir istasyondan gerçekleştirilen yer ölçümü ile belirlenebilmiş ve sera gazlarının ısınma üzerindeki katkısı hesaplanabilmiştir. Atmosferik aerosoller ise dünyanın radyasyon dengesini direk (güneş ışınlarını saçarak ve/veya soğurarak) ve/veya indirek (bulut oluşumu için gerekli çekirdek görevini görerek) yollarla etkilemektedir. Sera gazlarının yarattığı ısınma etkisinin tersi yönde iklimi soğutma yönünde etkilediği için aerosollerin iklim üzerindeki etkisi beyaz ev (white house effect) veya şemsiye (parasol) olarak tanımlanmıştır (SCHWARTZ, 1996; CRUTZEN ve diğ., 23). Aerosollerin atmosferde kalış süresi kısa olup bir hafta kadardır. Dolayısı ile aerosollerin küresel atmosferde dağılımı heterojen bir yapı göstermektedir. Ayrıca aerosollerin tanecik boyutları ve kimyasal komposizyonları kaynaklarına göre farklılık göstermektedir. Aerosoller ince ve kaba tanecikli parçacıklar olarak ikiye ayrılmaktadır. İnce tanecikli parçacıklar genel olarak antropojenik aktiviteler (fosil yakıtlar ve biyokütle yakılması) ile atmosfere salınan parçacıklar olup genellikle sülfatlardan, kara karbon (black carbon) ve organik karbondan oluşmaktadır. Kaba tanecikli olanlar ise rüzgar aşınması ile atmosfere dağılan toprak ve deniz tuzu parçacıkları olup doğal kaynaklı aerosoller sınıfını oluşturmaktadır. Antropojenik aktiviteler sonucunda atmosferde artan aerosollerin miktarını ve dağılımını belirleyebilmek için doğal ve antropojenik kaynaklardan atmosfere yayılan aerosollerin tanımlanması şarttır. Aerosoller atmosferde homojen dağılmadığı (yer ve zaman ölçeğinde çok farklılıklar göstermektedirler) için uzaktan algılama metotları ile aerosollerin dağılımının belirlenmesi gerekmektedir. Uzaktan algılama verileri elverişli algoritmalar ile işlenerek atmosfer kolonundaki aerosol yoğunluğu hesaplanabilmektedir. Aerosollerin optik kalınlığı (AOT, Aerosol Optical Thickness) uzaktan algılama metodu ile elde edilen atmosfer kolonundaki aerosol yoğunluğunu ifade etmektedir. Kaba ve ince tanecikli aerosollere ait küresel AOT dağılımı Şekil 1 de sunulmuştur (RAMANATHAN ve diğ., 21; KAUFMAN ve diğ., 22). Şehirlerin ve endüstriyel aktivitelerin yoğun olduğu bölgelerdeki aerosol emisyonları ince tanecikli olup antropojenik kaynaklı aerosollerin yoğun olduğu bölgeleri işaret etmektedir (Şekil 1a da a, c ve e ile belirlenmiş bölgeler). Önceleri bu bölgelerdeki aerosollerin baskın olarak sülfatlardan oluştuğu kabul edilmekte idi ancak yer ölçümleri ile elde edilen sonuçlar buralardaki aerosollerin önemli bir bölümünü karbonlu parçacıkların oluşturduğunu göstermiştir. Biyokütle yakılması ile atmosfere dağılan ince tanecikli parçacıklar ise genel olarak siyah karbon (black carbon) parçacıklardır (Şekil 1a da b ve d ile belirlenmiş bölgeler). Afrika, doğu Asya ve Arap Yarımadası üzerindeki çöllerden rüzgar aşınımı ile atmosfere dağılan kaba tanecikli tozlar (mineral dust) ise doğal kaynaklardan yayılan aerosolleri göstermektedir (Şekil 1b de a ve c ile belirlenmiş bölgeler). Ayrıca okyanus kaynaklı aerosollerde (deniz tuzu parçacıkları ve denizel ortamdaki mikroskobik canlıların aktivitesi ile atmosfere yayılan sülfat parçacıkları) Şekil 1b de b ile gösterilmiş 1

9 alanda yoğun olarak gözlenmektedir. Sonuç olarak antropojenik aktiviteler ile atmosfere yayılan aerosolleri doğal kaynaklardan yayılan aerosollerden ayırmak zordur. Yer seviyesinde toplanan aerosol numunelerinin kimyasal analizlerinin yapılması gerekmektedir. Uzaktan algılama verilerinin algoritmalar ile işlenmesi sonucunda elde edilen bulguların yer ölçümleri ile doğrulanması gerekmektedir. Şekil 1. Eylül 2 dönemine ait MODIS uydusu verileri ile türetilmiş AOT nin küresel dağılımı (KAUFMAN ve diğ., 22). (a) İnce tanecikli aerosollere ait AOT; (b) Kaba tanecikli aerosollere ait AOT. Küresel radyasyon dengesinin değişimine (endüstriyel devrim öncesi şartları ile günümüz şartlarının karşılaştırılması) neden olan her bir faktörün (atmosferdeki sera gazları ve aerosol yoğunluğu, arazi kullanımındaki değişimler, güneş ışınımındaki doğal değişim v.b.) katkısı hesaplanmıştır. Şekil 2 de iklim modelleri ile hesaplanmış her bir etmene ait küresel ısınım zorlanması yıl bazında gösterilmiştir. Y ekseninde hesaplanan ısınım zorlanması miktarı, X ekseninde ise etmene ait bilimsel bulgu ve bilgi seviyesini gösteren indeksler kullanılmıştır ( H, High-Yüksek; M, Medium-Orta; L, Low-Düşük ve VL Very Low-Çok Düşük). Sera gazlarının (CO 2 +CH 4 +N 2 O+Halokarbonlar) ısınma üzerindeki katkısı 2.5 W m -2 2
10 civarında olduğu ve bu hesaplamadaki belirsizliğin çok düşük seviyede olduğu gözlenmektedir. Ancak aerosollerin kimyasal yapılarına göre soğuma ve/veya ısınma etkisi yarattıklarından dolayı aerosollere ait hesaplamalardaki belirsizliklerinin yüksek olduğu dikkati çekmektedir. Sülfat aerosolleri soğuma yönünde etki gösterirken, fosil yakıtların (Şekilde FF, Fossil Fuel ile gösterilmiştir) kullanımı ile atmosfere yayılan aerosollerdeki kara karbon (bc) ısınma yönünde, organik karbon (oc) ise soğuma yönünde etkili olmaktadır. Benzer biçimde önemli oranda çöllerden kaynaklanan tozlar (mineral dust) hem soğuma ve hem de ısınma etkisi yaratmaktadır. Biyokütle yanması (BB, Biomass Burning) ile atmosfere yayılan aerosoller ise soğuma yönünde katkı sağlamaktadır. Görüleceği üzere sera gazlarının radyasyon dengesinin bozulması üzerindeki katkısı küresel ölçekte hassas olarak hesaplanabilmekte iken aerosollerin katkısı olduğu belirlenmiş ancak hesaplamaların belirsizliği veri eksikliği nedeni ile yüksek seviyelerde kalmıştır (IPCC, 21). Şekil 2. Endüstriyel devrim öncesi (175) ile günümüz (199 ların ikinci yarısından 2 lere uzanan dönem) atmosfer bileşenlerinin (gazlar ve aerosoller) miktarlarındaki, arazi kullanımındaki ve güneş ışıma miktarlarındaki değişimlerin neden olduğu radyasyon zorlanmaları (IPCC, 21). HATZIANASTASSIOU ve diğ. (24) tarafından atmosferik radyasyon transfer modeli kullanılarak aerosollerin neden olduğu soğuma etkisinin küresel ölçekte dağılımı kış ve yaz ayları için hesaplanmıştır (Şekil 3). Bu çalışmada yıl bazında doğal ve antropojenik kaynaklı aerosollerin küresel ölçekte ortalama olarak yer seviyesinde 1.4 W m -2 mertebesinde soğuma etkisi yarattığı gösterilmiştir. Ancak soğuma etkisinin zaman ve yer ölçeğinde önemli miktarda değiştiği belirtilmiştir (bknz. Şekil 3). Şekil 3b de yaz mevsiminde doğu Akdeniz üzerindeki aerosollerin 1 W m -2 mertebesinde soğuma (küresel ölçekte aerosollerin maksimum soğumaya neden olduğu bölge) yarattığı görülmektedir. Bu çalışmada kullanılan modelin çalıştırılabilmesi için aerosollerin detaylı mikrofiziksel, mikrokimyasal, optik ve radiyatif özelliklerine ihtiyaç vardır. Saha çalışmalarında gerçekleştirilen ölçümler aerosollerin bu özelliklerinin küresel dağılımını veremedikleri için bu özellikler model simülasyonları ile küresel ölçekte çıkarılmaktadır. Dolayısı ile bu hesaplamalardaki belirsizlikler yüksektir. Bu belirsizliklerin seviyesinin düşürülmesi için NASA tarafından 3
 Ocak, (b) Temmuz (HATZIANASTASSIOU ve diğ.")
11 yürütülen AERONET (AErosol RObotic NETwork) izleme ağı ile global ölçekte ölçümler gerçekleştirilmektedir. Bu ölçümlerle küresel ölçekte aerosollerin optik özellikleri belirlenmektedir. AERONET ölçüm ağına dahil istasyonlar Şekil 4 te sunulmuştur. Şekil 3. Atmosferin tepesinde aerosollerin neden olduğu soğuma etkisinin küresel dağılımı (a) Ocak, (b) Temmuz (HATZIANASTASSIOU ve diğ., 24). AERONET ölçümlerinden (yer seviyesinde gerçekleştirilen uzaktan algılama) türetilen AOT değerleri, uzaktan algılama (uydu seviyesinde gerçekleştirilen ) verilerinden türetilen AOT lerin doğrulanması ve uydu verilerinden gerçekçi bilgiler türetilmesi açısından önemlidir. Aerosollerin radiyatif özelliklerinin hesaplanabilmesi için gerekli optik özellikler (AOT, single scattering albedo ve asymmetry parameter gibi) AERONET ölçümlerinden 4

12 türetilmektedir. Tüm ölçüm ağına ait istasyonlardaki ölçümlerden türetilen veriler internet üzerinden kullanıcıya açıktır. Şekil 4. Küresel AERONET ölçüm ağına ait istasyonların lokasyonları. Aerosollerin atmosferde bulut yoğuşturma çekirdeği olmaları nedeni ile bulut miktarı ve dağılımı üzerinde de etkisi vardır. Dolayısı ile bulut miktarında artışa neden oldukları için troposferdeki aerosollerin indirek olarak (bulut oluşturarak) soğuma yönünde katkısı oldukça yüksek olmakla birlikte konu ile ilgili bilimsel birikim çok düşük seviyelerde olduğu için Şekil 2 de bu etmene ait hesaplanmış soğuma miktarındaki belirsizlik çok yüksektir. Aerosollerin bulutlar üzerindeki etkisi dolayısı ile su döngüsü üzerindeki katkısı da tartışılmaktadır (RAMANATHAN ve diğ., 21). Öte yandan aerosollerin denizel ortama yağışlarla ve/veya kuru çökelme ile besin tuzu (fosfat, azot ve demir) taşıyarak ortamın biyojeokimyasal döngülerine ve dolaylı olarak iklim üzerinde katkısı olduğu gösterilmiştir (JICKELLS ve diğ., 25; MAHOWALD ve diğ., 28; DUCE ve diğ., 28). Sonuç olarak yukarıda sunulan bilgiler ışığında aerosollerin çevresel etkilerinin yadsınamaz olduğu görülmektedir. Aerosollerin hava kalitesi, iklim ve biyojeokimyasal döngüler üzerindeki etkilerinin tanımlanması ve belirlenmesi için yeterli ölçümler (yer ölçümleri ve uzaktan algılama) mevcut değildir. Aerosollerin atmosferde dağılımı homojen bir yapıya sahip olmadığı için detaylı aerosol araştırmalarının bölgesel ölçekte yapılması gerekmektedir. 1.2.Akdeniz Bölgesinde Aerosol Araştırmalarının Önemi Akdeniz atmosferi farklı kaynaklardan salınan ve uzun menzilli atmosferik taşınıma maruz kalan dünyanın en yüksek aerosol yoğunluğunun tesbit edildiği bölgelerden bir tanesidir (LELIEVELD ve diğ., 22; BARNABA ve GOBBI, 24; PAPADIMAS ve diğ., 28). Kaynak bölgeleri tesbit edilen aerosol türleri şunlardır: ince tanecikli antropojenik karasal emisyonlar, kaba tanecikli Afrika kıtasından taşınan çöl tozları ve deniz tuzu parçaçıkları. Bu kaynaklara ait aerosollerin 21 yılına ait mevsimsel değişimi tüm Akdeniz için uzaktan algılama (MODIS, MODerate Resolution Imaging Spectro-Radiometer) verileri kullanılarak 5

13 BARNABA ve GOBBI (24) tarafından gösterilmiştir (Bknz. Şekil 5). Bu araştırmada en yüksek aerosol yoğunluğu kurak yaz mevsiminde en düşük yoğunluk ise aerosollerin yağışlarla yıkandığı kış mevsiminde gözlenmiştir. Şekil 5c de Afrika kıtasından taşınan mineral tozun Afrika kıyılarında, Şekil 5d de ise yerleşim bölgelerinin yoğun olduğu kıyısal kesimlerde karasal emisyonlardan atmosfere salınan aerosollerin yüksek AOT değerlerinin gözlenmesine neden olduğu görülmektedir. Şekil 5. (a) Yaz mevsimine ait toplam aerosol optik kalınlığı (AOT) (b) deniz tuzuna ait AOT;(c) çöl tozuna ait AOT; (d) karasal (antropojenik) emisyonlardan kaynaklanan aerosollere ait AOT (BARNABA ve GOBBI, 24). 21 yılının ağustos ayında Akdeniz de yoğun bir atmosferik ölçüm kampanyası gerçekleştiren LELIEVELD ve diğ., (22), bulutsuz yaz aylarında aerosollerin iklimsel etkisinin bu bölgede önemli olduğunu gösteren bulgular üretmişlerdir. MODIS verileri ile türetilen AOT dağılımı Ağustos 21 de Akdeniz üzerinde yoğun aerosol olduğunu göstermektedir (Şekil 6a). Aynı dönemde Girit adasında yer seviyesinde ince ve kaba olmak üzere iki ayrı tanecik boyutunda aerosol numuneleri toplanmış ve laboratuarda analiz edilmiştir. İnce tanecik boyutuna sahip aerosollerin (antropojenik kaynaklı) baskın olarak sülfat ve organik karbondan; kaba tanecik boyutuna sahip aerosollerin (doğal kaynaklı) ise çöl tozu, deniz tuzu ve nitrattan oluştuğu gösterilmiştir (Şekil 6c). Bu kampanya döneminde elde edilen bulguların kullanılması ile Akdeniz bölgesindeki sera gazlarına (Green House Gases, GHG) ve aerosollere ait ısınım zorlanması hesaplanmıştır. Hesap sonuçları göstermiştirki aerosollerin yarattığı soğuma etkisi atmosferin en üstünde (TOA, Top Of the Atmosphere) sera gazlarının neden olduğu ısınma etkisinin yaklaşık iki katı iken yer seviyesindeki soğuma etkisi yaklaşık altı katıdır (Şekil 6b). Yine aynı çalışmanın sonucunda çıkan bulgular ile gerçekleştirilen hesaplamalar, Akdeniz bölgesindeki aerosollerin deniz yüzey suyu sıcaklığı üzerinde yaratabileceği soğumanın bölgenin hidrolojik döngüsünü etkileme potansiyeline sahip olduğuna dikkat çekmiştir. Bu çalışmada gerçekleştirilen ölçümler Akdeniz üzerindeki aerosol konsantrasyonlarının Kuzey Pasifik Okyanusu üzerindeki tipik aerosol konsantrasyonlarından 2 ile 1 kat daha fazla olduğunu ve Akdeniz in üzerinde gözlenen 6
 aerosol optik kalınlığı; (b) sera gazları ve aerosollerin neden olduğu radyasyon değişimi; (c) ince (fine) ve kaba (coarse) tanecik boyutuna sahip aerosollerin kimyasal")

 bölgeler ile doğu Akdeniz gibi nehir girdileri açısından yoksul ve oligotrofik özellikteki")
14 AOT lerin (diğer deniz atmosferlerine kıyasla) gözlenen en yüksek değerlere sahip olduğunu göstermiştir. (a) (b) (c) Şekil Ağustos ayına ait (a) aerosol optik kalınlığı; (b) sera gazları ve aerosollerin neden olduğu radyasyon değişimi; (c) ince (fine) ve kaba (coarse) tanecik boyutuna sahip aerosollerin kimyasal bileşimi (LELIEVELD ve diğ., 22). Akdeniz de gözlenen yüksek aerosol yoğunluğu, hava kalitesi açısından değerlendirilmiş ve Avrupa Birliği Hava Kalitesi Mevzuatı kapsamında değerlendirilmiştir (KOÇAK ve diğ., 27a; RODRIGUEZ ve diğ., 27). Son on yıl içerisinde gerçekleştirilen diğer araştırmaların sonuçları, özellikle kıyıdan uzak (açık deniz) bölgeler ile doğu Akdeniz gibi nehir girdileri açısından yoksul ve oligotrofik özellikteki denizler için atmosfer yolu ile denize ulaşan besin tuzlarının ve toksik metallerin önemli olduğunu açıkça kanıtlamıştır (KOÇAK ve diğ., 25; KROM ve diğ., 24; MARKAKI ve diğ., 23) 199 lı yıllardan başlayarak Akdeniz aerosolleri yer ölçümleri gerçekleştirilerek araştırılmıştır. Ancak Akdeniz aerosollerinin zaman ve yer ölçeğinde miktarsal ve kimyasal komposizyon farklılaşması gösterdiği gözlenmiştir (KUBİLAY ve diğ., 22; MARKAKI ve diğ., 23; KOÇAK ve diğ., 24a). Dolayısı ile uzaktan algılama verilerinin kullanılarak hem tüm basen ölçeğinde ve hem de uzun dönemde aerosol verilerinin çıkarılması çok önemlidir. Uzaktan algılama verilerinden türetilen aerosoller ile ilgili bulguların doğruluğunun test edilmesi için yer seviyesinde yapılan ölçümlerin önemi tartışılmaz bir gerçektir. 7
15 Proje önerisinde sunulduğu üzere bu araştırma kapsamında genel olarak Akdeniz atmosferinde (Türkiye, Erdemli ve Yunanistan, Girit, Finokalia) toplanmış aerosol numunelerinde analiz edilmiş olan suda çözünebilir iyonlardan oluşan veri seti detaylı bir biçimde değerlendirilmiştir. Buna ek olarak, her iki istasyon için elde edilen aerosol optik kalınlıkları yer ölçümleriyle karşılaştırıldıktan sonra ölçülmüş olan suda çözülebilen iyonlarla ilişkileri gösterilmiştir. Ayrıca 21 Mart- 7 Mayıs ve 15 Eylül- 2 Ekim 28 tarihleri arasında Orta Doğu Teknik Üniversitesi-Deniz Bilimleri Enstitüsü ne (ODTÜ-DBE) ait araştırma gemisi RV-BİLİM II ile yapılan seferler süresince Akdeniz, Ege Denizi, Marmara ve Karadeniz atmosferlerinden aerosol örnekleri toplanmış ve analiz sonuçları da değerlendirilmiştir. 2.GEREÇ ve YÖNTEM Doğu Akdeniz bölgesinde bulunan iki farklı istasyondan (Erdemli ve Girit adasında bulunan Finokalia) 23 yılı içerisinde filtre kağıtları üzerinde toplanan aerosol örneklerinin kimyasal analizleri bu proje kapsamında Girit Üniversitesinde analiz edilmiştir (istasyonların lokasyonu Şekil 7 de verilmiştir). Ocak 23 ve Aralık 23 tarihleri arasında Erdemli ve Finokalia istasyonlarından sırası ile 317 ve 4 aerosol örneği toplanmıştır Erdemli 36 Finokalia Şekil 7. Aerosol örneklerinin toplandığı istasyonların lokasyonları. Ayrıca, Mart-Mayıs 28 ve Eylül-Ekim 28 dönemlerinde Bilim II gemisiyle Enstitünün yürütmekte olduğu AB destekli SESAME (Southern European Seas: Assessing and Modelling Ecosystem change) konu başlıklı araştırma projesi kapsamında gerçekleştirilen deniz seferleri süresince Akdeniz, Ege, Marmara ve Karadeniz atmosferlerinde sırası ile 37 ve 26 aerosol örnekleri toplanmıştır (Şekil 8). Buna ek olarak, Eylül-Ekim 28 döneminde Erdemli istasyonunda (n = 32) Sesame seferi ile eş zamanlı örnekleme yapılmıştır. Toplanan aerosol numunelerini bu proje kapsamında Girit Üniversitesine gerçekleştirilen çalışma ziyaretleri çerçevesinde Kimya Bölümündeki Çevresel Kimya Prosesleri Laboratuarında gerçekleştirilmiştir. İyon Kromotografi (IC) ve ICP-MS (Inductively Coupled Plasma Mass 8
 analizleri gerçekleştirilmiştir. Organik ve elemental karbon ölçümleri ise termal/optik karbon analiz cihazı ile yapılmıştır.")
16 Spectrometry) cihazları ile aerosol numunelerinde suda çözülebilen iyonların (Na +, NH 4 +, K +, Mg 2+, Ca 2+, Cl -, NO 3 -, SO 4 2-, C 2 O 4 2- ) ve iz metallerin (Al, Ca, Ti, V, Cr, Mn, Fe, Ni, Cu, Cd, Pb) analizleri gerçekleştirilmiştir. Organik ve elemental karbon ölçümleri ise termal/optik karbon analiz cihazı ile yapılmıştır. Analiz yöntemi ile ilgili detaylı bilgi bu araştırmayı yürüten her iki grubun daha önce yayınladıkları makalelerde sunulmuştur (KUBİLAY ve diğ., 22; KOÇAK ve diğ., 24b; KOÇAK ve diğ., 27a,b; SCIARE ve diğ., 28). Şekil 8. SESAME projesi kapsamında BİLİM II gemisi ile gerçekleştirilen araştırma seferlerinin rotası. Ayrıca MODIS uydusu verilerinden elde edilen AOT verileri her iki istasyon için kullanıma açık web sitesinden alınmıştır ( Her iki istasyonda NASA ile yürütülen işbirliği çerçevesinde güneş fotometresi ile yer seviyesinde aerosollerin optik kalınlığı ölçülmektedir. Bu ölçümler Şekil 4 de verilen AERONET isimli küresel ölçüm ağına dahil olup veriler kullanıcıya açıktır ( Şekil 9 da Erdemli istasyonunda bulunan AERONET ölçüm ağına ait güneş fotometresinin (CIMEL) fotoğrafı verilmiştir. Yer seviyesinde güneş fotometresi ile ölçülen aerosollerin optik özellikleri her iki grup tarafından yayınlanan makalelerde detaylı olarak tartışılmıştır (KUBİLAY ve diğ., 23; FOTIADI ve diğ., 26). Güneş fotometresi ile yer seviyesinde farklı dalga boylarındaki güneş ışınım miktarı ölçülmekte ve veriler uydu vasıtası ile NASA daki AERONET merkezine yollanmaktadır. Burada veriler işlenerek aerosollerin farklı dalga boylarındaki AOT leri, parçacık boyut dağılımı ve diğer optik özellikleri (single scattering albedo, refractive indices) türetilerek internet sitesinden kullanıcının kullanımına sunulmaktadır. Her iki istasyon için TOMS (Total Ozone Mapping Spectrometer) sensörünün verilerinden türetilen AOT verilerinin bölgeye Afrika kıtasından taşınan mineral tozun göstergesi olduğu daha önceki çalışmalarda gösterilmiştir (KUBİLAY ve diğ., 25; KALIVITIS ve diğ., 27). Bu her iki çalışmada da AERONET verilerinden türetilen AOT ler ile TOMS sensöründen üretilen AOT ler karşılaştırılarak uydu seviyesinden yapılan ölçümlerin güvenirliliği test edilmiştir. Küresel ölçüm ağı olan AERONET projesi kapsamında her iki istasyonda da güneş fotometresi olması ve bu verilerin proje kapsamında değerlendirilen 9
 aerosollerinin kimyasal ve optik özelliklerinin, zaman")
17 aerosollerin kimyasal komposizyonları ile birlikte incelenmesi doğu Akdeniz aerosollerinin iklimsel rolü ile ilgili bilimsel birikime katkı sağlayacaktır. İşbirliği yaptığımız Yunanlı grup ile daha önceki yapmış olduğumuz çalışmalar doğu Akdeniz de bulunan iki istasyonun (Erdemli, Finokalia) aerosollerinin kimyasal ve optik özelliklerinin, zaman içerisindeki değişiminin farklı olduğunu kanıtlamıştır (KUBİLAY ve diğ., 22; VREKOUSSIS ve diğ., 25). Şekil 9. Erdemli istasyonunda bulunan güneş fotometresi. 3. BULGULAR 3.1 Erdemli ve Finokalia İstasyonlarına ait 23 Yılı Verileri Tablo 1 de Doğu Akdeniz de bulunan Erdemli ve Finokalia istasyonlarından eş zamanlı toplanan aerosol örneklerinde ölçülen suda çözünebilir iyonların konsantrasyonları için istatistiksel özetler sunulmuştur. Suda çözülebilen iyonların deniz tuzundan kaynaklanmayan (non sea salt; nss) miktarı aşağıdaki şekilde hesaplanmıştır. nss-x = X Ölçülen - X denizsuyu Aerosol örneklerinde ölçülen Sodyum (Na) konsantrasyonunun tamamının deniz suyundan kaynaklandığı kabul edilerek nss fraksiyonu hesaplanacak iyonun deniz suyunda Na konsantrasyonuna sabit olan oranı kullanılarak deniz suyundan kaynaklanan konsantrasyon fraksiyonu (X denizsuyu ) hesaplanır. Daha sonra ölçülen toplam konsantrasyondan (X Ölçülen ) deniz suyuna ait fraksiyon çıkarılarak nss konsantrasyonu (nss-x) elde edilir. 1
18 Her iki istasyonda deniz kıyısında bulunduğu için aerosol numuneleri üzerinde deniz tuzu parçacıklarının katkısı vardır ve bu katkı diğer kaynakların toplam aerosol yükü üzerindeki etkisinin belirlenmesini engeller. Dolayısı ile sülfat (SO 4-2 ), potasyum (K + ) ve kalsiyum (Ca 2+ ) gibi deniz suyunda bolca bulunan iyonların toplam ölçülen konsantrasyonundan deniz tuzundan kaynaklanan fraksiyonunun çıkarılması gerekir. Ancak bu şekilde diğer kaynakların (antropojenik kaynakların) toplam aerosol konsantrasyonu üzerindeki katkısı gösterilebilinir. Tablo 1. Erdemli ve Finokalia dan eş zamanlı toplanan aerosol örneklerinde belirlenen suda çözülebilir iyon konsantrasyonlarına ait istatistiksel veriler. (Tablodaki tüm konsantrasyonlar µg m-3 cinsinden sunulmuştur). Ölçülen Aritmetik Standart Sapma Minimum Maksimu Ortanca İyonlar Ortalama m Erdemli Na Cl Mg K nssk NH NO SO nssso C 2 O Ca nssca Finokalia Na Cl Mg K nssk NH NO SO nssso C 2 O Ca nssca Tablodan da anlaşılacağı gibi suda çözülebilir iyonların konsantrasyonları örnekleme süresince büyük değişkenlik göstermektedir (minimum ve maksimum değerler, Tablo 1). Örneğin Erdemli istasyonunda nssca 2+ için gözlenen en düşük konsantrasyon.32 µg m -3 iken yaklaşık 3 katlık bir artış göstererek (8.69 µg m -3 ) örnekleme süresindeki en yüksek değerine ulaşmaktadır. Ayrıca, iki istasyon göz önüne alındığında suda çözülebilir iyon konsantrasyonlarında (deniz tuzları hariç: Na +, Cl - ve Mg 2+ ) iki istasyon arasında farklılık gözlenmektedir. Finokalia istasyonuna kıyasla Erdemli deki suda çözülebilir iyon konsantrasyonları yaklaşık 2 ve 3 kat daha yüksek gözlenmektedir. 11
19 Erdemli ve Finokalia için aerosol optik kalınlıkları (AOT) ve Angström katsayıları (44 nm ve 87 nm için verilen AOT lerden türetilen bir parametre olup aerosollerin parçacık boyutu hakkında bilgi verir) için istatistiksel özetler Tablo 2 de verilmiştir. Suda çözünebilir iyon konsantrasyonları gibi, her iki istasyonda gözlenen AOT ler ve Angström katsayıları örnekleme süresince büyük değişkenlik göstermektedir (minimum ve maksimum değerler, Tablo 2). Örnekleme boyunca Erdemli ve Finokalia için gözlenen aerosol optik kalınlıkların minimum değerleri 2-3 kat artarak maksimum değerlerine ulaşmaktadır. Genellikle Erdemli de belirlenen aerosol optik kalınlıklar Finokalia ile kıyaslandığı zaman yaklaşık % 3 daha yüksek gözlenmektedir. Buna karşılık, Angström katsayıları karşılaştırıldığında Erdemli de gözlenen değerler Finokalia ya değerlerinden yaklaşık % 15 daha düşük olduğu saptanmaktadır. Bu da Erdemli aerosollerinin büyük tanecik boyutuna sahip parçacıklar tarafından daha çok etkilendiğine işaret etmektedir. Tablo 2. Erdemli ve Finokalia istasyonlarında belirlenen aerosol optik kalınlıkları ve Angström katsayıları için istatistiksel özet. 1 ve 2 sırası ile yer ölçümleri (AERONET) ve uzaktan algılama (MODIS) yöntemlerini simgelemektedir. Aritmetik Ortalama Standart Sapma Minimum Maksimum Ortanca Erdemli AOT (55 nm) AOT (12 nm) AOT (87 nm) AOT (675 nm) AOT (5 nm) AOT (44 nm) Angström Katsayısı (44-87 nm) Finokalia AOT (55 nm) AOT (12 nm) AOT (87 nm) AOT (675 nm) AOT (5 nm) AOT (44 nm) Angström Katsayısı (44-87 nm) Mart-Mayıs ve Eylül-Ekim 28 Dönemlerinde Deniz Seferlerine Ait Veriler Tablo 3(a-c) de sırası ile Mart-Mayıs 28 (Sefer-I), Eylül-Ekim 28 Seferlerinde (Sefer-II) ve Erdemli istasyonundan toplanan aerosol örneklerinde ölçülen PM 1, iz metallerin ve suda çözünebilir iyonların konsantrasyonları için istatistiksel özetler sunulmuştur. Tablolardan da görüleceği gibi PM 1, iz metallerin ve suda çözülebilir iyonların konsantrasyonları büyük değişiklikler göstermektedir. En yüksek ortalama PM 1 ve toprak kaynaklı metallerin konsantrasyonları (Al, Fe, Ti, Mn ve Ca) Sefer-I süresince gözlenirken en düşük PM 1, nssso 4 2-, NO 3 -, OC ve EC değerleri Sefer-II de gözlenmektedir. Diğer yandan en yüksek deniz tuzu konsantrasyonları (Na +, Cl - ve Mg 2+ ) Erdemli istasyonunda gözlenmektedir. 12
20 Doğu Akdeniz ilkbahar aylarında yoğun olarak Afrika kıtasından atmosfer ile taşınan çöl tozlarına maruz kalmaktadır (KUBİLAY ve diğ., 23; 25; KALIVITIS ve diğ., 27). PM 1 konsantrasyonlarının bu dönemde yükselmesinin nedeni bölgeye atmosferik taşınımla ulaşan çöl tozlarının etkisidir. Toz taşınım dönemlerinde AOT değerleri en yüksek seviyelerine ulaşırken Angström Katsayıları ise en düşük seviyelerine ulaşır (KUBİLAY ve diğ., 23; FOTIADI ve diğ., 26). Bu dönemde toprak kaynaklı elementlerin (Al, Fe, Ti, Mn) ve iyonların (nss-ca 2+ ) konsantrasyonlarıda pik seviyelerine ulaşır. Tablo 3a. Mart-Mayıs 28 döneminde gerçekleştirilen deniz seferinde toplanan aerosol numunelerine ait PM 1, iz metaller, suda çözülebilir iyonlar ile organik karbon (OC) ve elemental karbon (EC) konsantrasyonlarına ait istatistiksel bilgiler (Sefer rotası Şekil 8 de sunulmuştur). PM 1 konsantrasyonları μg m -3, diğer aerosol bileşenlerinin konsantrasyonları ise ng m -3 cinsinden sunulmuştur. Aritmeti k Ortalama Standart Sapma Minimum Maksimum Ortanc a PM Al Fe Ti Mn Ca Cr V Ni Cu Cd Pb Na Cl Mg nss Mg K nss K Ca nss Ca nss SO NO C 2 O OC EC NH 4 2- SO 4 Tablo 3 de verilen PM 1 konsantrasyonları daha önce Erdemli istasyonunda gerçekleştirilen bir yıllık örnekleme sonucunda elde edilen ortalama PM 1 konsantrasyonu olan 36.4±27.8 μg m -3 ile uyumludur (KOÇAK ve diğ., 27a). Ayrıca Tabloda verilen PM 1 konsantrasyonları SMOLIK ve diğ., (23) tarafından Girit adasındaki Finokalia istasyonu için rapor edilen değerlerle de uyumlu olup doğu Akdeniz atmosferini temsil etmektedir. Öte yandan Akdeniz 13
21 kıyısında bulunan Beyrut şehri için PM 1 konsantrasyonu yıllık ortalaması 84±27 μg m -3 gözlenmiştir (KOUYOUMDJIAN and SALIBA, 25). Beyrut ta gözlenen yüksek konsantrasyon şehrin lokal emisyonları ile açıklanmıştır. Tablo 3b. Eylül-Ekim 28 döneminde gerçekleştirilen deniz seferinde toplanan aerosol numunelerine ait PM 1, iz metaller, suda çözülebilir iyonlar ile organik karbon (OC) ve elemental karbon (EC) konsantrasyonlarına ait istatistiksel bilgiler (Sefer rotası Şekil 8 de sunulmuştur). PM 1 konsantrasyonları μg m -3, diğer aerosol bileşenlerinin konsantrasyonları ise ng m -3 cinsinden sunulmuştur. Aritmeti kortalam a Standart Sapma Minimum Maksimum Ortanc a PM Al Fe Ti Mn Ca Cr V Ni Cu Cd Pb Na Cl Mg nss Mg K nss K Ca nss Ca nss SO NO C 2 O OC EC NH 4 2- SO 4 Eylül-Ekim 28 döneminde eş zamanlı olarak deniz seferinde ve kıyıda (Erdemli de) bulunan atmosfer örneklemesi kulesinden gerçekleştirilen aerosol örneklemesi ile kıyıdan yapılan örneklemenin deniz atmosferindeki durumu temsil ettiği gösterilmiştir. Erdemli istasyonunda gözlenen konsantrasyonlar Akdeniz kıyısında bulunan Beyrut şehrine ait konsantrasyonlardan çok düşük olup Erdemli istasyonunun verilerinin Girit adasında bulunan Finokalia istasyonu verileri ile göstermiş olduğu uyum dolayısı ile doğu Akdeniz atmosferini temsil ettiğini kabul edilinebilinir. 14
22 Finokalia istasyonu için elemental karbon (EC) ve organik karbon (OC) mart-mayıs dönemi için sırası ile 34 ve 176, eylül ekim dönemi için ise 37 ve 1915 ng m -3 olarak rapor edilmiştir (SCIARE ve diğ., 28). Finokalia için verilen değerler uzun dönemli gözleme ait olduğu için bu verilerin Tablo 3de ortanca konsantrasyonlar ile karşılaştırılması daha uygun olur. Tablo 3c. Eylül-Ekim 28 döneminde Erdemli de toplanan aerosol numunelerine ait PM 1, iz metaller, suda çözülebilir iyonlar ile organik karbon (OC) ve elemental karbon (EC) konsantrasyonlarına ait istatistiksel bilgiler. PM 1 konsantrasyonları μg m -3, diğer aerosol bileşenlerinin konsantrasyonları ise ng m -3 cinsinden sunulmuştur. Aritmeti k Ortalama Standart Sapma Minimum Maksimum Ortanc a PM Al Fe Ti Mn Ca Cr V Ni Cu Cd Pb Na Cl Mg nss Mg K nss K Ca nss Ca nss SO NO C 2 O OC EC NH 4 2- SO 4 15
23 4.TARTIŞMA Yılına Ait Verilerin Değerlendirilmesi Her iki istasyondan toplanan aerosol örneklerinde analizleri gerçekleştirilen suda çözünebilir iyonların aylık ortalama derişimleri Şekil 1 da sunulmuştur. Mevsimsel zaman serileri aerosol popülasyonuna tesir eden etmenler hakkında bilgi vermektedir. Bu etmenler: kaynak emisyonundaki zamansal değişimler; atmosferik taşınım yolunda değişim, gazdan partiküle değişme oranları ve aerosollerin mevsimlere bağlı olarak atmosferden uzaklaştırılmaları olarak sıralanabilir Şekil 1 da görüldüğü üzere suda çözünebilir iyonlar bariz bir mevsimsel salınım sergilemektedirler. Bu iyonlar kabaca üç ana gruba ayrılabilir: 1) Deniz tuzu kaynaklı iyonlar: Bu iyonların (Na +, Cl -, Mg 2+, Br - ; Şekil 1a,b,c,d) kış (Ocak, Şubat, Aralık) aylarında şiddetli rüzgarlar nedeni ile deniz yüzeyinden deniz tuzu parçacıklarının oluşumunun artmasıyla ortalama derişimleri en yüksek değerlerine ulaşırken yaz aylarında ise en düşük değerlerine inmektedir. 2) İkincil aerosoller: Bu iyonlar (nssso 4 2-, NO 3 -, NH 4 + ;C 2 O 4 2- ; Şekil 1g, h, i, j) olup en yüksek değerlerini yaz aylarında gösterirken (Haziran, Temmuz, Ağustos) en düşük derişimleri kış aylarında belirlenmektedir. Kış aylarında gözlenen düşük derişimler özellikle bu iyonların yağışlarla atmosferden uzaklaştırılmasına bağlanabilir. Diğer yandan, yaz aylarında gözlenen yüksek konsantrasyonlar etkisiz yaş çökelmenin bu iyonların atmosferde birikmesine olanak tanıması ve yaz koşullarının (yüksek radyasyon ve sıcaklık) bu iyonların gazdan partiküle dönüşümünü arttırmasına atfedilebilir. 3) nssca 2+ ve nssk + : Bu iyonlar (Şekil 1e, f) diğer iki gruba göre daha düzensiz bir mevsimsel dağılım göstermektedir. Toprak kökenli nssca 2+ etkili yağışlara rağmen geçiş mevsimlerinde (Nisan, Mayıs ve Ekim) ve Kasımda Kuzey Afrika (Büyük Sahra Çölü) ve Ortadoğu (Arab Çölü) çöllerinden bölgeye taşınmakta olan episodik mineral toz nedeniyle en yüksek konsantrasyonlarını sergilemektedir. nssk + ise hem bölgeye mineral toz taşınması nedeniyle hem de biyokütle yangınları nedeniyle geçiş ve yaz mevsimlerinde en yüksek derişimlerine ulaşmaktadır. Tüm örnekleme boyunca nssca 2+ Erdemli de en yüksek değerini 3 (nssca 2+ =1.1 µg m -3 ), 4 (nssca 2+ =8. µg m -3 ), 5 (nssca 2+ =11.9 µg m -3 ) Nisan 23 zaman aralığında göstermektedir. Aynı günler için nssk + derişimleri sırası ile.35,.52,.65 µg m -3 olarak gözlemlenmiştir. Buna ek olarak Erdemli deki aerosol optik kalınlığın bu tarihler arasında en yüksek değerlerine ulaştığı belirlenmiştir (3, 4, 5 Nisan değerleri sırası ile.61, 1.9 ve 1.44). Şekil 11 de 4 Nisan 23 tarihine karşılık gelen 3 günlük geri yörüngeler (1, 85, 7, 5 hpa), TOMS (Aerosol Index) ve MODIS uydu resimleriyle birlikte sunulmuştur. Tüm geri yörüngeler (1 hpa hariç; Şekil 11a) Erdemli ye ulaşan hava kütlelerinin Sahra dan etkilendiğini göstermektedir. TOMS dan elde edilen uydu görüntüleri (Şekil 11b) toz bulutunun Mısır üzerinden başlayıp Doğu Akdeniz basenine yayıldığının ve bu bölge üzerinde Aerosol Index değerinin 3 civarlarında değerlere ulaştığı gözlenmektedir. 16
24 NH 4 + (µg m -3 ) nssso4 2- (µg m -3 ) nssca 2+ (µg m -3 ) Mg 2+ (µg m -3 ) Na + (µg m -3 ) Erdemli Finokalia Erdemli Finokalia 12 (a) (b) OSMNMHTAEEKA OSMNMHTAEEKA (c) OSMNMHTAEEKA (e) OSMNMHTAEEKA (g) OSMNMHTAEEKA (i) OSMNMHTAEEKA C 2 O 4 2- (µg m -3 ) NO3 - (µg m -3 ) nssk + (µg m -3 ) Br - (µg m -3 ) Cl - (µg m -3 ).3 (d).2.1. OSMNMHTAEEKA.6 (f).4.2. OSMNMHTAEEKA 8 (h) OSMNMHTAEEKA.8 (j) OSMNMHTAEEKA Şekil 1. Erdemli ve Finokalia istasyonları atmosferine ait aerosollerin suda çözülebilir iyonların mevsimsel zaman serileri (a) Na + ; (b) Cl - ; (c) Mg 2+ ; (d) Br - ; (e) nssca 2+ ; (f) nssk + ; (g) nssso 4 2- ; (h) NO 3 - ; (i) NH 4 + ve (j) C 2 O
 tarihleri süresince toplanan örnekte gözlenmektedir.")

25 Ayrıca MODIS uydu resmi Mısır kaynaklı toz bulutunun Doğu Akdeniz bölgesine nüfuz ettiğini doğrulamaktadır. Finokalia da ise nssca 2+ en yüksek değerlerinden biri Mayıs 23 (nssca 2+ =2.2 µg m -3 ) tarihleri süresince toplanan örnekte gözlenmektedir. Bu tarihler arasında elde edilen kompozit TOMS Aerosol Index i (Şekil 12) örnekleme istasyonun Sahra kökenli toz bulutunun etkisi altında olduğunu desteklemektedir. Her iki istasyona taşınan çöl tozlarının aerosollerin kimyasal komposizyonunda ve optik özelliklerinde ani değişikliklere neden olduğu her iki grubun önceki yayınlarında da gösterilmiştir (KOÇAK ve diğ., 24a,b; 27a, b; KALIVITS ve diğ., 27; SMOLIK ve diğ., 23; VREKOUSSIS ve diğ., 25). Doğu Akdeniz in partikül madde yükü açısından diğer bölgelere nispeten daha yüklü olması bu tozlardan kaynaklanmaktadır. İnsan sağılığı üzerindeki olumsuz etkisi nedeni ile AB Komisyonu üye ülkeler için PM 1 yönetmeliği hazırlamıştır. Bu yönetmeliğe istinaden yıllık ortalama PM 1 konsantrasyonunun 2 µg m -3 olacak şekilde emisyonların aşağı çekilmesi istenmektedir. Ancak doğu Akdeniz gibi doğal kaynaklardan (çöl tozu ve deniz tuzu parçacıkları) atmosfer ile taşınan parçacıklara maruz kalan bölgelerde bu yönetmeliğe uyulması mümkün değildir. Bu durum aerosollerin kaynaklarının tespit edilmesinin önemini çok güzel vurgulamaktadır (KOÇAK ve diğ., 27a). Şekil Nisan 23 tarihine ait Erdemli için (a) geri yörüngeler, (b) TOMS Aerosol Index (AI) ve (c) MODIS uydu resmi. 18
 iki iyonun ortak bir kaynaktan geldiği, (b) benzer oluşum mekanizmasına sahip olduğu (c) aralarında tepkime")
26 Şekil Mayıs 23 tarihine ait kompozit TOMS Aerosol Index (AI). Suda çözünebilir iyonlar arasındaki istatistiksel karşılıklı bağıntı kullanılarak; (a) iki iyonun ortak bir kaynaktan geldiği, (b) benzer oluşum mekanizmasına sahip olduğu (c) aralarında tepkime olduğu ve/veya benzer atmosferik taşınım biçimine sahip olduğu hakkında bilgi edinilebilmektedir. Tablo 4a,b Erdemli ve Finokalia istasyonlarından elde edilen suda çözünebilir iyonlar arasındaki bağıntıların korelasyon katsayıları birer matris halinde göstermektedir. Suda çözünebilir iyonlar arasındaki bağıntılar şu şekilde ifade edilebilir; (a) zayıf korelasyon (r=-.4); (b) orta derecede korelasyon (r=.4-.7) ve (c) kuvvetli korelasyon (r=.7-1.). Beklendiği üzere her iki istasyonda da deniz tuzu kaynaklı iyonlar (Na +, Cl -, Mg 2+, Br - ) kendi aralarında kuvvetli bir korelasyon göstermektedir (r>.9) ve ortak bir oluşum mekanizmasına işaret etmektedirler. Erdemli istasyonunda ikincil aerosoller (nssso 2-4, NO - 3, NH + 4 ;C 2 O 2-4 ; Tablo 4a) kendi aralarında kuvvetli bir korelasyon gösterirken 2- Finokalia da C 2 O 4 ve nssso 2-4, NO - 3, NH + 4 iyonları bir ilişki sergilememektedir. Tablo 4b den de anlaşılacağı üzere oksalat iyonu (C 2 O 2-4 ) deniz tuzundan kaynaklanan iyonlarla güçlü bir bağıntı gösterirken toprak orijinli nssca 2+ ile orta derece bir korelasyon vermektedir. Bu ilişkiler de oksalat iyonun bazik olan deniz tuzu katyonları ve nssca 2+ katyonu ile partikül-partikül tepkimesini veya oksalatın öncü gazının bu bazik katyonlar üzerinde partikül oluşturmasına işaret etmektedir. Ayrıca toprak orijinli nssca 2+ ile oksalat ilişkisine bakılarak, oksalatın en azından bir kısmının toprak kökenli olabileceği de söylenebilir. nssca 2+ Erdemli de nssk + ile orta şiddette bir korelasyon gösterirken Finokalia da Mg 2+ ile bu bağıntıyı göstermektedir. Bu suda çözülebilir iyonların nssca 2+ ile korelasyonlarına bakarak gözlenen konsantrasyonlarının bir kısmının topraktan kaynaklandığı ileri sürülebilir. 19
27 Tablo 4. Suda çözünebilir iyonlar arasındaki karşılıklı bağıntı (a) Erdemli ve (b) Finokalia. Kuvvetli korelasyon katsayıları gri ile vurgulanmıştır. (a) Erdemli Na + Cl - Mg 2+ Br - nssca 2+ nssk + nssso NO 3 + NH 4 2- C 2 O 4 Na + 1. Cl Mg Br nssca nssk nssso NO NH C 2 O (b) Finokalia Na + Cl - Mg 2+ nssca 2+ nssk + nssso NO 3 + NH 4 2- C 2 O 4 Na + 1. Cl Mg nssca nssk nssso NO NH C 2 O
28 4.2. Aerosollerin 23 Yılına Ait Optik Özellikleri Her iki istasyon için türetilen aerosol optik kalınlıkların (AERONET: 44, 87 ve 12 nm, MODIS: 55 nm) ve Angström katsayıların (α ) aylık ortalamaları Şekil 13 de sunulmuştur. Aerosol Optik Kalinlik Aerosol Optik Kalinlik (a) Erdemli AERONET OSMNMHTAEEKA (c) Erdemli AERONET 44 nm 87 nm 12 nm OSMNMHTAEEKA Aerosol Optik Kalinlik Aerosol Optik Kalinlik (b) Finokalia AERONET OSMNMHTAEEKA (d) Finokalia AERONET 44 nm 87 nm 12 nm OSMNMHTAEEKA (e) Erdemli MODIS OSMNMHTAEEKA.4 55 nm 55 nm (f) Finokalia MODIS OSMNMHTAEEKA Şekil 13. Erdemli ve Finokalia istasyonları için türetilen aerosol optik kalınlıkların (AERONET: 44, 87 ve 12 nm, MODIS: 55 nm) ve angström katsayıların (α ) aylık ortalamaları. Her iki istasyonda da aerosol optik kalınlıklar en düşük değerlerini kış aylarında göstermektedir. Erdemli de AOT 44 en yüksek ortalamalarını yazın ve Eylül-Ekim aylarında göstermekteyken Finokalia da en yüksek değerlerini ilk-bahar ve yazın göstermektedir. AOT 87 ve AOT 12 Erdemli de Nisan-Mayıs-Haziran aylarında yüksekken yaz ortalarına 21
29 doğru düşme eğilimi gösterip Eylül-Ekim aylarında tekrar yükselmektedir. Finokalia istasyonunda ise en yüksek ortalamaları ilk bahar ve Ekim de belirlenmektedir. MODIS ten elde edilen AOT 55 ortalamaları ise Nisan ayında Erdemli de, Mart-Nisan aylarında Finokalia da en yüksek değerini göstermektedir. Buna ek olarak, Angström katsayılarının en düşük değerleri Nisan-Mayıs ve Ekim-Aralık dönemlerinde belirlenmiştir. Farklı dalga boylarındaki aerosol optik kalınlıklarında ve angström katsayılarında gözlenen mevsimsel döngüler, Doğu Akdeniz üzerinde farklı kimyasal kompozisyona ve partikül boyuna sahip aerosollerin varlığına işaret etmektedir. Örneğin, yazın gözlenen yüksek AOT 44 ve angström katsayıları (Erdemli:~1.2, Finokalia: ~1.5) belirlenen aerosol optik kalınlığın özellikle küçük boy dağılımı gösteren partiküllerden kaynaklandığına işaret etmektedir. Diğer taraftan Nisan- Mayıs aylarında gözlenen yüksek AOT 87 (ve AOT 12 ) ve düşük angström katsayıları (Erdemli:~.7, Finokalai: ~.9) belirlenen aerosol optik kalınlığın daha çok büyük boy dağılımı gösteren partiküllerden kaynaklandığını göstermektedir. Şekil 14 her iki istasyon için elde edilmiş AERONET (5 nm) ve MODIS (55 nm) optik kalınlıklarının arasında ilişki sunulmuştur. Şekillerden de görüldüğü gibi her iki istasyon için elde edilen eğimler 1 değerinden farklıdır. Erdemli de bu eğim.84 iken Finokalia da.51 olarak tespit edilmiştir. Bu verilerde MODIS in AERONET e göre Erdemli istasyonu için % 16 daha fazla aerosol kalınlık verirken Finokalia için nerdeyse 2 kat fark gözlenmektedir. Ancak güvenlik çizgileri dikkate alındığında elde edilen verilerin Erdemli ve Finokalia için sırası ile % 91 i ve % 86 sı bu koşulu sağlamaktadır. AOT5 (AERONET) (a) y =.84x +.47 r = AOT 55 (MODIS-Erdemli) AOT5 (AERONET) (b) y =.51x +.81 r = AOT 55 (MODIS-Finokalia) Şekil 14. MODIS Aerosol optik kalınlıkları ile AERONET aerosol optik kalınlıklarının (AOT) karşılaştırılması. (a) Erdemli ve (b) Finokalia. Siyah çizgiler regresyon eğrilerini ve kesikli çizgiler regresyon eğrisinden MODIS AOT ye karşılık gelen teorik değerlere MODIS AOT nin standart sapmasının (Erdemli: %5 ve Finokalia: %56) eklenip ve değerlerden çıkarılarak hesaplanan rakamlara karşılık gelmektedir. Bu çizgilerin dışında kalan değerler her iki istasyon için veri setlerinden çıkarıldığında MODIS ve AERONET optik kalınlıkları arasındaki ilişki Şekil 15 deki gibi gözlenmektedir. Her iki istasyon için MODIS ve AERONET aerosol optik kalınlıkları arasındaki eğim ve korelasyon katsayıları (r değeri Erdemli için.75 ten.86 ya, Finokalia için ise.69 dan.81 e çıkmıştır) belirgin bir artış göstermektedir. Erdemli için AERONET/MODIS eğimi.91 e çıkarken bu oran Finokalia için ancak.65 e tekabül etmektedir. 22
30 AOT5 (AERONET ) (a) y =.91x +.29 r =.86 AOT5 (AERONET ) (b) y =.65x +.51 r = AOT55 (MODIS-Erdemli) AOT55 (MODIS-Finokalia) Şekil 15. MODIS Aerosol optik kalınlıkları ile AERONET aerosol optik kalınlıklarının karşılaştırılması. (a) Erdemli ve (b) Finokalia Suda Çözünebilir İyonlar ile Aerosol Optik Kalınlıklar ve Angström Katsayısı Arasındaki İlişkiler 1) Deniz tuzu kaynaklı iyonlar: Her iki istasyonda da deniz tuzu kaynaklı suda çözünebilir iyonlarla (Na +, Cl -, Mg 2+, Br - ) aerosol optik kalınlıklar ve angström katsayıları arasında tüm veri seti için her hangi bir bağıntı bulunamamıştır. Diğer taraftan, kış mevsimi süresince Erdemli istasyonunda bu iyonlar AOT 12 ile orta şiddette bir korelasyon gösterirken (r~.67) ve angström katsayısı arasında negatif bir bağıntı (r~-.63) gözlenmiştir. Bu ilişkilere bakarak kış mevsiminde aerosol optik kalınlığın büyük boy dağılımı gösteren (angström katsayısı arasında negatif bağıntı r~-.63) deniz tuzu kaynaklı iyonlar tarafından etkilendiği ileri sürülebilir. 2) İkincil aerosoller: Bu iyonlar (nssso 2-4, NO - 3, NH + 4 ;C 2 O 2-4 ) her iki istasyonda da AOT ile orta şiddette ve kuvvetli korelasyon göstermektedir. Şekil 16 her iki istasyonda nssso 4 2- ve AOT 44 arasındaki ilişkiyi göstermektedir. Şekilden de görüldüğü üzere nssso 4 ve AOT 44 Erdemli de kuvvetli bir korelasyon gösterirken Finokalia da ise orta kuvvette bir korelasyon sergilemektedir. Bu veriler ışığında Doğu Akdeniz atmosferinde gözlenen aerosol optik kalınlıkların yıl boyunca ikincil aerosollerden etkilendiği söylenebilir (a) Erdemli r=.74.6 (b) Finokalia r=.56 AOT AOT nssso 2-4 (µg m -3 ) nssso4 2- (µg m -3 ) Şekil 16. nssso 2-4 ve AOT 44 arasındaki bağıntı. (a) Erdemli ve (b) Finokalaia 23
31 3) nssca 2+ : Toprak kaynaklı olan nssca 2+ ile AOT 44 arasında tüm yıl boyunca (AOT 12 ve AOT 87 ) net bir ilişki gözlenmezken özellikle Mart, Nisan ve Mayıs aylarında AOT 12 ile orta şiddette bir korelasyon (r~.6) gösterdiği tespit edilmiştir. Ayrıca her iki istasyonda da bu iyonla angström katsayısı arasında orta şiddette negatif (r~-.6) bir bağıntı olduğu gözlenmiştir. Özellikle bu dönemde bölgede gözlenen nssca 2+ iyon derişimleri Sahra kökenli mineral tozu taşınımından etkilenmektedir. Dolayısı ile bahsi geçen aylarda Doğu Akdeniz basenindeki iki istasyonda gözlenen aerosol optik kalınlıklarının büyük boy dağılımı (nssca 2+ ve angström katsayısı arasındaki negatif ilişki) gösteren mineral tozundan etkilendiği öne sürülebilir Mart-Mayıs ve Eylül-Ekim 28 Yılana Ait Verilerin Değerlendirilmesi ODTÜ-DBE ye ait araştırma gemisi Bilim II ile yapılan seferler ve Erdemli den elde edilen PM 1, iz metallerin ve suda çözünebilen iyonların ortalama konsantrasyonları Finokalia istasyonundan elde edilen literatür verileriyle karşılaştırılmak üzere Tablo 5 te sunulmuştur. Tablo 5. Sefer-I,II ve Erdemli de elde edilen verilerin Finokalia verileri ile karşılaştırılması. PM 1 konsantrasyonları μg m -3, diğer aerosol bileşenlerinin konsantrasyonları ise ng m -3 cinsinden sunulmuştur. * SMOLIK ve diğ., (23); BARDOUKI ve diğ., (23); # SCIARE ve diğ., (28). Sefer-I Sefer-II Erdemli Finokalia- Finokalia-Kış Yaz PM * 14* Al * 99* Fe * 34* Ti * 2* Mn * 1* Ca Cr * - V * 3* Ni * 2* Cu * 1* Cd Pb * Na Cl Mg nss Mg K nss K Ca nss Ca NH SO nss SO NO C 2 O OC # 113 # EC # 18 # En yüksek PM 1 değeri Sefer-I de gözlenmiş ve Finokalia istasyonunda yaz ve kış döneminde gözlenen konsantrasyonlardan sırası ile 1.2 ve 2.7 kat daha yüksektir. Toprak kökenli iz metaller (özellikle Al, Fe ve Mn) en yüzsek ortalama değerlerini Sefer-I süresince gösterirken Finokalia istasyonunda gözlenen konsantrasyonlardan 3 ile 2 kat fazla olarak belirlenmiştir. 24
32 İnsan kaynaklı kurşun en yüksek değerini Sefer-I de gösterirken, Sefer-II ve Erdemli de gözlenen konsantrasyonlar Finokalia da gözlenen değerden yaklaşık 25 % daha azdır. Deniz tuzundan kaynaklanan suda çözünebilir iyonlar (Na +, Cl - ve Mg 2+ ) Sefer-I, II süresince hemen hemen aynı seviyelerde gözlenirken Finokalia ve Erdemli istasyonunda belirlenen değerlerden yaklaşık 5 % daha azdır. Sefer-I,II ve Erdemli istasyonunda gözlenen nssso 4 2- değerleri Finokalia da yazın gözlenen değerden yaklaşın 6 ile 3 kat daha azdır ancak Sefer- I,II de belirlenen değerler Erdemli de ve kışın Finokalia da gözlenen konsantrasyonlardan yaklaşık 2 kat azdır. Amonyum değerleri seferler süresince ve Erdemli de Finokalia da gözlenen değerlere kıyasla 2 ile 5 kat daha azdır. Seferlerde ve Erdemli de gözlenen nitrat değerleri Finokalia da kışın gözlenen değerle mukayese edilebilirken Finokalia istasyonunda yazın gözlenen değerden 2 kat daha düşüktür. Elemental karbon (EC) değerleri seferler süresince ve Erdemli de Finokalia ya kıyasla 2-3 kat daha yüksek gözlenirken, organik karbon miktarları Finokalia da kışın gözlenen değerlerden yaklaşık 2 kat yüksek ve yazın belirlenen değerle mukayese edilebilir düzeydedir. Şekil 17 de gözlenen PM 1 konsantrasyonlarına kaynakların göreceli katkısını göstermektedir. Mineral tozun katkısının en yüksek gözlendiği dönem Sefer-I olarak belirlenmiştir. Gözlenen PM 1 konsantrasyonun yaklaşık %6 ı mineral tozdan kaynaklanmaktadır. Mineral toz olaylarını belirlemek üzere Fe için 5 ng m -3 değeri, OMI- AI (Ozone Monitoring Instrument Aerosol Index) ve 3 günlük hava kütlelerinin geri yörüngeleri kullanılmıştır. İncelemeler sonucu Mart-Mayıs 28 döneminde toplanan 37 örneğin 18 inin (49 %) mineral tozlu günlere denk düştüğü gözlemlenmiştir. Bu toz olaylarının 1 gün ile 1 hafta aralığında sürebildiği belirlenmiş ve en yüksek toz olayı 29 Nisan ile 1 Mayıs süresince gözlemlenmiştir (3 gün; ortalama Fe ~ 14 ng m -3 ). Diğer yandan 1 Nisan ile 13 Nisan tarihleri arasında ortalama 13 ng m -3 Fe konsantrasyonuyla 4 gün süren ikinci en yüksek toz olayı gözlemlenmiştir. Şekil 18 de 11 Nisan 28 tarihi için elde edilen 3 günlük hava kütlelerinin geri yörüngelerini ve OMI-AI değerlerini göstermektedir. Tüm geri yörüngeler (1 m, 2 m ve 3 m; Şekil 18b) Çanakkale yakınlarında Bilim II gemisine ulaşan hava kütlelerinin Sahra dan etkilendiğini göstermektedir. OMI den elde edilen uydu görüntüleri (Şekil 18a) toz bulutunun özellikle Mısır üzerinden başlayıp Ege basenine yayıldığı ve bu bölge üzerinde Aerosol Index in 3 değerinin üzerine çıktığı gözlenmektedir. En düşük deniz tuzu katkısı seferler (6-1 %) süresince tespit edilmiştir. En yüksek katkı ise beklendiği gibi kışın Finokalia (28 %) istasyonunda gözlenmektedir. Diğer yandan Sefer-II ve Erdemli de yürütülen eş zamanlı örneklemeler göz önüne alınıp bir kıyaslama yapıldığında Erdemli deki deniz tuzu katkısının Sefer-II ye kıyasla 2 kat fazla olduğu gözlemlenmiştir. Bunun nedeni ise kıyı bölgelerindeki istasyonların özellikle dalgaların sahil şeritlerinde kırılması sonucu deniz tuzu üretiminin artmasından etkilenmesine bağlanabilir. Diğer yandan iyonik kütlenin PM 1 katkısı Sefer-I, II ve Erdemli için mukayese edilebilir seviyelerdedir (12-18 %). Özellikle ikincil aerosollerden kaynaklanan iyonik kütlenin katkısı Finokalia istasyonunda yaklaşık 2 kat daha yüksek tespit edilmiştir (32-37 %). 25
33 Sefer-I Sefer-II Erdemli Finokalia-Y EC (%) OC (%) IK (%) DT (%) MT (%) Finokalia-K Şekil 17. Gözlenen PM 1 konsantrasyonlarına kaynakların göreceli katkısı. MT: Mineral Toz; DT: Deniz Tuzu; IK: İyonik Kütle; OC: Organik Karbon; EC: Elemental Karbon. Organik karbonun PM 1 konsantrasyonuna katkısı Sefer-II ve Erdemli istasyonunda diğer örneklemelere oranla 3 % kadar daha yüksek gözlemlenirken, elemental karbon seferlerde ve Erdemli de Finokalia ya oranla 2 kat fazla olarak belirlenmiştir. 26
 ve 3 günlük")
34 (a) (b) Şekil Nisan 28 gününe ait OMI-Aerosol Index (a) ve 3 günlük hava kütlelerinin geri yörüngeleri (b). 27
35 5. ÖNERİLER 198 lerin başında oşinografik seferler süresince araştırma gemileri üzerinde gerçekleştiren ilk aerosol ölçümleri Akdeniz in kıyıdan uzak açık deniz üzerindeki aerosol yoğunluğunun değişik karasal kaynakların emisyonları ile kontrol edilmekte olduğunu göstermiştir. Ayrıca bu araştırmalar sonucunda Akdeniz atmosferindeki aerosol konsantrasyonlarının zaman içerisinde çok büyük değişim göstermekte olduğu için kesintisiz ölçüm programları ile izlenmesinin gereği vurgulanmıştır. İzleyen dönemde aerosollerin kimyasal komposizyonunun ve optik özelliklerinin yer ve uzay seviyesinde gerçekleştirilen uzaktan algılama ölçümleri ile belirlenebilir olması ile Akdeniz aerosollerinin zaman ve uzay ölçeğindeki değişkenliği gözlenebilmiştir. Uzaktan algılama verilerinin güvenirliliğinin test edilmesi amacı ile yer seviyesinde gerçekleştirilen ölçümlere halen ihtiyaç vardır ve bu ölçümlerin devam ettirilmesi gerekmektedir. Aerosol iklim etkileşimleri tüm dünyada bölgesel ölçekte yoğun ölçüm kampanyaları ile araştırılmış olmasına rağmen Akdeniz bölgesi göreceli olarak ihmal edilmiştir. Akdeniz bölgesinde aerosollerin çevresel etkilerinin (denizel biyojeokimya döngüleri üzerindeki ve hava kalitesi gibi) tanımlanması ve gösterilmesi gerekmektedir. Bu tür araştırmalarda bölgesel uluslarası işbirlikleri kurularak farklı noktalardan eşzamanlı ölçümler yapılması ve karşılıklı veri ve bilgi alışverişinde bulunulması elzemdir. 28
36 6.REFERANSLAR BARDOUKI, H., Liakakou, H., Economou, C., Sciare, J., Smolik, J., Zdimal, V., Eleftheriadis, K., Lazaridis, M., Dye, C., Mihalopoulos, N., Chemical Composition of Sizeresolved Atmospheric Aerosols in the Eastern Mediterranean During Summer and Winter. Atmospheric Environment, 37, , (23). BARNABA F.,Gobbi G.B.,. Aerosol Seasonal Variability Over the Mediterranean Region and Relative Impact of Maritime, Continental and Saharan Dust Particles Over the Basin from MODIS Data in the Year 21, Atmospheric Chemistry and Physics Discussions, 4, , (24). CRUTZEN P.J., Ramanathan V., Anderson T.L., Charlson R.J., Schwartz S.E., Knutti R., Boucher O., Rodhe H., Heintzenberg J., The Parasol Effect on Climate, Science, 32, , (23). DUCE R.A. ve diğ., Impacts of Atmospheric Anthropogenic Nitrogen on the Open Ocean, Science, 32, , (28). FOTIADI A., Hatzianastassiou N., Drakakis E., Matsoukas C., Pavlakis K.G., Hatzidimitron D., Gerasopoulos E., Mihalopoulos N., Vardavas I., Aerosol Physical and Optical Properties in the Eastern Mediterranean Basin, Crete, from Aerosol Robotic Network Data, Atmospheric Chemistry and Physics, 6, , (26). HATZIANASTASSIOU, N., Katsoulis, B., Vardavas, I., Global Distribution of Aerosol Direct Radiative Forcing in the Ultraviolet and Visible Arising Under Clear Skies, Tellus, 56B, 51-71, (24). IPCC, 21, Climate Change 21, ed: The Scientific Basis, Houghton J.T., DingY., Griggs D.J., Noguer M., van der Linden P.J., Dai X., Maskell K., Johnson C.A., Cambridge University Press, Cambridge, UK; New York, USA, (21). Pp JICKELLS, T. D., ve diğ., Global Iron Connections Between Desert Dust, Ocean Biogeochemistry, and Climate, Science, 38, 67-71, (25). KALIVITIS, N., Gerasopoulos, E., Vrekoussis, M., Kouvarakis, G., Kubilay, N., Hatzianastassiou, N., Vardavas, I., Mihalopoulos, N., Dust Transport over the Eastern Mediterranean Derived From Total Ozone Mapping Spectrometer, Aerosol Robotic Network, and Surface Measurements, Journal of Geophsical Research, 112, D322, doi:1.129/26jd751, (27). KAUFMAN Y. J., Tanre D., Boucher, O., A Satellite View of Aerosols in the Climate System, Nature, 419, , (22). KOÇAK M., Mihalopoulos N., Kubilay, N., Contributions of Natural Sources to High PM 1 and PM 2.5 Events in the Eastern Mediterranean, Atmospheric Environment, 41, , (27a). 29
37 KOÇAK M., Mihalopoulos N., Kubilay, N., Chemical Composition of the Fine and Coarse Fraction of Aerosols in the Northeastern Mediterranean, Atmospheric Environment, 41, , (27b). KOÇAK, M., Kubilay, N., Herut, B., Nimmo, M., Dry Atmospheric Fluxes of Trace Metals (Al, Fe, Mn, Pb, Cd, Zn, Cu) Over the Levantine Basin: A Refined Assessment, Atmospheric Environment, 39, , (25). KOÇAK, M., Nimmo, M., Kubilay, N., Herut, B., Spatio-Temporal Aerosol Trace Metal Concentrations and Sources in the Levantine Basin of the Eastern Mediterranean, Atmospheric Environment, 38, , (24a). KOÇAK M., Kubilay N., Mihalopoulos N., Ionic Composition of Lower Tropospheric Aerosols at a Notrheastern Mediterranean Site: Implications Regarding Sources and Long-Range Transport, Atmospheric Environment, 38, , (24b). KOUYOUMDJIAN, H., Saliba, N.A., Ion Concentrations of PM and PM 2.5 Aerosols Over the Eastern Mediterranean Region: Seasonal Variation and Source Identification, Atmospheric Chemistry and Physics Discussions, 5, , (25). KROM, M. D., Herut, B., Mantoura, R. F. C., Nutrient Budget for the Eastern Mediterranean: Implications for Phosphorus Limitation, Limnology and Oceanography, 49(5), , (24). KUBİLAY, N., Oguz, T., Koçak, M., Torres, O., Ground-based Assessment of Total Ozone Mapping Spectrometer (TOMS) Data For Dust Transport Over the Northeastern Mediterranean, Global Biogeochemical Cycles, 19, GB122, doi:1.129/24gb237, (25). KUBİLAY N., Cokacar T., Oguz T., Optical Properties of Mineral Dust Outbreaks Over the Northeastern Mediterranean, Journal of Geophysical Research, 18 (D21), 4666, doi:1.129/23jd3jd3798, (23). KUBILAY N., Koçak M., Cokacar T., Oguz T., Kouvarakis G., Mihalopoulos N., Influence of Black Sea and Local Biogenic Activity on the Seasonal Variation of Aerosol Sulphur Species in the Eastern Mediterranean Atmosphere, Global Biogeochemical Cycles, 16(4), 179, doi:1.129/22gb188, (22). LELIEVELD J. ve diğ., Global Air Pollution Crossroads Over the Mediterranean, Science, 298, , (22). MARKAKI Z., Oikonomou K., Kocak M., Kouvarakis G., Chaniotaki A., Kubilay N., Mihalopoulos N., Atmospheric Deposition of Inorganic Phosphorus in the Levantine Basin, Eastern Mediterranean: Spatial and Temporal Variability and Its Role in Seawater Productivity, Limnology and Oceanography, 48 (4), , (23).. MAHOWALD N., Jickells T.D., Baker A.R., Artaxo P., Benitez-Nelson C.R., Bergamatti G., Bond T.C., Chen Y., Cohen D.D., Herut B., Kubilay N., Losno R., Luo C., Maenhaut W., McGee K.A., Okin G.S., Siefert R.L., Tsukuda S., Global Distribution of Atmospheric Phopshorus Sources, Concentrations and Deposition Rates, and 3
38 Anthropogenic Impacts, Global Biogeochemical Cycles, 22, GB426, doi:1.129/28gb324, (28). PAPADIMAS C.D., Hatzianastassiou N., Mihalopoulos N., Querol X., Vardavas I., Spatial and Temporal Variability in Aerosol Properties Over the Mediterranean Basin Based on 6 Year (2-26) MODIS Data, Journal of Geophysical Research, 113, D1125, doi.1.129/27jd9189, (28). RAMANATHAN V., Crutzen P.J., Kiehl J.T., Rosenfeld D., Aerosols, Climate, and the Hydrological Cycle, Science, 294, , (21). RODRIGUEZ S., Querol X., Alastuey A., de la Rosa J., Atmospheric Particulate Matter and Air Quality in the Mediterranean, Environmental Chemistry Letters, 5, 1-7, (27). SCIARE, J., K. Oikonomou, O. Favez, Z. Markaki, E. Liakakou, H. Cachier, and N.Mihalopoulos, 28. Long-term measurements of carbonaceous aerosols in the Eastern Mediterranean: Evidence of long-range transport of biomass burning. Atmospheric Chemistry and Physics, 8, SCHWARTZ S., E., The Whitehouse Effect-Shoerwave Radiative Forcing of Climate By Anthropogenic Aerosols: An Overview, Journal of Aerosol Science, 27 (3), , (1996). SMOLIK, J., Zdimal, V., Schwarz, J., Lazaridis, M., Havranek, V., Eleftheriadis, K., Mihalopoulos, N., Bryant, C., Colbeck, I., Size Resolved Mass Concentration and Elemental Composition of Atmospheric Aerosols Over the Eastern Mediterranean Area, Atmospheric Chemistry and Physics Discussions, 3, , (23). VREKOUSSIS M., Liakakou E., Koçak M., Kubilay N., Oikonomou N., Sciare J., Mihalopoulos N., Seasonal Variability of Optical Properties of Aerosols in the Boundary Layer of the Eastern Mediterranean, Atmospheric Environment, 39, , (25). 31
39 EKLER 32
40 ARTICLE IN PRESS Atmospheric Environment 41 (27) Chemical composition of the fine and coarse fraction of aerosols in the northeastern Mediterranean Mustafa Koc-ak a, Nikos Mihalopoulos b, Nilgu n Kubilay a, a Institute of Marine Sciences, Middle East Technical University, P.O. Box 28, Erdemli-Mersin, Turkey b Environmental Chemical Processes Laboratory, Department of Chemistry, University of Crete, P.O. Box 228, Gr 713 Voutes, Heraklion, Greece Received 22 January 27; received in revised form 27 April 27; accepted 8 May 27 Abstract Two-stage aerosol samples (PM and PM 2.5 ) were collected at a coastal rural site located in the northeastern Mediterranean, between April 21 and 22. A total of 562 aerosol samples were analyzed for trace elements (Fe, Ti, Mn, Ca, V, Ni, Zn, Cr) and water-soluble ions (Na +, NH + 4, K +, Mg 2+, Ca 2+, Cl, Br, NO 3, SO 2 4, C 2 O 2 4 and MS :methane sulfonate). PM 1, crustal elements, sea salt aerosols and NO 3 were mainly associated with the coarse mode whereas non-sea salt (nss)so 2 4, C 2 O 2 4 ; MS, NH + 4, Cr and Ni were found predominantly in the fine fraction. Concentrations of aerosol species exhibited orders of magnitude change from day to day and the aerosol chemical composition is heavily affected by dust events under the influence of airflow from North Africa. During the sampling period, 11 specific mineral dust events of duration varying from 1 day to a week have been identified and their influence on the chemical composition of aerosols has been studied in detail. Ionic balance analysis performed in the coarse and fine aerosol fractions indicated anion and cation deficiency due to CO 2 3 and H + 2, respectively. A relationship between nssso 4 and NH + 4 denoted that sulfate particles were partially neutralized (7%) by ammonium. Excess-K/BC presented two distinct ratios for winter and summer, indicating two different sources: fossil fuel burning in winter and biomass burning in summer. r 27 Elsevier Ltd. All rights reserved. Keywords: Chemical composition; Fine and coarse mode; Dust; Northeastern Mediterranean; Sources 1. Introduction Aerosols physically affect the heat balance of the Earth, both directly by reflecting and absorbing solar radiation, and by absorbing and emitting some terrestrial infrared radiation and indirectly by influencing the properties and cloud processes and, Corresponding author. address: kubilay@ims.metu.edu.tr (N. Kubilay). possibly, by changing the heterogeneous chemistry of reactive greenhouse gases (e.g., O 3 ; IPCC, 21 and references therein). The global radiative forcing due to aerosols is roughly W m 2, which nearly compensates for the mean global radiative forcing of W m 2 due to greenhouse gases warming (IPCC, 21). Recently, Vrekoussis et al. (25) investigated aerosol optical properties in the eastern Mediterranean and estimated radiative forcing at the top of the atmosphere ranging from /$ - see front matter r 27 Elsevier Ltd. All rights reserved. doi:1.116/j.atmosenv
41 7352 ARTICLE IN PRESS M. Koc-ak et al. / Atmospheric Environment 41 (27) to 2.3 W m 2 for summer and winter, respectively. Their estimated radiative forcing values are up to five times higher than that induced by greenhouse gases but opposite in sign. The large range of uncertainty associated with aerosol forcing estimates reflects the poor state of knowledge regarding the sources, distributions and properties of atmospheric aerosols. The need for an increased effort in characterizing tropospheric aerosols in order to reduce the uncertainty in the aerosol forcing estimate has been stressed (Schwartz and Andreae, 1996; Ramanathan et al., 21; Kaufman et al., 22). Recent model studies reproduced satellite observations and demonstrated the role of three major components of aerosols in surrounding regions of the Mediterranean basin (sulfate, black carbon (BC) and dust), having very high direct radiative forcing for aerosols at the top of the atmosphere (Jacobsen, 21; Sciare et al., 23). Knowledge of the spatial and temporal variability of aerosol concentrations, their physical, chemical and radiative properties are very important since they can directly and indirectly influence planetary albedo (climate). Adverse effects of particulate matter (PM) on human health have been shown by a great deal of studies (Englert, 24 and references therein). For example, PM 1 has important health implications through the inhalation of PM, which can be deposited in the lung and high concentrations of trace metals associated with these inhalable particles such as Pb, Cd, V, Fe, Zn, Cr, Ni, Mn and Cu are potentially toxic to human (Singh et al., 22 and references therein). Several studies have been conducted in the western Mediterranean (Querol et al., 21; Rodriguez et al., 22), considering temporal and spatial variability of the concentration of PM 1, aerosol trace elements and water-soluble ions. Nevertheless, studies for the eastern Mediterranean are limited. To our knowledge the only study reporting the temporal variability of trace elements in coarse and fine particles was performed at the arid site, Negev Desert of the Israel (Andreae et al., 22). This paper addresses the temporal variability of the concentration of PM 1, aerosol trace metals and water-soluble ions influencing the Levantine Basin of the eastern Mediterranean, in two-size fractionated aerosol populations (over 1-year period) from the Erdemli site. A size-fractionated sampling strategy will allow the identification of the (i) size distribution of chemical species, (ii) chemical components and contribution of each component to the coarse and fine PM levels, (iii) meteorological processes (by using local rainfall and back trajectories) on the observed concentration levels, (iv) mineral dust events, (v) evolution of organic (oxalate) and inorganic anions on dust particles. 2. Material and methods A Gent-type PM 1 stacked filter unit (SFU) sampler was used in order to collect atmospheric particles in two size ranges, namely, coarse and fine at a rural site located on the coast of the eastern Mediterranean, Erdemli ( N and E), Turkey (for more details see Kubilay and Saydam, 1995; Kubilay et al., 22; Koc-ak et al., 24a, b). Typical to Mediterranean, the sampling site is mostly wet in winter and dry in summer. Pulp and paper industry exist 45 km to the west and a petroleum refinery, soda, chromium, fertilizer industry, a thermic power plant and the city of Mersin (1 million inhabitants) are located 45 km to the east of the sampling site. Sampling commenced in April 21 and ended in April 22. During this period a total of 562 aerosol filter samples were collected with a temporal resolution of 24 h. After collection of aerosol filters, PM and PM 2.5 concentrations were determined gravimetrically. Water-soluble ions were measured by ion chromatography (IC) at Environmental Chemical Processes Laboratory (ECPL), University of Crete, following the method described in details by Bardouki et al. (23). Concentrations of the elements (Fe, Ti, Ca, Mn, K, Cr, V, Zn, Cl, S) were obtained using 2 cm 2 of the filter sample applying proton-induced X-ray emission (PIXE) at ATOMKI (Institute of Nuclear Research of the Hungarian Academy of Sciences, Debrecen, Hungary). During the experiments, the aerosol samples were irradiated by a 2 MeV proton beam, which was supplied by the 5 MV Van de Graaff Accelerator of ATOMKI (for more details see Borbely-Kiss et al., 1999). For the evaluation of PIXE spectra, the PIXEKLM software was applied (Szabo and Borbely-Kiss, 1993). BC content in 46 fine aerosol filter samples collected during winter and summer was determined using a smoke stain reflectometer (SSR, Borbely- Kiss et al., 1999). For this purpose, obtained reflectance was converted into mgm 3 calibrating instrument using EC. More details about sampling and analysis can be found at Koc-ak et al. (27).
42 ARTICLE IN PRESS M. Koc-ak et al. / Atmospheric Environment 41 (27) Three-dimensional (3-D), 3-day backward trajectories (European Center for Medium Range Forecasts) of air masses arriving at the sampling site on 12: UT at a pressure level of 85 hpa representing the top of boundary layer (Katsoulis, 1999) were calculated from April 21 and 22. Cluster analysis in the categorization of air masses back trajectories is widely used (Dorling et al., 1992; Cape et al., 2) since it allows large quantities of data to be processed automatically. The categorization was based on the trajectory coordinates with no inclusion of the information such as whether the trajectory had over land or sea or regions with the potential for emitting crustal materials and/or pollutants into the air mass. In order to use cluster analysis in the categorization of back trajectories, Statistica Package program and the method described by Cape et al. (2) were applied. 3. Results and discussion 3.1. General characteristics of the data The average concentrations of PM, trace elements and water-soluble ions in the fine (do2.5 mm, PM 2.5 ) and coarse (1 mm 4d 42.5 mm, PM ) atmospheric particles along with standard deviations are presented in Table 1. The annual average sulfate and nitrate mass concentrations were 4953 and 1857 ng m 3, respectively. Ca, Fe, Ti and Mg (mainly originating from crust) mass concentrations were found to be 155, 351, 27.1 and 7.6 ng m 3, respectively. Ammonium and potassium had mean values of at 85 and 23 ng m 3, respectively. Sea salt particles consist mainly of sodium chlorite and sulfate (primarily Na 2 SO 4, MgSO 4 or K 2 SO 4 ) and non-sea salt fractions of ions was calculated from Table 1 Statistical descriptions of the elemental and ionic concentrations measured in the coarse and fine fractions of particles collected at Erdemli over the period of April 21 and 22 Species This study PM 1 eastern Mediterranean PM 1 western Mediterranean PM PM 2.5 This study a rural Sde boker b arid Monagrega c rural PM Fe Ti Mn Ca V Ni Zn Cr S K Na Cl Mg nssmg Br K nssk NH NO SO nssso C 2 O MS Ca nssca Concentrations are expressed in ng m 3, except for PM, for which concentrations are in mgm 3. a This study. b Andreae et al. (22). c Rodriguez et al. (22).

43 7354 ARTICLE IN PRESS M. Koc-ak et al. / Atmospheric Environment 41 (27) measured concentrations of ion interested, Na + and a standard sea water composition (Turekian, 1976). Sea salt-originated water-soluble ions were also found in high concentrations, as expected for a coastal sampling site. Trace metals V, Ni and Zn have anthropogenic origins such as residual oil and smelters and show concentrations of 8.7, 3.7 and 9.7 ng m 3, respectively. The annual arithmetic mean PM 1 mass concentration was 36.4 mgm 3. Ca concentrations obtained from PIXE analyses are higher than those obtained from IC measurements; the results indicate (Table 1) that on average, water-soluble Ca 2+ concentrations (IC) are about 2% lower than the total Ca (PIXE). The insoluble fraction (amounting to 2%) might be attributed to the existence of insoluble compounds of Ca such as calcium oxide and feldspar. Water-soluble sulfate has mean values about three times of the elemental S concentration (PIXE). This ratio is identical to the mass ratio of SO 4 2 /S and implies that almost all of the observed elemental S is in the form of sulfate. Size distributions of trace metals and watersoluble ions in coarse and fine fractions are presented in Fig. 1. The largest portion of the atmospheric particle mass is associated with coarse particles and contributes 73.4% to the observed particle mass. Crust-originated trace metals (Fe, Ti and Mn), water-soluble ions Na +, Cl, Mg 2+, Ca 2+, Br and NO 3 are associated mainly with coarse particles (475%). The mass concentration of oxalate (C 2 O 4 2 ) and non-sea salt sulfate (nssso 4 2 ) was mainly found in the fine mode (6% and 8%, respectively). On the other hand, ammonium (NH 4 + ) and methane sulfonate (MS ) mass concentrations were exclusively found in the fine size fraction. Trace metals V and Zn displayed almost half of their mass concentrations in the fine fraction while about 6% and 7% of the mass concentrations of Ni and Cr were found in the fine the fraction, respectively Daily variations of chemical composition The daily variations in the concentrations of PM, aerosol trace elements and water-soluble ions with daily precipitation between April 21 and 22 are presented in Fig. 2. Aerosol species originating from sea salt (Na + and Cl ) exhibit their highest mass concentrations and larger variations during the winter season due to unsettled weather, which enhances the concentrations of the aforementioned aerosol elements throughout periods of severe sea spray generation. Crustal aerosol species (Fe and Ti, see Fig. 2) indicates strong daily variability in their concentrations. The concentrations of crust-originated species showed lower values frequently during the winter season (due to rain). As is well documented in the 1 Coarse Fraction (1-25µm) Fine Fraction (<25µm) Relative Contribution (%) Br - Cl - Na + nssca 2+ Mg 2+ NO 3 - Ti Fe Mn PM 1 Cr K Ni Zn V C 2 O 4 2- nssso 4 2- NH 4 + MS - Fig. 1. Relative contributions of PM 1 and aerosol species in the fine and coarse fraction.
44 ARTICLE IN PRESS M. Koc-ak et al. / Atmospheric Environment 41 (27) Na + Cl NO 3 - C 4 O 4 2- *5 ngm -3 4 ngm Fe Ti* nssso 4 2- NH 4 + *5 ngm -3 2 ngm ngm -3 Rain (mm) V Ni 2 MS - A M J J A S O N D J F M A ngm -3 Rain (mm) A M J J A S O N D J F M A Fig. 2. Daily variations of sea salt, crustal, anthropogenic and biogenic aerosols throughout the period between April 21 and 22 along with daily rain events. literature (Alpert and Ziv, 1989; Kubilay and Saydam, 1995; Moulin et al., 1998; Kubilay et al., 2; Koc- ak et al., 24a), despite efficient scavenging by wet precipitation, crustally originated aerosol species showed higher concentrations and larger variations during the transitional (spring and autumn) period when the air mass trajectories originated predominantly from North Africa but rarely from the Middle East, and are often associated with intense sporadic peaks of mineral dust. However, during the summer period, crustally originated trace metals exhibited less variability in their concentrations since the soil is dry in this season and the lack of wet precipitation leads to greater re-suspension of local soil particles. Fig. 2 presents the daily variations of the watersoluble ions nssso 2 4, MS, NH + 4, C 2 O 2 4 and NO 3. They show larger variabilities and peak values in summer due to the absence of precipitation and changes in air masses origin. For example, the highest MS concentration was found on the 3rd of June 21 under the influence of maritime airflow originating from the Mediterranean Sea. Sharp decreases in the concentrations of MS from the summer towards winter may be attributed to variations in several different processes: chemical, biological (primary productivity) and meteorological (Kubilay et al., 22) Influence of dust events on aerosol chemical composition The Mediterranean region is affected by large quantities of mineral dust associated with air mass transport mainly from sources in North Africa and occasionally from sources in the Middle East.
45 7356 ARTICLE IN PRESS M. Koc-ak et al. / Atmospheric Environment 41 (27) Recently, dust storm source areas have been determined by the total ozone-mapping spectrometer (TOMS) and results indicated that the Saharan desert is the predominant source and the Middle East is one of the key sources (Washington et al., 23). Mineral dust transport from North Africa can be observed at any time of the year in the eastern Mediterranean; however, the frequency of the events is much greater in March, April, May and October when air masses are associated with cyclonic activity (Alpert and Ziv, 1989; Moulin et al., 1998; Kubilay et al., 2, 25). Fig. 3 presents the daily variations (from winter to transitional seasons) of the aerosol trace metals Fe, Ti, Mn and Ca concentrations between April 21 and 22, along with identified dust events and daily rainfall. Aerosol Fe concentrations higher than 5 ng m 3 as threshold values, and corresponding air mass back trajectories, satellite images obtained from TOMS were utilized in order to ng 9 Fe (ng m -3 ) ng m -3 (threshold) ng Ti (ng m -3 ) 2 1 Mn (ng m -3 ) ng Ca (ng m -3 ) ng 16 Rain (mm) Å M D J F M Å Fig. 3. Daily variations of trace metals associated with a crustal component from the winter to transitional seasons between 21 and 22.

46 ARTICLE IN PRESS M. Koc-ak et al. / Atmospheric Environment 41 (27) refine mineral dust events at Erdemli in the winter and transitional seasons. During these periods, 34 dust days were identified by an abrupt increase in the concentrations of Fe, Ti, Mn and Ca. These dust days were characterized by 11 specific mineral dust events of duration varying from 1 day to 7 days, but most commonly for 2 3 days (Fig. 3). During dust events, Fe concentrations were found to range from 5 to 7 ng m 3, indicating a large variability of the dust events with time. Figs. 4a and b show air mass back trajectories along with TOMS satellite images for 13 May when the highest Fe concentration (6666 ng m 3 ) in the dataset was observed. On 13 May, trajectories showed that at 85, 7 and 5 hpa levels, air masses arrived at Erdemli from the northeastern Saharan region. In addition, TOMS satellite image showed particularly high Aerosol Index values over Libya, Egypt and the Middle East and very intense dust transport in the eastern Mediterranean region. Table 2 (derived from Fig. 3) shows arithmetic mean concentrations of aerosol species for dust and non-dust events at Erdemli. As can be seen, aerosols definitely show different chemical compositions between dust events and non-dust events. For example, the crustally derived aerosol species (Fe, Ti, Mn and Ca 2+ ) for dust events had arithmetic mean concentrations at least three times higher than those observed for non-dust events. Anthropogenically derived aerosol elements (Zn, V, Ni and Cr) also showed enhancements during dust events with values ranging from 1.3 to 1.5. In addition, watersoluble ions nssso 4 2, C 2 O 4 2 and NO 3 also indicated enhancements during dust events with values ranging from 1.6 to 2.. Field and laboratory studies indicated that mineral dust particles can serve as reaction surfaces for different species, including those of man-made origin (Mamane and Gottlieb, 1992; Underwood et al., 21; Aymoz, et al., 24; Putaud et al., 24; Alastuey et al., 25). Gaseous species such as SO 2, N 2 O 5, HNO 3 and O 3 can react with mineral dust particles (Mamane and Gottlieb, 1992; Dentener et al., 1996) and result in the modification of optical properties, size distributions and chemical composition of the aerosols (Usher et al., 23). Aymoz et al. (24 and references therein) emphasized the limitations of the current knowledge about interactions between mineral dust and organic compounds. Recently, Putaud et al. (24) have indicated that Table 2 Arithmetic mean concentrations of aerosol species for dust events and non-dust events at Erdemli Species Dust events Non-dust events Fe Ti Mn Ca Ant Zn Ant V Ant Ni Ant Cr nssso C 2 O NO Ant refers to the anthropogenic fraction and is calculated using the formula presented as (X Ant ¼ X total [(C R ) aerosol (C X /C R ) Reference ]. Fig. 4. Air mass back trajectories for the 13th of May 21 (a) Horizontal component (b) TOMS Aerosol Index. The back trajectory pathway every 12 h is indicated by triangles for 1 hpa, stars for 85 hpa, circles for 7 hpa and squares for 5 hpa.
47 7358 ARTICLE IN PRESS M. Koc-ak et al. / Atmospheric Environment 41 (27) there was no significant SO 2 oxidation onto mineral dust particles while NO 3 shifted to the super-mm fraction due to the adsorption of HNO 3 onto dust particles during Saharan dust plumes. However, very low increases of sulfate and nitrate onto mineral dust particles were found by Aymoz et al. (24). Furthermore, these authors detected various organic acid (including oxalic acid) levels and have suggested low reactions of primary volatile organics on dust particles, but some uptake of acidic gases such as formic acid during transport. In contrast, Falkovich et al. (24) clearly showed interaction of semi-volatile compounds with mineral dust particles. In order to identify the enrichment of sulfate and oxalate onto mineral dust particles, the transitional period was considered since most of the dust episodes take place during this period. Fig. 5 presents the concentrations of nssso 4 2 and C 2 O 4 2 during the transitional period together with nssca 2+ concentrations in the coarse particle size 2 range. As can be seen, clear enrichment of nssso 4 and C 2 O 2 4 were found to occur during the intense mineral dust events (nssca ng m 3 ). As mentioned before, the highest mineral dust outbreak was observed on 13 May 21 and characterized by an extremely high nssca 2+ concentration (around 19 ng m 3 ; case-3). The corresponding nssso 2 4 /nssca 2+ ratio is.26 in the coarse size range. During the second event, the nssso 2 4 /nssca 2+ ratio is identical to the ratio observed for case-3 (.26). During cases 1 and 4, nssca 2+ concentrations remained higher than 65 ng m 3. The nssso 2 4 /nssca 2+ ratios for cases 1 and 4 were.74 and.67, respectively. Putaud et al. (24) applying nssso 2 4 /nssca 2+ ratios (.47.1) in the super-mm aerosol size range during highest mineral dust episodes in their study, suggested that this event showed super-mm nssso 2 4, which was probably of pure Saharan origin. The 4 Coarse C 2 O 4 2- (ng m -3 ) Coarse nssso4 2- (ng m -3 ) Coarse 2 3 nssca 2+ (ng m -3 ) April May March April Fig. 5. Daily variability of C 2 O 4 2, nssso 4 2 and nssca 2+ in coarse size range during the transitional period.
 and implies there was no enrichment of sulfate onto dust particles. On the other hand, cases 1 and 4 show about three times enhancements of nssso 4 2 compared to cases 2 and 3.")
48 ARTICLE IN PRESS M. Koc-ak et al. / Atmospheric Environment 41 (27) calculated ratios for cases 2 and 3 are close to the ratio (.47.1) observed by Putaud et al. (24) and implies there was no enrichment of sulfate onto dust particles. On the other hand, cases 1 and 4 show about three times enhancements of nssso 4 2 compared to cases 2 and 3. For that reason, this enhancement might be attributed to significant SO 2 oxidation onto mineral dust particles or to a significant H 2 SO 4 reaction with mineral dust particles. As can be clearly seen from Fig. 5, oxalate shows highest concentrations in the coarse size range during the mineral dust episodes. Oxalate concentrations showed abrupt increases during the mineral dust outbreaks and indicated 2 4 times enhancement compared to the concentrations observed for the previous day. As a result, this enhancement might be attributed to significant oxidation of adsorbed gaseous precursors onto dust particles or coagulation between fine particles of oxalate and mineral dust particles. Although nitrate concentration for dust events is about two times higher than those for non-dust events, oxidation of gaseous precursors of nitrate onto dust particles or coagulation between fine particles of nitrate and mineral dust particles were not observed. This might be attributed to the accumulation of pollutant nitrate with the dust event following the mechanism suggested by Guo et al. (24) Influence of airflow on aerosol chemical composition The result of cluster analysis for the whole dataset from April 21 to 22 is shown in Fig. 6. The diagram shows the means of clustered trajectories and calculated frequencies for each cluster, respectively. Beginning from the north-west, there are two clusters (1 and 2). First cluster shows trajectories with high wind speeds (long fetch) from the Atlantic Ocean, then passing through Europe and accounting for 5.3% of the airflow during the study period (hereafter EL). The second cluster also denotes north-westerly air flows but they are relatively slower than trajectories of the first cluster, and elucidating 8.2% of the trajectories, (ES) third and fourth clusters show short trajectories originating from north-west (Cluster 3; NWT) and north Turkey (Cluster 4; NT) and they represent 42.8% and 19.8% of the airflow, respectively. Air masses originating from the Middle East/Arabian Peninsula (Cluster 5; SE) and Eastern Saharan (Cluster 6: SAH) represent 9.6% and 7.8% of the trajectories. The last cluster shows trajectories traveling at high speeds, being maritime air masses from the western Mediterranean Sea, representing 6.6% of the airflow (hereafter MS). In order to assess the influence of air mass movement on observed constituent concentrations, Fig. 6. Average 3-day air mass back trajectories for 85 hpa pressure level on the core days for the seven main clusters for April The percent of trajectories belonging to a particular cluster are shown in parenthesis.
49 736 ARTICLE IN PRESS M. Koc-ak et al. / Atmospheric Environment 41 (27) clusters of trajectories were applied. The Kruskal Wallis (K W) test was applied to test for the presence of significant differences in water-soluble and trace metal concentrations categorized by trajectory clusters. Mean concentrations of watersoluble ions and trace metals in eastern Mediterranean aerosol representative of trajectory clusters are presented in Table PM 1 Application of the K W test would indicate that there was a significant difference in concentrations of PM 1 (po.1). PM 1 concentrations in Clusters 5 and 6 were found to be statistically higher than those calculated for the remaining clusters. These two categories are heavily affected by sea spray and crustal aerosol populations, which are the main agents of the eastern Mediterranean aerosol. Therefore, PM 1 concentrations in the eastern Mediterranean are predominantly controlled by sea spray and crustal-derived aerosols Marine components (Na and Cl, Mg, Br; po.6) As can be seen from Table 3, sea salt aerosols had the highest concentrations under the influence of air mass originating from the south-east since trajectories swept over the Mediterranean Sea before arriving at the sampling site and hence enhances sea salt generation. For this category, calculated concentrations (Cluster 5: SE) are approximately times higher than those calculated for other categories (as the site is more exposed to SE than W or wind speed for SE d than W sector) Crustal components (Fe, Ti and Mn) As expected, these trace metal aerosol exhibited their highest concentrations when the air masses originated from North Africa (Cluster 6, S), which are often associated with intense sporadic peaks of mineral dust. Crust-originated trace metals Fe, Ti and Mn concentrations in this category (Cluster 6) were found to be about 2 4 times higher than those observed for the remaining categories Primary anthropogenic components (V, Ni, Zn; po.5) V and Ni had statistically significant higher concentrations in trajectory Cluster 1 (NWL) and Cluster 2 (NW). Zn statistically showed lowest concentration under the influence of western Mediterranean airflow. According to the first report (21) of European Pollutant Emission Register (EPER, which focuses on the prevention and control of pollutants; the emission of nickel and its compounds are particularly affected by European countries Spain, Italy, Portugal, Germany, Belgium, United Kingdom and Netherlands (all have contributions higher than 4%). Consequently, it is more likely that airflow from the European continent makes significant contributions of V and Ni to aerosol collected at Erdemli (since air masses can pick up such compounds on both routes; NWL and NW). Table 3 Mean concentrations of water-soluble ions and trace metals (in PM 1 ) as a function of the cluster corresponding to the 3-day air mass back trajectory arriving at Erdemli Species Cluster 1 Cluster 2 Cluster 3 Cluster 4 Cluster 5 Cluster 6 Cluster 7 EL ES NWT NT SE SAH MS Na NO nssso C 2 O NH MS Fe Ti Mn nssca V Ni Cr Zn PM
50 ARTICLE IN PRESS M. Koc-ak et al. / Atmospheric Environment 41 (27) nssso 2 4,NO 3,NH + 4,C 2 O 2 4 and MS These water-soluble anions showed statistically significant higher concentrations in Cluster 4, under the influence of airflow from north Turkey. Kubilay et al. (22) showed that nssso 2 4 and MS concentrations at Erdemli are affected by air mass flow from the Black Sea, which supplies the aforementioned ions due to DMS-producing species (such as coccolithophorids, flagellates, etc.). Hence, higher concentrations of nssso 2 4 and MS 2 (C 2 O 4 as well) might be attributed to high biogenic activities taking place in the Black Sea. It is worth mentioning that the concentrations of nssso 2 4, NO 3, NH + 4, C 2 O 2 4 water-soluble ions are also likely to originate from pollution emissions. Urban agglomerations (such as Ankara, Konya) are attractive centers for gathering population (for example increased traffic) and industrial activities; therefore, such air masses can be loaded with these water-soluble ions since trajectories swept over large cities and industrialized parts of Turkey Aerosol ionic balance An ionic balance (as mole equivalents) can be a useful tool to determine any possible missing ionic species. A plot of total cation equivalents against total anion equivalents for each size class is presented in Figs. 7a and b, respectively. The slope of the regression line for coarse particles indicates a value higher than unity (slope ¼ 1.14, r ¼.97), which may be due to the existence of CO 3 2 in this size fraction, which has not been measured using IC. In contrast, the slope of the regression line for the fine fraction is lower than unity (slope ¼.7, r ¼.97), which may be attributed to the presence of H + (not measured) in the aerosol samples. If this is the case, CO 3 2 is expected to associate with Ca 2+ and H + is expected to react with SO 4 2 in the coarse and fine fractions, respectively (Figs. 8a and b). A statistically significant correlation was found when Ca 2+ concentrations were plotted against the anion deficit, defined as an excess of positive charge, indicating that CO 3 2 is most probably the missing anion in the coarse aerosol fraction. A significant correlation was also found between SO 4 2 and the cationic deficiency in the fine fraction, that the cation deficiency, defined as an excess of negative charge, is possibly due to H + associated with SO 4 2. Figs. 9a and b highlight the monthly variation of the sum of anions and cations as a function of the coarse and fine particles. It is apparent from Figs. 9a and b in the coarse fraction that the concentrations of anions and cations decrease from the winter towards the summer whereas in the fine fraction concentrations of anions and cations increase from winter towards summer. In the coarse fraction, anion deficiency is observed throughout the year (due to missing CO 3 2 ). In the fine fraction with the exception of June August the sum of anions matches the sum of cations, indicating almost complete neutralization of the aerosols. This is highlighted by a plot of total cation equivalent against total anions equivalent for winter and summer (Fig. 1a). The slope of the regression line for winter (slope ¼.95) shows value slightly lower than unity. However, the slope of the regression line for summer (slope ¼.66) is substantially lower Sum of Cations (neqm -3 ) S.O.C =1.14 x S.O.A +17 r=.97 1:1 line Sum of Cations (neq m -3 ) S.O.C=.7 x S.O.A +7 r=.97 1:1line Coarse Fine Sum of Anions (neq m -3 ) Sum of Anions (neq m -3 ) Fig. 7. Sum of the anions vs sum of the cations (a) regression analysis in coarse samples (b) regression analysis in fine samples.
 -5-1 SO 2-4 (neq m -3 ) 1 2 3 4 y =-.29x r =.94-12 Coarse -15 Fine Fig. 8.")
 2 (neq m -3 ) 1 1 5 A M J J A S O N D J F M A 21 22 A M J J A S O N D J F M A 21 22 Fig. 9.")
51 7362 ARTICLE IN PRESS M. Koc-ak et al. / Atmospheric Environment 41 (27) Ca + (neq m -3 ) Anion Deficit (neq m -3 ) y =-.93x r =.94 Cation Deficit (neq m -3 ) -5-1 SO 2-4 (neq m -3 ) y =-.29x r = Coarse -15 Fine Fig. 8. (a) Variation of anion deficit versus the Ca 2+ concentrations in coarse samples, (b) variation of cation deficit versus the SO 4 2 concentrations in fine samples. 4 Anion Sum Cation Sum 2 Anion Sum Cation Sum 3 15 (neq m -3 ) 2 (neq m -3 ) A M J J A S O N D J F M A A M J J A S O N D J F M A Fig. 9. Monthly variations of sum of cations and anions as function of particle size (a) coarse mode, (b) fine mode. than unity. Furthermore, in winter almost all of the nssso 4 2 is neutralized by NH 4 + (Fig. 1b). Therefore, nssso 4 2 can be assumed to exist as (NH 4 ) 2 SO 4. However, in summer the amount of NH 4 + is not sufficient to neutralize nssso 4 2 (NH 4 + / nssso 4 2 equivalent ratio.65), thus implying the presence of a significant amount of H +. Indeed 35% of SO 4 2 in summer is associated with H + (see Fig. 1c) Correlations between aerosol chemical compositions The correlation coefficients (r) found for watersoluble ions and elements are shown in Table 4a and b for both coarse and fine particles, respectively Coarse particles As expected, sea salt-associated ions (Na +,Cl, Mg 2+ and Br ) illustrate strong correlation coefficients (r4.9) between one another, denoting they are primarily originate from sea salt. The slope of the regression line is 1.8 between Na + and Cl, which is identical to that reported for seawater. The slope of the regression line is.13 between Na + and Mg 2+, which is close to that reported for seawater. Sulfate (SO 4 2 ) also has a strong correlation coefficient (r4.85) between sea salt-associated ions, indicating significant contributions from sea salt generation to observed concentrations. Nitrate (NO 3 ) and oxalate (C 2 O 4 2 ) have strong correlations (r ¼.73) and may be attributed to heterogeneous processes on alkaline cations (originating from sea salt and mineral dust) surfaces. As expected, crustal species Ti, Fe, Mn and Ca 2+ exhibit strong correlations (r4.9). K has a strong correlation (r4.85) with crustal species and a moderate correlation coefficient with sea salt aerosol (r4.55). Therefore, K has a mixed origin; however, crustal material is the predominant source. V and Zn are moderately correlated with crustal species suggesting at least some of the measured concentrations of these elements are associated with crustal material. V and Ni also present strong
52 ARTICLE IN PRESS M. Koc-ak et al. / Atmospheric Environment 41 (27) Sum of Cations (neq m -3 ) NH 4 + (neq m -3 ) Cation Deficit (neq m -3 ) Winter (T <15 C) Summer (T>23 C) r=.97; y=.66x + 5 r=.97; y=.95x Sum of Anions (neq m -3 ) Winter (T <15 C) Summer (T>23 C) r=.97; slope=.65 r=.98; slope= nssso 4 2- (neq m -3 ) SO 4 2- (neq m -3 ) r=.98; slope=-.35x Winter (T <15 C) Summer (T>23 C) r=.86; slope=-.11 Fig. 1. (a) Sum of the anions vs. sum of the cations, (b) relationship between nssso 4 2 and NH 4 + and, (c) variation of cation deficit versus the SO 4 2 concentrations for winter and summer. correlation coefficients (r ¼.78) and imply residual oil combustion as a contributing source. Ca 2+ (nonsea salt fraction) also has a significant correlation coefficient (r ¼.7) with nssso 2 4 and a moderate correlation coefficient with (r4.25) NO 2 3,C 2 O 4 and K +. Correlations between nssso 2 4,NO 3 and C 2 O 2 4 suggest heterogeneous reactions between Ca 2+ and aforementioned anions Fine particles Na + and Mg 2+ have strong correlations (r ¼.7) and these cations also show a moderate correlation with Cl, the most probable source being sea salts. Similar to coarse particles, crustal elements show strong correlation coefficients (r4.8) in the fine particle fraction. K shows a moderate correlation coefficient (r.4) with crustal and sea salt aerosols. Hence, observed correlation coefficients imply crustal and sea salt contributions to fine K particles. Biomass and fossil fuel burning might be accounted as additional sources to fine K due to strong correlations with BC in summer and winter, respectively (Fig. 11). Likewise for the coarse fraction, V and Ni show strong correlation coefficients (r ¼.88) in the fine fraction, which would point to residual oil combustion as a source. The anion nssso 2 4 is significantly correlated with NH + 4 (r ¼.96), C 2 O 2 4 (r ¼.86), MS (r ¼.76) and moderately correlated with K (r ¼.48). Same figures exist for oxalate (correlation with MS (r ¼.71), NH + 4 (r ¼.83) and K (r ¼.64) and NH + 4 (correlation with MS (r ¼.67) and K (r ¼.42). In addition non-sea salt sulfate, NH + 4 and C 2 O 2 4 have also statistically significant correlation coefficients (r4.7) with Zn. Usually Zn is considered an indicator of refuse incineration (Rahn and Huang, 1999). On the other hand, MS has only a natural source, arising from the precursor DMS (biogenic activity) through gas to particle conversions. Hence the observed correlations for non-sea salt sulfate, NH and C 2 O 4 imply a common mixed origin (natural and anthropogenic). Relationships between BC and other species were also investigated in 46 fine aerosol filter samples. BC presents a strong correlation only with excess potassium. Andreae (1983) suggested that the mass ratio of excess potassium to BC may provide information enabling the distinction between the K that would be produced by biomass burning and combustion sources. As can be inferred from Fig. 11, the excess potassium to BC ratio indicates two distinct ratios. The slope of the regression line in summer was found to be.366 (R 2 ¼.72) and close to the values generally measured in aerosols
53 Table 4 Binary correlation coefficient matrix 7364 Ti Fe Mn Ca 2+ K Zn V Ni Cr Cl Mg 2+ Na + Br SO 4 2 nssso 4 2 C 2 O 4 2 NO 3 (a) Coarse particles Ti 1 Fe.99 a 1 Mn.97 a.98 a 1 Ca a.93 a.93 a 1 K.9 a.91 a.87 a.91 a 1 Zn V Ni Cr Cl Mg a 1 Na a.96 a 1 Br a.96 a.93 a 1 2 SO a.93 a.89 a.89 a 1 2 nssso C 2 O NO SO 4 2 nssso 4 2 NH 4 + C 2 O 4 2 MS K Mg 2+ Na + NO 3 V Ni Zn Ti Fe Mn Ca 2+ Cr (b) Fine particles 2 SO nssso 4.99 a 1 + NH 4.96 a.96 a 1 2 C 2 O 4.86 a.86 a.83 a 1 MS K Mg Na NO V Ni a 1 Zn Ti Fe a 1 Mn a.89 a 1 Ca a.83 a.79 1 Cr M. Koc-ak et al. / Atmospheric Environment 41 (27) ARTICLE IN PRESS Italic fonts show moderate correlation coefficient. a Strong correlation coefficient.
.")
54 ARTICLE IN PRESS M. Koc-ak et al. / Atmospheric Environment 41 (27) PM 1 Percentage (%) J F M A M J J A S O N D Mineral Dust Sea Salt Ionic Mass Inidentified Fig. 11. Relationship between excess potassium and black carbon in summer and winter. Fig. 12. Monthly source apportionment analysis for PM 1. dominated by biomass burning (.21.46; Andreae, 1983). Therefore, the observed ratio implies that biomass burning makes an important contribution to fine BC in the summer. However, the slope of the regression line in winter was about (.62; R 2 ¼.89) 5 times lower than that found in summer and is similar to those found in an urban atmosphere dominated by fossil fuel burning (K/BC ¼.25.9, Yang et al., 25). Hence an excess K BC ratio suggests that fossil fuel burning predominate the source of fine BC particles during winter. In order to support this suggestion, both air mass trajectories and MODIS fire maps for summer and winter were used. Indeed, summer (unlike to winter) trajectories (mostly originated from Black Sea and Mediterranean coastal regions) and MODIS fire maps (shows very active forest fires Black Sea and Mediterranean coastal regions) suggest biomass burning as main source of BC in this period Seasonal variation of the PM 1 chemical composition Fig. 12 presents monthly source apportionment analysis for coarse and fine modes, respectively. Chemical composition was defined by four main classes: dust, sea salt, ionic mass and unidentified, the later accounting mainly for BC and OC. Dust levels have been calculated using Fe or Ti as an indicator of crustal material. The total amount of mineral dust was estimated using Fe concentrations assuming a relative ratio to the upper crust of 3.89% (Wedepohl, 1995). The sea salt contribution was calculated from Na + concentrations, assuming that Na + has a pure marine origin. Finally, ionic mass is the sum of nssso 2 4 ;NO 3, C 2 O 2 4,NH + 4, nssk + and nssmg 2+. Non-sea salt levels of the species were calculated using Na + as the tracer and a standard sea water composition (Turekian, 1976). As expected, the highest sea salt contribution was observed in winter. Sea salt contribution ranged from 35% to 5% in winter (January, February and December). Its contribution gradually decreased from winter to summer. During the summer (June September), sea salt accounted for 25% of the PM 1. The highest dust contribution was observed during the transition period (March May) and accounted for more than 4% of PM 1. This trend is related to the frequent occurrence of Saharan dust transport to the eastern Mediterranean during the transition season (for more details see Section 3.3). Secondary aerosol contribution (nssso 2 4,NO 3 and NH + 4 ) showed lower contributions in winter and its contribution sharply increased from winter to summer. Secondary aerosol contributions in summer (ranged from 3% to 35%) were three times higher than those for winter (ranged from 8% to 12%). The unidentified mass might be attributed to residual water associated with aerosol and BC/organic carbon, which was not measured for all samples and accounts for about 2% of the PM 1 mass in agreement with studies carried out by Putaud et al. (24) and Gerasopoulos et al. (26).
55 7366 ARTICLE IN PRESS M. Koc-ak et al. / Atmospheric Environment 41 (27) Conclusion Chemical composition of the fine (PM 2.5 ) and coarse (PM ) fraction of aerosol samples was investigated at a coastal rural site in the northeastern Mediterranean. PM 1 mass is dominated by coarse fraction, which accounts for about 75% of the total PM 1 concentration. Crust (Fe, Ti, Mn, Ca), sea salt (Na +,Cl,Mg 2+,Br )-originated species and NO 3 are associated mainly with coarse particles (475%) whilst trace elements Cr and Ni and water-soluble ions nssso 2 4,C 2 O 2 4,MS and NH + 4 are primarily found in the fine fraction (46%). V and Zn are found to be equally distributed between coarse and fine particles. Aerosol species concentrations exhibit an order of magnitude change from day to day and the aerosol chemical composition is heavily influenced by dust transport from North Africa. For the whole sampling period, 11 specific mineral dust events (with duration from one day to a week) were identified with Fe concentrations ranging from 5 to 7 ng m 3, demonstrating a large variability of the dust events with time. Investigation of strong dust events (nssca ng m 3 ) shows that for two events nssso 2 4 and oxalate were enriched in the coarse fraction. Such enrichments might be attributed to the significant oxidation of gaseous precursors onto dust particles or to the coagulation between fine and coarse particles. Anthropogenic trace elements V and Ni present higher concentrations under the influence of European airflow whereas water-soluble ions (nssso 2 4, NO 3,NH + 4,C 2 O 2 4 and MS ) demonstrate higher concentrations under the influence of airflow from North Turkey. According to an ionic balance, coarse and fine fractions are dominated by cations and anions, respectively. A relationship between Ca 2+ and anion deficiency implies that CO 2 3 is most probably the missing anion in the coarse fraction whereas significant correlation between SO 2 4 and cation deficiency in the fine fraction is might be a consequence of H + -associated SO Investigation of the relationship between nssso 4 and NH + 4 indicates that sulfate particles are not sufficiently neutralized by basic NH + 4. Equivalent ratio (NH + 4 /nssso 2 4 ¼.68) exhibits that about 7% of the nssso 2 4 is neutralized by NH + 4. Excess- K/BC presents two distinct ratios for winter (.66) and summer (.366), indicating two contrasting BC sources in the area. These ratios suggest that in the winter BC mainly originates from fossil fuel burning whilst it is predominantly emitted from biomass burning in the summer. Acknowledgements This study was funded in part by the Middle East Technical University (AFP ), The Scientific & Technological Research Council of Turkey (15Y368) and WMO (through special service agreements of 5.115/A/CNS and /A/ CNS). The authors would like to thank the NASA/ GSFC/TOMS group for the use of TOMS Aerosols Index data, and Emin O zsoy for making available the ECMWF trajectory analysis through collaboration with the Turkish State Meteorological Office. Mustafa Koc- ak benefited from research fellowships of the International Atomic Energy Agency (TUR/ /6) and RICAMERE (Research In Global ChAnge in the Mediterranean, European Union- ENRICH program) project. We acknowledge cooperation with I. Borbely-Kiss for her generous help of allowing Mustafa Koc-ak to use PIXE for the analysis of elements at ATOMKI. The authors would like to thank the anonymous reviewers for their helpful comments. References Alastuey, A., Querol, X., Castillo, S., Escudero, M., Avila, A., Cuevas, E., Torres, C., Romero, P.M., Exposito, F., García, O., 25. Characterisation of TSP and PM2.5 at Izaña and Sta. Cruz de Tenerife (Canary Islands, Spain) during a Saharan Dust Episode (July 22). Atmospheric Environment 39, Alpert, P., Ziv, B., The Sharav cyclone: observations and some theoretical considerations. Journal of Geophysical Research 94, Andreae, M.O., Soot carbon and excess fine potassium: long-range transport of combustion derived aerosols. Science 22, Andreae, T.W., Andreae, M.O., Ichoku, C., Maenhaut, W., Cafmayer, J., Karnieli, A., Orlovsky, L., 22. Light scattering by dust and anthropogenic aerosol at a remote site in the Negev Desert, Israel. Journal of Geophysical Research 17 (D2), doi:1.129/21jd9252. Aymoz, G., Jaffrezo, J.L., Jacob, V., Colomb, A., George, C., 24. Evolution of organic and inorganic components of aerosol during a Saharan dust episode observed in the French Alps. Atmospheric Chemistry and Physics 4, Bardouki, H., Liakakou, H., Economou, C., Sciare, J., Smolik, J., Zdimal, V., Eleftheriadis, K., Lazaridis, M., Dye, C., Mihalopoulos, N., 23. Chemical composition of size resolved atmospheric aerosols in the eastern Mediterranean
56 ARTICLE IN PRESS M. Koc-ak et al. / Atmospheric Environment 41 (27) during summer and winter. Atmospheric Environment 37, Borbely-Kiss, I., Koltay, E., Szab o, Gy., Boz o, L., Tar, K., Composition and sources of urban and rural atmospheric aerosol in Eastern Hungary. Journal of Aerosol Science 3, Cape, J.N., Methven, J., Hudson, L.E., 2. The use of trajectory cluster analysis to interpret trace gas measurements at Mace Head, Ireland. Atmospheric Environment 34, Dentener, F.J., Carmichael, G.R., Zhang, Y., Lelieveld, J., Crutzen, P.J., Role of mineral aerosol as a reactive surface in the global troposphere. Journal of Geophysical Research 11, Dorling, S.R., Davies, T.D., Pierce, C.E., Cluster analysis: a technique for estimating the synoptic meteorological controls on air and precipitation chemistry method and applications. Atmospheric Environment 26A, Englert, N., 24. Fine particles and human health-a review of epidemiological studies. Toxicology Letters 149, Falkovich, A.H., Schkolnik, G., Ganor, E., Rudich, Y., 24. Adsorption of organic compounds to urban environment onto mineral dust particles. Journal of Geophysical Research 19, D228, doi:1.129/23jd3919. Gerasopoulos, E., Kouvarakis, G., Babasakalis, P., Vrekoussis, M., Putaud, J.P., Mihalapoulos, N., 26. Origin and variability of particulate matter (PM 1 ) mass concentrations over the eastern Mediterranean. Atmospheric Environment 25, Guo, J., Rahn, K.A., Zhuang, G., 24. A mechanism for the increase of pollution elements in dust storms in Beijing. Atmospheric Environment 38, IPCC, 21. Climate Change 21. Intergovernmental Panel on Climate Change. Cambridge University Press, London. Jacobsen, M.Z., 21. Global direct radiative forcing due to multicomponent anthropogenic and natural aerosols. Journal of Geophysical Research 16, Katsoulis, B.D., The potential for long-range transport of air-pollutants into Greece: a climatological analysis. The Science of the Total Environment 231, Kaufman, Y., Tanre, J.D., Boucher, O., 22. A satellite view of aerosols in the climate system. Nature 419, Koc-ak, M., Nimmo, M., Kubilay, N., Herut, B., 24a. Spatio temporal aerosol trace metal concentrations and sources in the Levantine Basin of the eastern Mediterranean. Atmospheric Environment 38, Koc-ak, M., Kubilay, N., Mihalopoulos, N., 24b. Ionic composition of lower tropospheric aerosols at a northeastern Mediterranean site: implications regarding sources and longrange transport. Atmospheric Environment 38, Koc-ak, M., Kubilay, N., Mihalopoulos, N., 27. Contributions of natural sources to high PM 1 and PM 2.5 events in the eastern Mediterranean. Atmospheric Environment 41, Kubilay, N., Saydam, C., Trace elements in atmospheric particulates over the eastern Mediterranean: concentration, sources and temporal variability. Atmospheric Environment 29, Kubilay, N., Nickovic, S., Moulin, C., Dulac, F., 2. An illustration of the transport and deposition of mineral dust onto the eastern Mediterranean. Atmospheric Environment 34, Kubilay, N., Koc-ak, M., C- okacar, T., Oğuz, T., Kouvarakis, G., Mihalopoulos, N., 22. Influence of Black Sea and local biogenic activity on the seasonal variation of aerosol sulfur species in the eastern Mediterranean atmosphere. Global Biogeochemical Cycles 16 (4), 179, doi:1.129/ 22GB188. Kubilay, N., Oğuz, T., Koc-ak, M., 25. Ground-based assessment of total ozone mapping spectrometer (TOMS) data for dust transport over the northeastern Mediterranean. Global Biogeochemical Cycles 19, GB122, doi:1.129/ 24GB237. Mamane, Y., Gottlieb, J., Nitrate formation on sea-salt and mineral particles a single particle approach. Atmospheric Environment 26A, Moulin, C., Lambert, E., Dayan, U., Masson, V., Ramonet, M., Bousquet, P., Legrand, M., Balkanski, Y.J., Guelle, W., Marticorena, B., Bergametti, G., Dulac, F., Satellite climatology of African dust transport in the Mediterranean atmosphere. Journal of Geophysical Research 13, Putaud, J.P., Van Dingenen, R., Dell acqua, A., Raes, F., Matta, E., Decesari, S., Facchini, M.C., Fuzzi, S., 24. Sizesegregated aerosol mass closure and chemical composition in Monte Cimone (I) during MINATROC. Atmospheric Chemistry and Physics 4, Querol, X., Alastuey, A., Rodriguez, S., Plana, F., Ruiz, C.R., Cots, N., Massague, G., Puig, O., 21. PM 1 and PM 2.5 source apportionment in the Barcelona Metropolitan area, Catalonia, Spain. Atmospheric Environment 35, Rahn, K.A., Huang, S., A graphical technique for distinguishing soil and atmospheric deposition in biomonitors from the plant material. The Science of the Total Environment 232, Ramanathan, V., Crutzen, P.J., Kiehl, J.T., Rosenfeld, D., 21. Aerosols, climate, and the hydrological cycle. Science 294, Rodriguez, S., Querol, X., Alastuey, A., Plana, F., 22. Sources and processes affecting levels and composition of atmospheric aerosol in the western Mediterranean. Journal of Geophysical Research 17 (D24), 4777, doi:1.129/21jd1488. Schwartz, S.E., Andreae, M.O., Uncertainty in climate change caused by anthropogenic aerosols. Science 272, Sciare, J., Bardouki, H., Moulin, C., Mihalopoulos, N., 23. Aerosol sources and their contribution to the chemical composition of aerosols in the Eastern Mediterranean Sea during summertime. Atmospheric Chemistry and Physics 3, Singh, M., Jaques, P.A., Sioustas, C., 22. Size distribution and diurnal characteristics of particle-bound metals in source and receptor sites of the Los Angeles Basin. Atmospheric Environment 36, Szabo, G.y., Borbely-Kiss, I., PIXKLM computer package for PIXE analyses. Nuclear Instruments and Methods in Physics Research, B 75, Turekian, K.K., Oceanography. Printice-Hall, Englewood Cliffs, NJ. Underwood, G.M., Song, C.H., Phadnis, M., Carmichael, G.R., Grassian, V.H., 21. Heterogeneous reactions of NO 2 and HNO 3 on oxides and mineral dust: a combined laboratory and modeling study. Journal of Geophysical Research 16 (D16), 18,55 18,66.
57 7368 ARTICLE IN PRESS M. Koc-ak et al. / Atmospheric Environment 41 (27) Usher, C.R., Michel, A.E., Grassin, V.H., 23. Reactions on mineral dust. Chemical Reviews 13, Vrekoussis, M., Liakakou, E., Koc-ak, M., Kubilay, N., Oikonomou, K., Sciare, J., Mihalopoulos, N., 25. Seasonal variability of optical properties of aerosols in the eastern Mediterranean. Atmospheric Environment 39, Washington, R., Todd, M., Middleton, N.J., Andrew S. Goudie, A.S., 23. Dust-storm source areas determined by the total ozone mapping spectrometer and surface observations. Annals of the Association of American Geographers 93 (2), Wedepohl, K.H., The composition of the continental crust. Geochemica Cosmochimica Acta 59, Yang, F., He, K., Ye, B., Chen, X., Cha, L., Cadle, S.H., Chan, T., Mulawa, P.A., 25. One-year record of organic and elemental carbon in fine particles in downtown Beijing and Shanghai. Atmospheric Chemistry and Physics 5,


58 Atmospheric Research 92 (29) Contents lists available at ScienceDirect Atmospheric Research journal homepage: Origin and source regions of PM 1 in the Eastern Mediterranean atmosphere Mustafa Koçak a, Nikos Mihalopoulos b, Nilgün Kubilay a, a Institute of Marine Sciences, Middle East Technical University, P.O. Box 28, 33731, Erdemli-Mersin, Turkey b Environmental Chemical Processes Laboratory, Department of Chemistry, University of Crete, P.O. Box 228, Gr-713 Voutes, Heraklion, Greece article info abstract Article history: Received 22 July 28 Received in revised form 14 January 29 Accepted 18 January 29 Keywords: Source apportionment Mass closure Absolute principle factor analysis Positive matrix factorization PM 1 A set of daily PM 1 (n=281) samples collected from April 21 to April 22 at a rural site (Erdemli), located on the coast of the Eastern Mediterranean, were analyzed applying Mass Closure (MC), absolute principal factor analysis (APFA) and Positive Matrix Factorization (PMF) to determine source contributions. The results from the three techniques were compared to identify the similarities and differences in the sources and source contributions. Source apportionment analysis indicated that PM 1 were mainly originated from natural sources (sea salt+crustal 6%) whilst secondary aerosols and residual oil burning accounted for approximately 2% and 1% of the total PM 1 mass, respectively. Calculations for sulfate showed that on average 8% and 12% of its total concentration were originated from sea salt and biogenic emissions, respectively. However, the contribution by biogenic emissions may reach up to a maximum of ~4% in the summer. Potential Source Contribution Function (PSCF) analysis for identification of source regions showed that the Saharan desert was the main source area for crustal components. For secondary aerosol components the analysis revealed one source region, (i.e. the south-eastern Black Sea), whereas for residual oil, Western Europe and the western Balkans areas were found to be the main source regions. 29 Elsevier B.V. All rights reserved. 1. Introduction Atmospheric aerosols (or particulate matter, PM) have the potential to play an important role in modifying and/or altering climate, hydrological cycles, chemistry of the atmosphere, biogeochemical cycles and public health (Mamane and Gottlieb, 1992; Lelieveld et al., 22; Markaki et al., 23; Carbo et al., 25; Griffin et al., 27). The PM 1 fraction of aerosols is defined as particles with diameters smaller than 1 µm. Owing to the potential adverse health and environmental impacts, legislation of the PM concentration limits has been established in many regions of the world including the European Union. The annual and daily PM 1 values have been limited to 4 µg m 3 and 5 µg m 3 (which may only be exceeded for 35 days), respectively while annual PM 2.5 value has been limited to 17 µg m 3 as addressed by Directive 28/5/EC of the European Parliament and the Council of 21 May 28 on ambient air quality and cleaner Europe. Corresponding author. Tel.: ; fax: address: kubilay@ims.metu.edu.tr (N. Kubilay). Identification of the concentration, composition, origin, transport and geographical distribution of PM in Mediterranean atmosphere has been the subject of research activities since the last two decades as it is heavily affected by two contrasting sources; namely mineral dust (mainly from Sahara Desert) and various anthropogenic (from industrialized/semi-industrialized countries) emissions (Dulac et al., 1987; Kubilay and Saydam, 1995; Avila et al., 1998; Moulin et al., 1998). In recent years there has been an increasing number of studies published on PM 1 concentrations in the western Mediterranean (Artinano et al., 21; Rodriguez et al., 22; Querol et al., 24; Salvador et al., 24; Viana et al., 28). These studies have evaluated the natural and anthropogenic contributions to ambient PM 1 in western Mediterranean atmosphere. The general findings may be summarized as follows: (a) PM 1 concentrations in the western Mediterranean atmosphere increase from rural to kerbside, (b) the contribution to PM 1 of anthropogenic sources decreases from urban/industrialized/kerbside sites towards rural sites, and (c) PM 1 levels observed both in rural and urban sites are considerably affected by high mineral dust /$ see front matter 29 Elsevier B.V. All rights reserved. doi:1.116/j.atmosres
59 M. Koçak et al. / Atmospheric Research 92 (29) concentrations during African dust outbreaks. However, only a limited number of studies have been conducted on PM 1 concentrations in the Eastern Mediterranean atmosphere (Andreae et al., 22; Kouyoumdjian and Saliba, 25; Gerasopoulos et al., 26; Koçak et al., 27a,b). These studies indicate that PM 1 levels at regional background sites within the boundary layer in the Eastern Mediterranean are mainly related to the proximity of sampling sites to arid regions (e.g. the Sahara Desert and the Middle East). A number of approaches have been adopted including; Mass Closure, chemical mass balance, absolute principal factor analysis and Positive Matrix Factorization (Thurston and Spengler, 1985; Paatero and Tapper, 1994; Bardouki et al., 23; Viana et al., 28) to identify sources and their contributions to a complex mixture of soluble and insoluble species associated with aerosols. Coupled with source apportionment techniques air mass back trajectories have been used to deduce potential source regions of aerosols. For instance clustering of trajectories, residence time analysis and Potential Source Contribution Function techniques have been successfully applied in the field of atmospheric studies (Ashbaugh et al., 1985; Dorling et al., 1992; Brankov et al., 1998; Cape et al., 2; Salvador et al., 24; Güllü et al., 25). However, in the Mediterranean region relatively limited research has been carried out on the identification of potential source regions of aerosol components in particulate matter and few comparisons between the various source apportionment techniques have been performed. To understand the origin of aerosols in the north Eastern Mediterranean, for the current study, source apportionment has been performed by applying Mass Closure, absolute principal factor analysis and Positive Matrix Factorization. The results from the three techniques have been compared to determine similarities and differences in sources and source contributions. In addition, potential source regions of detected sources will be identified by using the Potential Source Contribution Function. 2. Materials and methods 2.1. Aerosol sampling and analytical measurements Daily two-stage aerosol filters were collected from a rural site located on the coastline of the Eastern Mediterranean, Erdemli ( N and E, at about 22 m above sea level and 1 m away from sea), Turkey (for more details see Kubilay and Saydam, 1995; Kubilay et al., 22; Koçak et al., 24a,b) between April 21 and April 22. A total of 281 PM 1 (coarse+fine) aerosol samples were collected on 8. μm and.4 μm apiezon coated Nuclepore polycarbonate filters, respectively, using a low volume sampler (Gent type PM 1 stack filter unit). After collection of aerosol filters, PM and PM 2.5 concentrations were determined gravimetrically. Water-soluble ions were measured by ion chromatography (IC) at Environmental Chemical Processes Laboratory (ECPL), University of Crete, following the method described in details by Bardouki et al. (23). Concentrations of the elements (Fe, Ti, Ca, Mn, K, Cr, V, Zn) were obtained using 2 cm 2 of the filter sample applying proton-induced X-ray emission (PIXE) at ATOMKI (Institute of Nuclear Research of the Hungarian Academy of Sciences, Debrecen, Hungary) as described by Borbely-Kiss et al. (1999). Details on sampling and analysis of aerosols filters are given in Koçak et al. (27a,b) Air mass back trajectories Air masses back trajectories arriving at the sampling site were computed by the Hysplit Dispersion Model (Hybrid Single Particle Langrangian Integrated Trajectory; Draxler and Hess, 1998) and were illustrated by one-hour endpoint locations in term of latitude and longitude. Daily back trajectories were evaluated for 3 days for four different heights above the starting point at ground level (1, 2, 3 and 4 m AGL). However, in order to calculate residence times of air mass back trajectories only the 1 m and 4 m altitudes were used Source apportionment techniques Various apportionment techniques such as Mass Closure (MC), absolute principal factor analysis (APFA) and Positive Matrix Factorization (PMF) have been applied by various researchers to identify sources of aerosol (Thurston and Spengler, 1985; Paatero and Tapper, 1994; Huang et al., 1999; Bardouki et al., 23; Song et al., 28; Viana et al., 28). Below a short description of these techniques is given. (a) MC: Is the easiest and simplest from all apportionment techniques since calculations are obtained directly from measured species. However, this technique is not able to provide information on how does aerosol species co-vary as well as their underlying sources. (b) APFA: It can be directly run from a spreadsheet which makes it easy. There are also options for selecting elements, handling missing data and extracting various numbers of factors. The main disadvantage is that loadings and factor scores may have negative values which are not desirable for quantitative analysis. (c) PMF: It constrains factor loadings and factor scores to nonnegative values and it separates sources better than APFA. The major disadvantage is that missing values and limits should be eliminated of filled by user, becoming time consuming compared to APFA. Although MC, APFA and PMF have their own advantages and drawbacks, the simultaneous use of these techniques can provide valuable info to the researchers. For Mass Closure (MC): (a) the total amount of mineral dust was estimated using Fe concentrations assuming a relative ratio to the upper crust of 3.89% (Wedepohl, 1995), (b) the sea salt contribution was calculated from Na + concentrations assuming that Na + has a pure marine origin, (c) ionic mass is the sum of nssso 4 2 ;NO 3,C 2 O 4 2,NH 4 +, nssk + and nssmg 2+. Non-sea salt levels of the species were calculated using Na + as the tracer and the standard sea water composition (Turekian, 1976). Factor analysis is commonly used in environmental studies to deduce sources from data (Thurston and Spengler, 1985; Salvador et al., 24; Güllü et al., 25). The principal application of factor analysis is to reduce the number of variables. Therefore, factor analysis can be applied as a data reduction method. Hence, for each PM 1 aerosol component identified the factor score can be computed for each sample.
60 466 M. Koçak et al. / Atmospheric Research 92 (29) Mass loadings for the samples can then be regressed on the AFCS (Absolute Factor Component Scores) to estimate the mass contributions (for more details see Thurston and Spengler, 1985). The Positive Matrix Factorization model was described in detail by Paatero and Tapper (1994) and Paatero (27). In PMF any data matrix X having n rows (number of samples) and m columns (number of species) can be factorized into two matrices, namely G (n p) and F (p m) and the residual part E, where p denotes the number of factors extracted. X = GF + E G is the source contribution matrix with extracted factors (sources) and F is a source profile matrix. The details of the algorithm for PMF are provided by Paatero (27). The PMF has ability to handle missing and below detection limits data adjusting the corresponding error estimates. However during this study, missing data were removed from the data spreadsheet and uncertainties in the data were calculated using an ad hoc formula (Anttila et al., 1995) since the concentrations of each species were found to be higher than their detection limits. Therefore, in order to calculate uncertainties square root of the 5% of the measured species plus the detection limit was applied. In the concurrent analysis n (days)=265 and m (chemical species)=18 (identical matrix was used for MC and APFA analysis). The robust mode of PMF2 has been applied for analyzing the dataset. It can avoid excessively large values in the dataset, which can disproportionally affect the results. The parameter α is referred to as the outlier distance. Data values lying more than α standard deviations above or below the fitted value will be treated as outliers and receive a decreased weight in PMF2. Values of 2., 4. and 8. were suggested by Paatero (27) for outlier distance to achieve easier comparison of results obtained by different researchers. During the application of PMF2 the vales α=2. was used in the study. Error model 14 and C 3 =.1 have been applied during this study (Lee et al., 1999; Paatero, 27). The PMF program allows one to repeat the analysis from random starting points to test if global minimum solution is achieved. For this purpose, the analysis was allowed to repeat ten times from ten pseudorandom starting points and the Q values were not very different from each other. There is no mathematical criterion to extract the correct number of factors. However, the observed Q and scaled species residuals can be helpful. The observed Q should not be less than the theoretical Q since this would mean that the model predicted the observed data better than it could be based on the uncertainty (Rizzo and Scheff, 27). Expected Q value can be calculated by formula [Q expected =nm p(n+ m)] given by Paatero et al. (22). Scaled residuals did not indicate a tendency to mainly positive, negative and/or very small values and showed a random pattern of positive and negative values, most of them being between 2. and 2. (more than 95%). Therefore, six factors were found to give the most reasonable results (Q =3379N Q expected =372). An increase in the number of factors resulted in less meaningful sources and the Q value (272) was less than expected (2789). The decrease being caused by a combination of distinct sources. After the number of factors was determined, PMF ð1þ was run with different F peak values to explore the rotational freedom. A rotational matrix (Rotmat) in PMF is utilized to reveal if factors have rotational freedom. Choosing the largest element in Rotmat can show the worst case in the rotational freedom (Lee et al., 1999). Taking into account the variation in the Q value and the largest element in Rotmat, the F peak value was adjusted to.1 during the application of PMF Potential Source Contribution Function (PSCF) A 2 longitude 2 latitude cells grid has been superimposed over the region defined by 1 N 76 N and 2 W 5 E. The residence time and special residence time analysis then were calculated using the formula given below by Ashbaugh et al. (1985) n ij PA ij = N m ij PB ij = N where n ij is the number of trajectory segment endpoints that fall in the ijth cell during a time interval T, m ij is the number of segment points in the ijth cell for those trajectories which arrive at the receptor site when the aerosol species concentration is higher than the threshold values, N is the total number of endpoints computed for the time interval and P[A ij ]andp[b ij ] represent the residence time probability of the randomly selected air parcel in the ijth cell relative to the total time interval T and special residence time probability, respectively. Subsequently Potential Source Contribution Functions were evaluated by dividing P[B ij ]withp[a ij ]. 3. Results and discussion 3.1. Source apportionment for PM 1 The Mediterranean atmosphere can be influenced by three strong, but distinct aerosol sources: (a) crustal dust, (b) sea salts and (c) anthropogenic emissions. Therefore, identification of the sources and estimation of the contribution made by each source to the particulate matter is of importance. In order to achieve this and compare results from different approaches, Mass Closure (MC), Absolute Principle Factor Analysis (APFA) and Positive Matrix Factorization (PMF) were applied Mass Closure (MC) Fig. 1 presents daily contributions of the each source to PM 1. Ionic mass (Fig. 1a) exhibited higher contributions particularly in the summer owning to enhanced production of secondary aerosols under the conditions prevailing over the Eastern Mediterranean region during the summer (Mihalopoulos et al., 1997; Koçak et al., 24b). Contribution of sea salt (Fig. 1b) was found to be higher in winter. Storms are more frequent and more intense during the winter period due to thermal gradient between warm sea and intrusions of cold continental air masses. Therefore, in winter unsettled weather conditions enhanced the concentrations of sea salt ions throughout severe sea spray generation (Koçak et al., ð2þ ð3þ
61 M. Koçak et al. / Atmospheric Research 92 (29) µg m 3 when air masses reaching the Erdemli originated from North Africa. Fig. 2 shows crustal, sea salt and ionic mass contributions for dust and non-dust events. Contribution of crustal component was found approximately 5 times higher during mineral dust transport from North Africa than during non-dust events (Crustal Dust 4 µg m 3 ; Crustal Non-Dust 8 µgm 3 ). On the other hand there was no difference for sea salt and ionic mass contributions during dust and nondust events. As a result, chemical composition is predominantly affected by crustal load due to mineral dust transport from North Africa Absolute Principle Factor Analysis (APFA) The result of varimax-rotated factor analysis is presented in Fig. 3a for aerosol species in PM 1. The data for PM 1 can be interpreted on the basis of four common factors. The first factor can be characterized as a being representative of a crustal source since it is heavily influenced by the concentrations of Ti, Fe, Mn, Ca 2+ and K +. The second factor can be identified as representing the marine source, since it consists of high loadings of Na +,Cl,Mg 2+ and Br. The third factor has high loadings of SO 4 2,NH 4 +,MS,C 2 O 4 2,NO 3 and Zn. This factor, therefore, maybe ascribed to secondary aerosols as it has high loadings of sulfate, ammonium, methanesulfonate, nitrate and oxalate. The fourth has high loadings of V and Ni (moderate loadings of Zn and Cr) and hence may be attributed to residual oil combustion. Fig. 1. Daily contributions of each source to ionic mass (a), sea salt (b), PM 1 crustal (c). 24b). The winter minimum of crustal load could be attributed to the frequent removal of atmospheric particles via wet deposition and damp soil on both the local and surrounding landmasses due to precipitation. Even though substantial rain events were detected in the transitional periods, crustal (Fig. 1c) contribution was highest in March, April and May months due to the well documented transport from North Africa and rarely from the Middle East (Kubilay and Saydam, 1995; Kubilay et al., 2; Koçak et al., 24a) which is often associated with intense sporadic peaks of mineral dust. Aerosol Fe concentrations higher than 5 ng m 3 (as threshold values), corresponding air mass back trajectories and satellite images obtained from TOMS (Total Ozone Mapping Spectrometer) were utilized in order to refine mineral dust events at Erdemli during sampling period. During this period 34 dust days were identified by an abrupt increase in the concentrations of Fe, Ti, Mn, and Ca. It should be noted that Fe, Ti and Mn for dust and non-dust events show strong correlation between each other (R 2 N.9) whereas these species indicate weak correlation coefficients with pollutants such as Zn, V and Ni (R 2 b.28). Therefore, these relationships suggest that Fe, Ti and Mn are mainly originated from crustal source during dust and non-dust events. The highest mineral dust concentration was observed on the 13th of May 21 with a value of more than Positive Matrix Factorization (PMF) The result of identified sources using PMF2 (version 4.2) is shown in Fig. 3b. The first factor analysis consists of mainly Fe, Ti, Mn, Ca and K which are typical of crustal dust. The second factor is mainly formed by Na +,Cl,Mg 2+ and Br. Based on these species the assigned source would be sea salts. The third factor explains more than 7% of the total nitrate concentration. This factor was also related to the first and second factors which characterize reactions between acidic nitrate and sea salt/crustal sources. The fourth factor consists of principally ammonium and sulfate. This source represents around 98% of the total ammonium concentration. The calculated equivalent ratio of NH 4 + and SO 4 2 is ~.8 which shows that sulfate is not sufficiently neutralized by ammonium (for more details see Koçak et al., 27b). The fifth factor is predominantly influenced by methanesulfonate. It is worth mentioning that sulfate found in this source accounts for ~9% of the total Fig. 2. Contributions of crustal, sea salt and ionic mass to PM 1 for dust and non-dust events.
62 468 M. Koçak et al. / Atmospheric Research 92 (29) Fig. 3. Source profiles for PM 1 from APFA (a) and PMF (b). sulfate concentration which is consistent with results presented in Section 3.2. The sixth factor might be attributed to residual oil burning since this source can be characterized by high explained variation values of V and Ni (~7%) Comparison of three techniques and source apportionment Estimated PM 1 concentrations from MC, APFA and PMF against measured concentrations of PM 1 are presented in Fig. 4a, b and c, respectively. The slope of the regression lines for three estimates (Fig. 4) showed values close to unity. Although there is no statistical difference between techniques, from regression analysis, the best estimated values is õobserved for PMF with an intercept around 2 (Unknown=5%) and R 2 =.96. The results observed for APFA were similar; however a higher value was calculated for the intercept, being around 3 (Unknown=8%). The MC technique is clearly able to identify sea salt and crustal sources but not the others. In addition, APFA was able to determine only 4 sources whilst PMF was able to identify 6 sources. The main difference between APFA and PMF was the identification of secondary aerosols. PMF was clearly able to define secondary aerosols into three distinct groups namely: ammonium bisulfate, nitrate and biogenic. The relative estimated contributions from each of the identified sources to the PM 1 according to the different techniques are shown in Fig. 5. Considering the three estimation techniques, the largest portion of PM 1 is attributable to the sea salt and crustal related sources. MC exhibited the largest unidentified fraction (15%) of the PM 1, since it depends upon a simple mathematical calculation and hence resulted in the lack of ability to extract additional sources such as residual oil. For example, on 2th of February 22 (PM 1 =37.6 µg m 3 ), unidentified fraction calculated from MC reached up to ~3% when residual oil contribution was found ~28%. In general, MC, APFA and PMF produced almost identical contributions of sea salts (31 33%), crustal (28 31%) and secondary aerosols (22 24%) (ionic mass for MC) in PM 1. Whilst PMF indicated a lower crustal contribution (28%) and a higher contribution of residual oil (1%) to PM 1 compared to APFA (31% and 7%, respectively). This variation might be attributed to differences in source profiles extracted from PMF and APFA. Although quantitatively it is not possible to compare contributions of residual oil and crustal sources to
 464 474 469 total species concentrations due to the different units, it is evident from extracted sources that Ca demonstrated different portionings between two")
63 M. Koçak et al. / Atmospheric Research 92 (29) total species concentrations due to the different units, it is evident from extracted sources that Ca demonstrated different portionings between two profiles in PMF and APFA. For example, whilst Ca had a very high loading (.88) in crustal sources in APFA, only 47% of the Ca originated from crustal sources in PMF. Overall, results from three techniques showed the dominance of natural sources (crustal and sea salt sources; 61 63% of the total) in PM 1, whereas secondary aerosols accounted for 22 24% of the total PM 1. Fig. 4. Comparison of observed daily levels and estimated form MC (a), APFA (b) and PMF (c) for PM 1. Fig. 5. Source apportionment from Mass Closure and Absolute Principle Factor Analysis and Positive Matrix Factorization for PM 1.

64 47 M. Koçak et al. / Atmospheric Research 92 (29) Source apportionment for sulfate Non-sea-salt sulfate shows strong seasonal cycles with a winter minimum and a summer maximum (Fig. 6a). The lowest concentrations were found during winter when nssso 4 2 averaged around 2 µg m 3. Monthly mean concentrations of this anion in January and February were observed, similar to those observed for March and April. Elevated concentrations were found during the summer (particularly from June to August) when nssso 4 2 averaged more than 6 µg m 3. The considerable increase in the concentration of nssso 4 2 from winter to summer may be a result of several different processes: photochemistry, wet precipitation, biogenic sulfur and change in atmospheric transport. During summer, homogeneous conversion of SO 2 to particulate SO 4 2 has been suggested as the main oxidation mechanism under conditions prevailing over the Eastern Mediterranean region (Luria et al., 1996; Mihalopoulos et al., 27). Moreover, conversion rates of SO 2 to sulfate indicate a strong seasonal cycle with a winter minimum and a summer maximum in the Eastern Mediterranean (Erduran and Tuncel, 21). These authors suggest that the observed low conversion rates during winter occur because of low solar flux. In addition, in summer, particles are accumulated in the atmosphere as a consequence of the low frequency of rain events. High sulfate levels during the summer have been attributed to biogenic sulfur emissions (Ganor et al., 2; Kubilay et al., 22). Additionally, Mihalopoulos et al. (1997), applying air mass back trajectories, indicated that the highest nssso 4 2 concentrations are associated with transport from Eastern and Central Europe in summer when dry deposition is the main removal mechanism for aerosol particles. In order to calculate the biogenic fraction of nssso 4 2 the formula suggested by Bates et al. (1992) was used since it is principally dependent upon temperature. The formula reflects a simple linear relationship between temperature and [MS ]/[nssso 4 2 ] which Bates et al. (1992) found to be a good approximation for the observed values in unpolluted marine sites in the Southern Hemisphere. The formula proposed by Bates et al. (1992) is given as fallows: R = 1:5 Tð CÞ+42:2 where R is the [MS ]/[nssso 4 2 ] ratio, T ( C) is temperature. However, it should be noted that application of above formula for Eastern Mediterranean is still under debate since Bates et al. (1992) equation was derived for lower temperatures and lower nitrate concentrations than those observed during summer over Eastern Mediterranean. Therefore, one should keep in mind that prevailing summer conditions and high nitrate levels may cause over estimated biogenic sulfur contribution and this formula should be tested by approaches like use of sulfur isotopes. On the other hand, biogenic contribution from this formula has been compared for Eastern Mediterranean by an alternative calculation based on DMS data (Ganor et al., 2; Kouvarakis and Mihalopoulos, 22). Two assumptions yielded similar biogenic contribution on observed nssso 4 2. Mihalopoulos et al. (1997) calculating that the biogenic emission contributions ranged from.6 to 28.3% of the total nssso 4 2 at Finokalia, Crete (Central Mediterranean). Fig. 6. Monthly average non-sea salt sulfate concentrations (a) and monthly biogenic sulfate contribution to non-sea salt sulfate.
 of the nssso 4 2 from biogenic origin in aerosol samples collected from the Israeli coast. Monthly biogenic contributions to non-sea salt sulfate are represented in Fig. 6b.")
65 M. Koçak et al. / Atmospheric Research 92 (29) Similar results were found by Kouvarakis and Mihalopoulos (22) for the same station. Ganor et al. (2) determined that 11% (ranged from 5.6% to 22%) of the nssso 4 2 from biogenic origin in aerosol samples collected from the Israeli coast. Monthly biogenic contributions to non-sea salt sulfate are represented in Fig. 6b. During the winter months (January, February and December) the mean biogenic contributions were found to be negligible with a value around 1%. In March the biogenic contribution was also very low. However, from April to May the biogenic contribution increased gradually and the mean contribution ranged from 4% in April to 8% during May. The highest mean biogenic contributions were found in the summer and ranged from 17% in June to 38% in July and August. On average about 12% of the non-sea salt sulfate was evaluated as biogenic sulfate. Based on this calculation, unlike remote marine sites the Mediterranean site is heavily influenced by anthropogenic sulfate emissions. Moreover, calculated values indicated that even during the summer period anthropogenic sulfur sources are the predominant source in Mediterranean atmosphere. In Turkey, approximately 3% of the power generation is obtained by high sulfur containing coal burning (Say, 26). Therefore, high conversion rates of SO 2 to SO 4 2 coupled with high SO 2 emissions from this source might be suggested as one of the reasons of anthropogenic origin of sulfate Potential Source Contribution Function (PSCF) Analysis The PSCF analysis has been applied to sources identified in the PM 1 (see Fig. 3a) by factor analysis: crustal, secondary and residual oil. Sea spray is produced by bubble bursting which commences at a wind speed of about 3 4 ms 1 Fig. 7. Distribution of PSCF values for factor scores higher than 1 of crustal (1 m, a), crustal (4 m, b), secondary (c) and residual oil (d). Only statistically significant PSCF values at the 95% confidence level are shown.
, did not find significant changes in Na + concentrations between short and long fetch samples collected on board the R/V L'Atalante and they suggested that the production of new sea salts takes")
66 472 M. Koçak et al. / Atmospheric Research 92 (29) (O'Dowd et al., 1997) and hence related highly with local meteorological parameters. Indeed, Sellegri et al. (21), did not find significant changes in Na + concentrations between short and long fetch samples collected on board the R/V L'Atalante and they suggested that the production of new sea salts takes place rapidly during the first 25 km. Therefore, PSCF for sea salt was not evaluated. Since the data have been previously normalized (for more details see Thurston and Spengler, 1985), this means that means and standard deviations are equal to values of and 1, respectively. In order to obtain a special case, residence time probability maps, representing P[B ij ], were constructed by trajectories which ended at Erdemli when factor scores of each source were higher than 1 (higher than the standard deviation). Calculated PSCF values were subdivided into five categories: (a) very weak (..2), (b) weak (.2.4), (c) intermediate (.4.6) and (d) strong (.6 1.). Calculated PSCF values in some areas occur by chance. Therefore, it is essential to check the statistical significance of every grid cell PSCF value. Two statistical tests to check significance were adopted; bootstrap technique and binomial distribution (Vasconcelos et al., 1996; Salvador et al., 24). The binomial distribution technique was applied since it has an easier computation compared to the bootstrap method. Therefore, only PSCF values statistically significant at the 95% confidence interval have been considered in the analysis Crustal source The PSCF map for the lower pressure level (1 m above the sea level; see Fig. 7a) indicated that the strong potential probabilities are located at North Africa particularly the Eastern Sahara desert. From the map for the lower pressure level it might be suggested that the Eastern Sahara (particularly the central Libyan Desert fourth strongest source in the world with average AI N1.5; Washington et al., 23) is one of the important source of the mineral dust transported into the Eastern Mediterranean region. In addition, with strong PSCF values northern Algeria appeared as another source for crustal material. The PSCF map for the higher pressure level (4 m; see Fig. 7b) is more representative of the Sahara desert since dust transport mainly takes place at high altitudes (Kubilay et al., 2, 25; Kalivitis et al., 27). In contrast to the lower layer PSCF map, the higher level layer PSCF map showed various source areas in the Sahara desert primarily including a large area 22 3 N and 1 W to 2 E covering patches of central/southern Algeria, northern Mali/ Mauritania and Western Sahara. The Bodele depression appeared to be an additional source region. Interestingly, these findings are similar to recent results of Engelstaedter and Washington (27) who, applying long term mean of the satellite derived TOMS Aerosol Index, have highlighted major dust producing areas in North Africa; region in Central Chad known as the Bodele depression and a large region in West Africa covering of Mauritania, Mali and Algeria Secondary aerosol source The PSCF map obtained for the secondary aerosol source (see Fig. 7c) does not clearly indicate any source regions, except the south-eastern Black Sea. Recently, Kubilay et al. (22) have observed higher nssso 4 2 and MS concentrations for air masses originating from the Black Sea and proposed medium range transport of these water soluble ions due to DMS-producing phytoplankton species such as coccolithophorids, flagellates, etc. Hence, high PSCF values for this source over the south-eastern Black Sea imply that biogenic activities taking place in the Black Sea is an important source for this group. Biomass burning from regions surrounding Black Sea might be suggested as an additional source for secondary aerosol (Sciare et al., 28). Recently, for Erdemli site it has been shown that excess-k/bc presented two distinct ratios for winter (.6) and summer (.34), indicating two different sources: fossil fuel burning in winter and biomass burning in summer (Koçak et al., 27b). Nevertheless, the lack of relationship between BC and this ratio with secondary aerosol suggests that this component is not significantly affected by biomass burning. However, lack of high PSCF values for secondary aerosol sources suggests that this class of particles is strongly influenced by local sources mainly under the prevailing summer conditions Residual oil source The PSCF map derived for the residual oil source (see Fig. 7d) denoted that the sampling site was under the influence of several possible source regions. The main source areas are Southern Germany, Northern Italy, Eastern France, Central Poland, the former Republic of Yugoslavia and Albania. In order to compare results from the PSCF map for the residual oil source, EPER ( emissions for Ni-compounds in Europe for 21 were used. The obtained data were divided into 2 2 grid cells and Ni emissions were calculated for each grid cell. Fig. 8 shows the emissions for Europe and from the map it is clear that there are no available emission data for Eastern Europe. As can be deduced from the map Spain, Italy, Germany, Holland and Belgium are the important emitters of the Ni into the atmosphere. The highest emission source regions do not exactly match the source regions obtained from the PSCF map however; there is a good match for Northern Italy and Southern France. This discrepancy Fig. 8. Emissions of Ni-compounds into the atmosphere in Europe. Derived from EPER data for 2 2 grid cell.
67 M. Koçak et al. / Atmospheric Research 92 (29) might be attributed to the applied technique which assumes that chemical species emitted within a grid cell is swept into the air parcel and transported to the receptor site without loss due to atmospheric deposition particularly through wet scavenging. 4. Conclusions In this study, statistical techniques were successfully applied to identify sources and source regions of PM 1 in the Eastern Mediterranean atmosphere. Inspection of measured and estimated concentrations using three techniques (Mass Closure, absolute principal factor analysis and Positive Matrix Factorization) showed good agreement considering regression analysis. Amongst the techniques, Mass Closure was found the least successful since it demonstrated the highest unknown (scatter as well) and was not able to define minor sources such as residual oil. PMF was found more efficient than APFA since it had the ability to classify secondary aerosols into three distinct groups (Ammonium bisulfate, nitrate and biogenic). Results from all applied techniques highlighted the dominance of natural sources (sea salt and crustal; 61 63%). Calculations for sulfate indicated that on average 8% and 12% of its total concentration are originated from sea salt and biogenic emissions. However, the contribution from biogenic emissions can reach up to ~4% during the summer months. Potential Source Contribution Function analysis highlighted that the Saharan desert is the main source area for crustal components. Secondary aerosol components could only be associated with the south-eastern Black Sea, whereas, Southern Germany, Northern Italy, Eastern France, Central Poland, the former Republic of Yugoslavia and Albania was identified as the main source regions for residual oil. Acknowledgements This work has been conducted in the frame of the Greek Turkish bilateral project funded by GSRT (Greece) and TUBITAK (Turkey, Project No: 15Y368). It was also funded in part by the Middle East Technical University (AFP ) and WMO (through special service agreements of 5.115/A/CNS and /A/CNS). Mustafa Koçak benefited from the research fellowships of the International Atomic Energy Agency (TUR//6) and RICAMERE (Research In Global Change in the Mediterranean, European Union- ENRICH program) project. We acknowledge co-operation with I. Borbely-Kiss whose generous help allowing Mustafa Koçak to use PIXE for the analysis of elements at ATOMKI. References Andreae, T.W., Andreae, M.O., Ichoku, C., Maenhaut, W., Cafmayer, J., Karnieli, A., Orlovsky, L., 22. Lightscattering by dust and anthropogenic aerosol at a remote site in the Negev Desert, Israel. Journal of Geophysical Research 17 (D2). doi:1.129/21jd252. Anttila, P., Paatero, P., Tapper, U., Jarvinen, O., Source identification of bulk wet deposition in Finland by positive matrix factorization. Atmospheric Environment 29, Artinano, B., Querol, X., Salvador, P., Rodriguez, S., Alonso, D.G., Alastuey, A., 21. Assessment of airborne particulate levels in Spain in relation to the new EU-directive. Atmospheric Environment 35, Ashbaugh, L., Malm, W., Sadeh, W., A residence time probability analysis of sulfur concentrations at Grand Canyon National Park. Atmospheric Environment 19, Avila, A., Alarcon, M., Queralt-Mitjans, I.,1998. The chemical composition of dust transported in red rains its contribution to the biogeochemical cycle of a Holm oak forest in Catalonia, Spain. Atmospheric Environment 32, Bardouki, H., Liakakou, H., Economou, C., Sciare, J., Smolik, J., Zdimal, V., Eleftheriadis,K.,Lazaridis,M.,Dye,C.,Mihalopoulos,N.,23.Chemical composition of size resolved atmospheric aerosols in the Eastern Mediterranean during summer and winter. Atmospheric Environment 37, Bates, T.S., Calhoun, J.A., Quinn, P.K., Variations in the methanesulfonate to sulfate molar ratio in submicrometer marine aerosol particles over the South Pacific Ocean. Journal of Geophysical Research 97, Borbely-Kiss, I., Koltay, E., Szabo, Gy., Bozo, L., Tar, K., Composition and sources of urban and rural atmospheric aerosol in Eastern Hungary. Journal of Aerosol Science 3, Brankov, E., Rao, S.T., Porter, P.S., A trajectory-clustering-correlation methodology for examining the long-range transport of air pollutants. Atmospheric Environment 32, Cape, J.N., Methven, J., Hudson, L.E., 2. The use of trajectory cluster analysis to interpret trace gas measurements at Mace Head, Ireland. Atmospheric Environment 34, Carbo, P., Krom, Homoky, W.B., Benning, L.G., Herut, B., 25. Impact of atmospheric deposition on N and P geochemistry in the south Eastern Levantine basin. Deep-Sea Research 52, Dorling, S.R., Davies, T.D., Pierce, C.E., Cluster analysis: a technique for estimating the synoptic meteorological controls on air and precipitation chemistry method and applications. Atmospheric Environment 26A, Dulac, F., Buat-Menard, P., Arnold, M., Ezat, U., Martin, D., Atmospheric input of trace metals to the western Mediterranean Sea: 1. factors controlling the variability of atmospheric concentrations. Journal of Geophysical Research 92, Draxler, R.R., Hess, G.D., An overview of the HYSPLIT 4 modeling system for trajectories, dispersion and deposition. Australian Meteorological Magazine 47, Engelstaedter, S., Washington, R., 27. Atmospheric controls on the annual cycle of North African dust. Journal of Geophysical Research 112, D313. doi:1.129/26jd7195. Erduran, S.M., Tuncel, S.G., 21. Gaseous and particulate air pollutants in the Northeastern Mediterranean Coast. Science of the Total Environment 281, Ganor, E., Foner, H.A., Bingemer, H.G., Uditsi, R., Setter, I., 2. Biogenic sulphate generation in the Mediterranean Sea and its contribution to the sulphate anomaly in the aerosol over Israel and the Eastern Mediterranean. Atmospheric Environment 34, Griffin, D.W., Kubilay, N., Koçak, M., Gray, M.A., Borden, T.C., Shinn, E.A., 27. Airborne desert dust and aeromicrobiology over the Turkish Mediterranean coastline. Atmospheric Environment 41, Gerasopoulos, E., Kouvarakis, G., Babasakalis, P., Vrekoussis, M., Putaud, J.P., Mihalapoulos, N., 26. Origin and variability of particulate matter (PM1) mass concentrations over the Eastern Mediterranean. Atmospheric Environment 4, Güllü, G., Güray, D., Tuncel, G., 25. Atmospheric trace element and major ion concentrations over the Eastern Mediterranean Sea: identification of anthropogenic source regions. Atmospheric Environment 39, Huang, S., Rahn, K.A., Arimoto, R., Testing and optimizing two factoranalysis techniques on aerosol at Narragansett, Rhode Island. Atmospheric Environment 33, Kalivitis, N., Gerasopoulos, E., Vrekoussis, M., Kouvarakis, G., Kubilay, N., Hatzianastassiou, N., Vardavas, I., Mihalopoulos, N., 27. Dust transport over the Eastern Mediterranean derived from Total Ozone Mapping Spectrometer, Aerosol Robotic Network, and surface measurements. Journal of Geophysical Research 112, D322. doi:1.129/26jd751. Koçak, M., Nimmo, M., Kubilay, N., Herut, B., 24a. Spatio-temporal aerosol trace metal concentrations and sources in the Levantine Basin of the Eastern Mediterranean. Atmospheric Environment 38, Koçak, M., Kubilay, N., Mihalopoulos, N., 24b. Ionic composition of lower tropospheric aerosols at a North Eastern Mediterranean site: implications regarding sources and long-range transport. Atmospheric Environment 38, Koçak, M., Mihalopoulos, N., Kubilay, N., 27a. Contributions of natural sources to high PM 1 and PM 2.5 events in the Eastern Mediterranean. Atmospheric Environment 41, Koçak, M., Mihalopoulos, N., Kubilay, N., 27b. Chemical composition of the fine and coarse fraction of aerosols in the north Eastern Mediterranean. Atmospheric Environment 41, Kouvarakis, G., Mihalopoulos, N., 22. Seasonal variation of dimethylsulfide in the gas phase and of methanesulfonate and non-sea-salt sulfate in the aerosols phase in the Eastern Mediterranean atmosphere. Atmospheric Environment 36, Kouyoumdjian, H., Saliba, N.A., 25. Ion concentrations of PM and PM 2.5 aerosols over the Eastern Mediterranean region: seasonal variation
68 474 M. Koçak et al. / Atmospheric Research 92 (29) and source identification. Atmospheric Chemistry and Physics Discussions 5, Kubilay, N., Saydam, C., Trace elements in atmospheric particulates over the Eastern Mediterranean: concentration, sources and temporal variability. Atmospheric Environment 29, Kubilay, N., Nickovic, S., Moulin, C., Dulac, F., 2. An illustration of the transport and deposition of mineral dust onto the Eastern Mediterranean. Atmospheric Environment 34, Kubilay, N., Koçak, M., Çokacar, T., Oğuz, T., 22. Influence of Black Sea and local biogenic activity on the seasonal variation of aerosol sulfur species in the Eastern Mediterranean atmosphere. Global Biogeochemical Cycles 16 (4), 179. doi:1.129/22gb188. Kubilay, N., Oğuz, T., Koçak, M., Torres, O., 25. Ground-based assessment of Total Ozone Mapping Spectrometer (TOMS) data for dust transport over the north Eastern Mediterranean. Global Biogeochemical Cycles 19, GB122. doi:1.129/24gb237. Lee, E., Chan, C.K., Paatero, P,1999. Application of positive matrix factorization in source apportionment of particulate pollutants in Hong Kong. Atmospheric Environment 33, Lelieveld,J.,Berresheim,H.,Borrmann,S.,Crutzen,J.,Dentener,F.J.,Fischer,H., Feichter, J., Flatau, P.J., Heland, J., Holzinger, R., Korrmann, R., Lawrence, M.G., Levin, Z., Markowicz, K.M., Mihalopoulos, N., Minikin, A., Ramanathan, V., de Reus, M., Roelofs, G.J., Scheeren, H.A., Sciare, J., Schlager, H., Schultz, M., Siegmund, P., Steil, B., Stephanou, E.G., Stier, P., Traub, M., Warneke, C., Williams, J., Ziereis, H., 22. Global air pollution crossroads over the Mediterranean. Science 298, Luria, M., Peleg, M., Sharf, G., Tov-Alper, D.S., Spitz, N., Ben Ami, Y., Gawii, Z., Lifschitz, B., Yitzchaki, A., Seter, I., Atmospheric sulfur over the east Mediterranean region. Journal of Geophysical Research 11, Mamane, Y., Gottlieb, J., Nitrate formation on sea-salt and mineral particles a single particle approach. Atmospheric Environment 26A, Markaki, Z., Oikonomou, K., Koçak, M., Kouvarakis, G., Chaniotaki, A., Kubilay, N., Mihalopoulos, N., 23. Atmospheric deposition ofinorganic phosphorus in the Levantine Basin, Eastern Mediterranean: spatial and temporal variability and its role in seawater productivity. Limnology and Oceanography 48, Mihalopoulos, N., Stephanou, E., Kanakidou, M., Pilitsidis, S., Bousquet, P., Tropospheric aerosol ionic composition in the E. Mediterranean region. Tellus 49B, Mihalopoulos, N., Kerminen, V.M., Kanakidou, M., Berresheim, H., Sciare, J., 27. Formation of particulate sulfur species (sulfate and methanesulfonate) during summer over the Eastern Mediterranean: a modelling approach. Atmospheric Environment 41, Moulin,C.,Lambert,E.,Dayan,U.,Masson,V.,Ramonet,M.,Bousquet,P.,Legrand, M., Balkanski, Y.J., Guelle, W., Marticorena, B., Bergametti, G., Dulac, F., Satellite climatology of African dust transport in the Mediterranean atmosphere. Journal of Geophysical Research 13, O Dowd,C.D.,Smith,M.H.,Consterdine,I.E.,Lowe,J.A.,1997.Marineaerosol,seasalt, and themarine sulfurcycle: a short review. Atmospheric Environment 31, Paatero, P., 27. User's GuideforPositiveMatrixFactorization Programs PMF2 and PMF3, Part 1 2: tutorial. University of Helsinki, Helsinki, Finland. Paatero, P., Tapper, U., Positive matrix factorization: a non-negative factor model with optimal utilization of error estimates of data value. Environmetrics 5, Paatero, P., Hopke, P.H., Song, X.H., Ramadan, Z., 22. Understanding and controlling rotations in factor analytic models. Chemometrics and Intelligent Laboratory Systems 6, Rizzo, M.J., Scheff, P.A., 27. Fine particulate source apportionment using data from the USEPA speciation trends network in Chicago, Illinois: comparison of two source apportionment models. Atmospheric Environment 41, Rodriguez,S.,Querol,X.,Alastuey,A.,Plana,F.,22.Sourcesandprocesses affecting levels and composition of atmospheric aerosol in the western Mediterranean. Journal of Geophysical Research 17 (D24), doi:1.129/ 21JD1488. Querol, X., Alastuey, A., Rodriquez, S., Viana, M.M., Artinano, B., Salvador, P., Mantilla, E., Garcia dos Santos, S., Patier, R.F., de Las Rosa, J., Sanchez de la Campa, A., Menendez, M., Gil, J.J., 24. Levels of particulate matter in rural urban and industrial sites in Spain. Science of the Total Environment , Salvador, P., Artinano, B., Alonso, D.G., Querol, X., Alastuey, A., 24. Identification and characterization of sources of PM 1 in Madrid (Spain) by statistical methods. Atmospheric Environment 38, Say, N.P., 26. Lignite-fired thermal power plants and SO 2 pollution in Turkey. Energy Policy 34, Sellegri, K., Gourdeau, J., Putaud, J.P., Despiau, S., 21. Chemical composition of marine aerosol in a Mediterranean coastal zone during the FETCH experiment. Journal of Geophysical Research 16 (D11), 12,23 12,37. Sciare, J., Oikonomou, K., Favez, O., Markaki, Z., Liakakou, E., Cachier, H., Mihalopoulos, N., 28. Long-term measurements of carbonaceous aerosols in the Eastern Mediterranean: evidence of long-range transport of biomass burning. Atmospheric Chemistry and Physics 8, Song,Y.,Dai,W.,Shao,M.,Liu,Y.,Lu,S.,Kuster,W.,Goldan,P.,28.Comparisonof receptor models for source apportionment of volatile organic compounds in Beijing, China. Environmental Pollution 156, Thurston, G.D., Spengler, J.D., A quantitative assessment of source contributions to inhalable particulate matter pollution in metropolitan Boston. Atmospheric Environment 19, Turekian, K.K., Oceanography. Prince-Hall, Englewood Cliffs, N.J. Vasconcelos, L., Kahl, J., Liu, D., Macias, E., White, W., A tracer calibration of back trajectory analysis at the Grand Canyon. Journal of Geophysical Research 11 (D14), Viana, M., Pandolfi, M., Minguillon, M.C., Querol, X., Alastuey, A., Monfort, E., Celades, I., 28. Inter-comparison of receptor models for PM sources apportionment: case study in an industrial area. Atmospheric Environment 42, Washington, R., Todd, M., Middleton, N.J., Andrew, S., Goudie, A.S., 23. Dust-storm source areas determined by the Total Ozone Monitoring Spectrometer and surface observations. Annals of the Association of American Geographers 93 (2), Wedepohl, K.H., The composition of the continental crust. Geochemica Cosmochimica Acta 59,
69
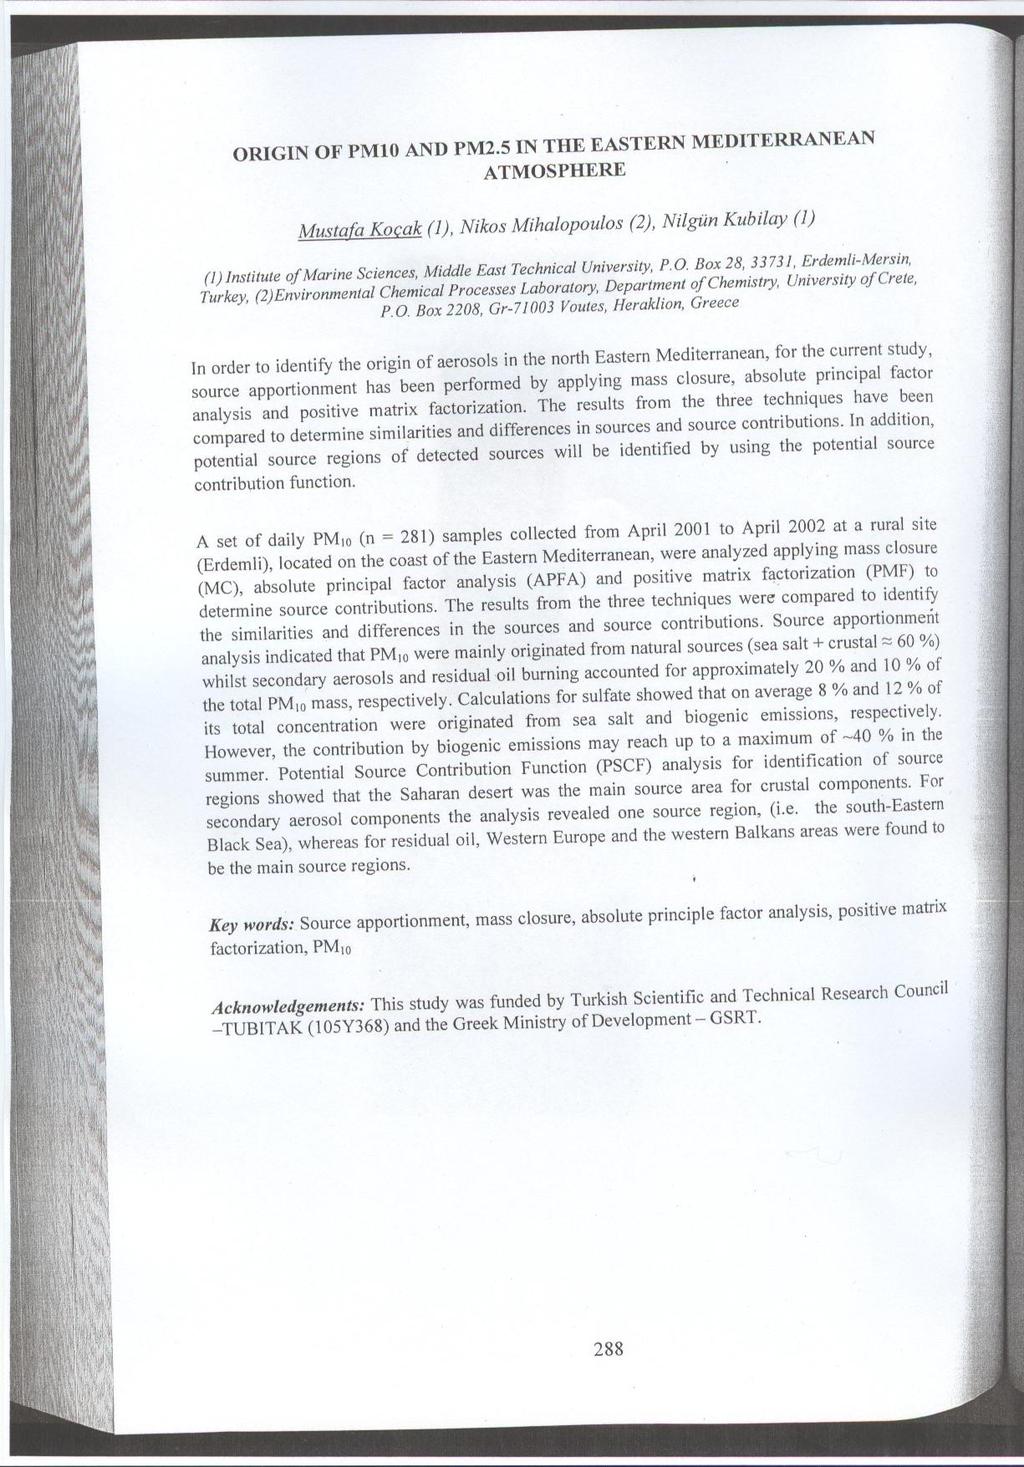
70
DOĞU KARADENİZ VE BATI KARADENİZ ATMOSFERİ AEROSOLLERİ KİMYASAL KOMPOZİSYONUNUN KARŞILAŞTIRILMASI
 DOĞU KARADENİZ VE BATI KARADENİZ ATMOSFERİ AEROSOLLERİ KİMYASAL KOMPOZİSYONUNUN KARŞILAŞTIRILMASI İlker BALCILAR, Abdullah ZARARSIZ, Yakup KALAYCI, Güray DOĞAN, Gürdal TUNCEL SEMPOZYUMU 7-9 EKİM 2015 İZMİR
ANKARA ATMOSFERİNDEKİ AEROSOLLERİN KİMYASAL KOMPOZİSYONLARININ BELİRLENMESİ
 ANKARA ATMOSFERİNDEKİ AEROSOLLERİN KİMYASAL KOMPOZİSYONLARININ BELİRLENMESİ İlke ÇELİK 1, Seda Aslan KILAVUZ 2, İpek İMAMOĞLU 1, Gürdal TUNCEL 1 1 : Ortadoğu Teknik Üniversitesi, Çevre Mühendisliği Bölümü
KONYA İLİ HAVA KALİTESİNİN DEĞERLENDİRİLMESİ
 KONYA İLİ HAVA KALİTESİNİN DEĞERLENDİRİLMESİ Bu çalışma da 2000-2010 yıllarındaki yıllık, aylık, saatlik veriler kullanılarak kirleticilerin mevsimsel değişimi incelenmiş, sıcaklık, rüzgar hızı, nisbi
ARAŞTIRMA DAİRESİ BAŞKANLIĞI Atmosfer Modelleri Şube Müdürlüğü. 31 Ocak 1 Şubat 2015 tarihlerinde yaşanan TOZ TAŞINIMI. olayının değerlendirmesi
 31 Ocak 1 Şubat 2015 tarihlerinde yaşanan TOZ TAŞINIMI olayının değerlendirmesi Kahraman OĞUZ, Meteoroloji Mühendisi Cihan DÜNDAR, Çevre Yük. Mühendisi Şubat 2015, Ankara 31 Ocak 1 Şubat 2015 tarihlerinde
Öğretim Üyeleri İçin Ön Söz Öğrenciler İçin Ön Söz Teşekkürler Yazar Hakkında Çevirenler Çeviri Editöründen
 Öğretim Üyeleri İçin Ön Söz Öğrenciler İçin Ön Söz Teşekkürler Yazar Hakkında Çevirenler Çeviri Editöründen ix xiii xv xvii xix xxi 1. Çevre Kimyasına Giriş 3 1.1. Çevre Kimyasına Genel Bakış ve Önemi
İklim ve İklim değişikliğinin belirtileri, IPCC Senaryoları ve değerlendirmeler. Bölgesel İklim Modeli ve Projeksiyonlar
 1/36 İklim ve İklim değişikliğinin belirtileri, Dünya da ve Türkiye de gözlemler IPCC Senaryoları ve değerlendirmeler Bölgesel İklim Modeli ve Projeksiyonlar Uluslararası Kuruluşlar, Aktiviteler için Sektörler
Kimyasal Toprak Sorunları ve Toprak Bozunumu-I
 Kimyasal Toprak Sorunları ve Toprak Bozunumu-I asitleşme-alkalileşme (tuzluluk-alkalilik) ve düşük toprak verimliliği Doç. Dr. Oğuz Can TURGAY ZTO321 Toprak İyileştirme Yöntemleri Toprak Kimyasal Özellikleri
TOZ TAŞINIMI MEKANİZMASINDAKİ FARKLILIKLAR: İKİ FARKLI TOZ TAŞINIMI OLAYI
 6. ULUSAL HAVA KİRLİLİĞİ VE KONTROLÜ SEMPOZYUMU TOZ TAŞINIMI MEKANİZMASINDAKİ FARKLILIKLAR: İKİ FARKLI TOZ TAŞINIMI OLAYI Cihan DÜNDAR Kahraman OĞUZ Gülen GÜLLÜ cdundar@mgm.gov.tr koguz@mgm.gov.tr ggullu@hacettepe.edu.tr
İKLİM DEĞİŞİKLİĞİ VE KURAKLIK ANALİZİ. Bülent YAĞCI Araştırma ve Bilgi İşlem Dairesi Başkanı
 T.C. ÇEVRE VE ORMAN BAKANLIĞI DEVLET METEOROLOJİ İŞLERİ GENEL MÜDÜRLÜĞÜ İKLİM DEĞİŞİKLİĞİ VE KURAKLIK ANALİZİ Bülent YAĞCI Araştırma ve Bilgi İşlem Dairesi Başkanı İklim Değişikliği 1. Ulusal Bildirimi,
Atmosfer Kimyası Neden Önemli?
 ÇEV 715 Atmosfer Kimyası Özgür ZEYDAN (PhD.) http://cevre.beun.edu.tr/zeydan/ Atmosfer Kimyası Neden Önemli? Atmosfere salınan antropojenik ve doğal emisyonların atmosferin fiziksel ve kimyasal yapısını
İSTANBUL ANADOLU YAKASI HAVA KİRLİLİĞİNİN PM10 ve PM2.5 AÇISINDAN DEĞERLENDİRİLMESİ. Ufuk MALAK Prof.Dr. Kadir ALP
 İSTANBUL ANADOLU YAKASI HAVA KİRLİLİĞİNİN PM10 ve PM2.5 AÇISINDAN DEĞERLENDİRİLMESİ Ufuk MALAK Prof.Dr. Kadir ALP Hava Kirliliği Hava kirliliğinin, özellikle Partiküler madde PM10 ve PM2.5 in sağlık üzerine
KUTUPLARDAKİ OZON İNCELMESİ
 KUTUPLARDAKİ OZON İNCELMESİ Bilim adamlarınca, geçtiğimiz yıllarda insan faaliyetlerindeki artışa paralel olarak, küresel ölçekte çevre değişiminde ve problemlerde artış olduğu ifade edilmiştir. En belirgin
I.10. KARBONDİOKSİT VE İKLİM Esas bileşimi CO2 olan fosil yakıtların kullanılması nedeniyle atmosferdeki karbondioksit konsantrasyonu artmaktadır.
 I.10. KARBONDİOKSİT VE İKLİM Esas bileşimi CO2 olan fosil yakıtların kullanılması nedeniyle atmosferdeki karbondioksit konsantrasyonu artmaktadır. Fosil yakıtlar, çoğu yeşil bitkilerin fotosentez ürünü
1. İklim Değişikliği Nedir?
 1. İklim Değişikliği Nedir? İklim, en basit ifadeyle, yeryüzünün herhangi bir yerinde uzun yıllar boyunca yaşanan ya da gözlenen tüm hava koşullarının ortalama durumu olarak tanımlanabilir. Yerküre mizin
UYDU KAR ÜRÜNÜ VERİLERİYLE TÜRKİYE İÇİN BÖLGESEL VE MEVSİMSEL KARLA KAPLI ALAN TREND ANALİZİ
 UYDU KAR ÜRÜNÜ VERİLERİYLE TÜRKİYE İÇİN BÖLGESEL VE MEVSİMSEL KARLA KAPLI ALAN TREND ANALİZİ İbrahim SÖNMEZ 1, Ahmet Emre TEKELİ 2, Erdem ERDİ 3 1 Ondokuz Mayıs Üniversitesi, Meteoroloji Mühendisliği Bölümü,
Ankara Atmosferinde Toplanan PM2.5 Örneklerinde n Alkan Konsantrasyon Seviyelerinin Mevsimsel Değişimlerinin Değerlendirilmesi
 Ankara Atmosferinde Toplanan PM2.5 Örneklerinde n Alkan Konsantrasyon Seviyelerinin Mevsimsel Değişimlerinin Değerlendirilmesi EBRU KOÇAK, SEDA ASLAN KILAVUZ, İPEK İMAMOĞ LU, GÜRDAL TUNCEL Giriş Partikül
ŞEHİR ATMOSFERİNDE ESER METALLERİN KURU ÇÖKELMESİ
 269 ŞEHİR ATMOSFERİNDE ESER METALLERİN KURU ÇÖKELMESİ Gülay ÖNAL, Semra G. TUNCEL ( ) ODTÜ Fen Edebiyat Fakültesi, Kimya Bölümü, Ankara ÖZET Ankara şehir atmosferindeki eser element çökelmesi, alıcı ortam
ANKARA ŞEHRİNİN HAVA KALİTESİNİN UOB LER AÇISINDAN İNCELENMESİ
 ANKARA ŞEHRİNİN HAVA KALİTESİNİN UOB LER AÇISINDAN İNCELENMESİ Sanaz Lakestani, Gülen Güllü Hacettepe Üniversitesi Çevre Mühendisliği Bölümü E mail: ggullu@hacettepe.edu.tr Amaç Bu çalışmada Ankara ilininin
I.6. METEOROLOJİ VE HAVA KİRLİLİĞİ
 I.6. METEOROLOJİ VE HAVA KİRLİLİĞİ Meteorolojik şartlar, hava kirliliğinin sadece can sıkıcı bir durum veya insan sağlığı için ciddi bir tehdit olduğunu belirler. Fotokimyasal dumanın negatif etkileri
Bölüm 1: İklim değişikliği ve ilgili terminoloji
 Bölüm 1: İklim değişikliği ve ilgili terminoloji Bölüm 1: İklim değişikliği ve ilgili terminoloji Neden Sera gazlarını izliyor ve raporluyoruz? Küresel İklim Değişikliği Nedir Küresel İklim Değişikliği
Sera Etkisi. Gelen güneş ışınlarının bir kısmı bulutlar tarafında bloke edilmekte. Cam tarafından tutulan ısı
 Sera Etkisi Bir miktarda ısı arz dan kaçmakta Gelen güneş ışınlarının bir kısmı bulutlar tarafında bloke edilmekte CO2 tarafından tutulan Isının bir kısmı tekrar atmosfere kaçabilir. Cam tarafından tutulan
Ekosistem ve Özellikleri
 Ekosistem ve Özellikleri Öğr. Gör. Özgür ZEYDAN http://cevre.beun.edu.tr/zeydan/ Ekosistem Belirli bir bölgede yaşayan ve birbirleriyle sürekli etkileşim halindeki canlılar (biyotik faktörler) ve cansız
Yrd. Doç. Dr. Güray Doğan
 17.02.2017 Yrd. Doç. Dr. Güray Doğan Bugün: Hava kirliliği ölçekleri Yerel Kentsel Bölgesel Kıtasal Küresel Hava Kirliliği Ölçekleri Neden ölçeksel tanımlarız? Boyutları bilmek çözüm için para ve zaman
ÇOKLU DOĞRUSAL ANALİZ YÖNTEMİYLE UÇUCU ORGANİK BİLEŞİKLERİN ATMOSFERDEKİ KONSANTRASYONLARINA ETKİ EDEN METEOROLOJİK FAKTÖRLERİN İNCELENMESİ
 ÇOKLU DOĞRUSAL ANALİZ YÖNTEMİYLE UÇUCU ORGANİK BİLEŞİKLERİN ATMOSFERDEKİ KONSANTRASYONLARINA ETKİ EDEN METEOROLOJİK FAKTÖRLERİN İNCELENMESİ Sema Yurdakul, Mihriban Civan, Gürdal Tuncel Eylül, 2015 1. Giriş
Stratosferde Fotokimyasal Reaksiyonlar ve Ozon
 Stratosferde Fotokimyasal Reaksiyonlar ve Ozon Ozon tabakasının incelmesi/delinmesi Ozon tabakasının delinmesine/incelmesine yol açan bileşiklerin başlıcaları halojenli bileşiklerdir. Etkin giderme mekanizmaları
Prof.Dr. Mustafa ODABAŞI
 Prof.Dr. Mustafa ODABAŞI Dokuz Eylül Üniversitesi, Çevre Mühendisliği Bölümü, Tınaztepe Yerleşkesi, 35160 Buca/İzmir E-mail : mustafa.odabasi@deu.edu.tr Ders İçeriği Temel Element Döngüleri Karbon Döngüsü
TOPRAK TOPRAK TEKSTÜRÜ (BÜNYESİ)
") TOPRAK Toprak esas itibarı ile uzun yılların ürünü olan, kayaların ve organik maddelerin türlü çaptaki ayrışma ürünlerinden meydana gelen, içinde geniş bir canlılar âlemini barındırarak bitkilere durak
TOPRAK Toprak esas itibarı ile uzun yılların ürünü olan, kayaların ve organik maddelerin türlü çaptaki ayrışma ürünlerinden meydana gelen, içinde geniş bir canlılar âlemini barındırarak bitkilere durak
Havacılık Meteorolojisi Ders Notları. 1. Atmosfer ve İçeriği
 Havacılık Meteorolojisi Ders Notları 1. Atmosfer ve İçeriği Yard.Doç.Dr. İbrahim Sönmez Ondokuz Mayıs Üniversitesi Ballıca Kampüsü Havacılık ve Uzay Bilimleri Fakültesi Meteoroloji Mühendisliği Bölümü
İSTANBUL BOĞAZI SU SEVİYESİ DEĞİŞİMLERİNİN MODELLENMESİ. Berna AYAT. İstanbul, Türkiye
 6. Ulusal Kıyı Mühendisliği Sempozyumu 271 İSTANBUL BOĞAZI SU SEVİYESİ DEĞİŞİMLERİNİN MODELLENMESİ Burak AYDOĞAN baydogan@yildiz.edu.tr Berna AYAT bayat@yildiz.edu.tr M. Nuri ÖZTÜRK meozturk@yildiz.edu.tr
Akvaryum veya küçük havuzlarda amonyağın daha az zehirli olan nitrit ve nitrata dönüştürülmesi için gerekli olan bakteri populasyonunu (nitrifikasyon
 Azotlu bileşikler Ticari balık havuzlarında iyonize olmuş veya iyonize olmamış amonyağın konsantrasyonlarını azaltmak için pratik bir yöntem yoktur. Balık havuzlarında stoklama ve yemleme oranlarının azaltılması
DOĞU AKDENİZ ATMOSFERİNDE SÜLFAT SEVİYELERİNİ ETKİLEYEN KAYNAK BÖLGELERİNİN BELİRLENMESİ
 DOĞU AKDENİZ ATMOSFERİNDE SÜLFAT SEVİYELERİNİ ETKİLEYEN KAYNAK BÖLGELERİNİN BELİRLENMESİ Zeynep MALKAZ 1, Seda ASLAN KILAVUZ 2, R. Fikret YIKMAZ 3,, Zuhal AKYÜREK 4, Gürdal TUNCEL 1 1 : Ortadoğu Teknik
Uzaktan Algılama Verileri ile Toz Taşınımı Analizi
 Uzaktan Algılama Verileri ile Toz Taşınımı Analizi Kahraman OĞUZ, Muhammet Ali PEKİN, Cihan DÜNDAR Meteoroloji Genel Müdürlüğü Araştırma Dairesi Başkanlığı Ankara koguz@mgm.gov.tr mapekin@mgm.gov.tr cdundar@mgm.gov.tr
KÜTAHYA DA YAŞAYAN İLKOKUL ÇAĞINDAKİ ÇOCUKLARIN HAVA KİRLETİCİLERİNE KİŞİSEL MARUZ KALIMLARININ ÖN DEĞERLENDİRME ÇALIŞMASI
 KÜTAHYA DA YAŞAYAN İLKOKUL ÇAĞINDAKİ ÇOCUKLARIN HAVA KİRLETİCİLERİNE KİŞİSEL MARUZ KALIMLARININ ÖN DEĞERLENDİRME ÇALIŞMASI Hicran ALTUĞ, Ayşe Özlem YILMAZ, Ozan Devrim YAY, Özlem ÖZDEN ÜZMEZ, Sevim Burçin
Yıldız Teknik Üniversitesi Çağdaş, Öncü, Yenilikçi
 Hava Kirliliği Ölçüm Yöntemleri Emisyon Ölçümleri (Kaynakta) İmisyon Ölçümleri Sabit kaynaklar (Yakma tesisi, fabrika, termik santral bacaları) Hareketli kaynaklar (Motorlu araçlar) Ortam havasında yapılır
Kentsel Hava Kirliliği Riski için Enverziyon Tahmini
 DEVLET METEOROLOJİ İŞLERİ GENEL MÜDÜRLÜĞÜ ARAŞTIRMA ve BİLGİ İŞLEM DAİRESİ BAŞKANLIĞI ARAŞTIRMA ŞUBE MÜDÜRLÜĞÜ Kentsel Hava Kirliliği Riski için Enverziyon i 2008-2009 Kış Dönemi (Ekim, Kasım, Aralık,
Bölüm 7. Mavi Bilye: YER
 Bölüm 7 Mavi Bilye: YER Japon uzay ajansının (JAXA) AY yörüngesinde bulunan aracı KAGUYA dan Yer in doğuşu ilk defa yüksek çözünürlüklü olarak görüntülendi. 14 Kasım 2007 Yeryüzü: Okyanus tabanındaki büyük
ÖLÇÜM VE /VEYA ANALİZ İLE İLGİLİ; Kapsam Parametre Metot adı Metot Numarası Hız ve Debi Pitot Tüpü Metodu TS ISO 10780
 Çevresel Etki Değerlendirmesi İzin ve Denetim lüğü EK LİSTE - 1/5 Hız ve Debi Pitot Tüpü Metodu TS ISO 10780 EMİSYON 1 İslilik Nem Partikül Madde CO, O 2 CO 2 NO NO X, NO 2 Renk Karşılaştırma (Bacharach)
BİTKİ BESİN MADDELERİ (BBM)
") BİTKİ BESİN MADDELERİ (BBM) Toprak Bilgisi Dersi Prof. Dr. Günay Erpul erpul@ankara.edu.tr Işık Enerjisinin Kimyasal Enerjiye Dönüştürülmesi Fotosentez, karbon (C), oksijen (O) ve hidrojen (H) atomlarını
BİTKİ BESİN MADDELERİ (BBM) Toprak Bilgisi Dersi Prof. Dr. Günay Erpul erpul@ankara.edu.tr Işık Enerjisinin Kimyasal Enerjiye Dönüştürülmesi Fotosentez, karbon (C), oksijen (O) ve hidrojen (H) atomlarını
DERS VI-VII Nüfus Artışı Küresel Isınma
 DERS VI-VII Nüfus Artışı Küresel Isınma Demografi (nüfus bilimi), sınırları belli olan bir coğrafyanın nüfus yapısını, özelliklerini ve değişimlerini incelemektedir. Doğum, ölümün yanı sıra göç gibi dinamikleri
DOĞU KARADENİZ VE BATI KARADENİZ ATMOSFERİ AEROSOLLERİ KİMYASAL KOMPOZİSYONUNUN KARŞILAŞTIRILMASI
 DOĞU KARADENİZ VE BATI KARADENİZ ATMOSFERİ AEROSOLLERİ KİMYASAL KOMPOZİSYONUNUN KARŞILAŞTIRILMASI İlker BALCILAR 1( ), Abdullah ZARARSIZ 2, Yakup KALAYCI 2, Güray DOĞAN 3, Gürdal TUNCEL 1 1 Çevre Mühendisliği
Sera Gazları ve Önemi
 Sera Gazları ve Önemi Yeryüzünün uzun dönem içerisinde güneşten aldığı enerji kadar enerjiyi uzaya vermesi gerekir. Güneş enerjisi yeryüzüne kısa dalga boylu radyasyon olarak ulaşır. Gelen radyasyonun
TÜBİTAK MARMARA ARAŞTIRMA MERKEZİ
 TÜBİTAK MARMARA ARAŞTIRMA MERKEZİ ÇERKEZKÖY ORGANİZE SANAYİ BÖLGESİNDE POLİARAOMATİK HİDROKARBON (PAH) VE AĞIR METAL SEVİYELERİNİN BELİRLENMESİ VE DEĞERLENDİRİLMESİ Faruk DİNÇER, Özgen ERCAN, Özcan CEYLAN
Hidroloji Disiplinlerarası Bir Bilimdir
 HİDROLOJİ KAPSAM Hidrolojik Çevrim ve Elemanları Hidrolojik Değişkenlerin Ölçülmesi ve Analizi Yağış Buharlaşma Terleme Sızma Analizleri Akım Ölçümleri ve Verilerin Analizi Yüzeysel Akış Yağış-Akış İlişkisi
Çevre Biyolojisi
 Çevre Biyolojisi 115-02 Bölüm 03-02 Temel Ekolojik Kavramlar ve Süreçler Çağatay Tavşanoğlu 2017-2018 Güz Biyojeokimyasal döngüler ve madde geri kazanımı Ekosistem boyunca enerji akışı tek yönlü bir süreçtir
Gözlemevi Yer Seçimi Amaçlıİklim Tanı Arşivlerinde Türkiye
 Gözlemevi Yer Seçimi Amaçlıİklim Tanı Arşivlerinde Türkiye Tansel AK(1,2), Tuncay ÖZIŞIK(1) (1) TÜBİTAK Ulusal Gözlemevi (2) İstanbul Üniv. Fen Fak. Astronomi ve Uzay Bilimleri Bölümü Gözlemevi Yer Seçiminde
DOLGULU KOLONDA AMONYAK ÇÖZELTİSİNE KARBON DİOKSİTİN ABSORPSİYONU
 DOLGULU KOLONDA AMONYAK ÇÖZELTİSİNE KARBON DİOKSİTİN ABSORPSİYONU Duygu UYSAL, Ö. Murat DOĞAN, Bekir Zühtü UYSAL Gazi Üniversitesi, Mühendislik Fakültesi, Kimya Mühendisliği Bölümü ve Temiz Enerji Araştırma
ATAŞEHİR İLÇESİ HAVA KALİTESİ ÖLÇÜMLERİ DEĞERLENDİRMESİ
 ATAŞEHİR İLÇESİ HAVA KALİTESİ ÖLÇÜMLERİ DEĞERLENDİRMESİ Ekim 2018 Prof. Dr. Mikdat KADIOĞLU Prof. Dr. Hüseyin TOROS İTÜ Uçak ve Uzay Bilimleri Fakültesi Meteoroloji Mühendisliği Bölümü ÖNSÖZ Hepimiz sağlıklı,
GÜNEŞ ENERJİSİ II. BÖLÜM
 GÜNEŞ ENERJİSİ II. BÖLÜM Prof. Dr. Olcay KINCAY GÜNEŞ AÇILARI GİRİŞ Güneş ışınları ile dünya üzerindeki yüzeyler arasında belirli açılar vardır. Bu açılar hakkında bilgi edinilerek güneş enerjisinden en
Atomlar ve Moleküller
 Atomlar ve Moleküller Madde, uzayda yer işgal eden ve kütlesi olan herşeydir. Element, kimyasal tepkimelerle başka bileşiklere parçalanamayan maddedir. -Doğada 92 tane element bulunmaktadır. Bileşik, belli
Nilüfer İlçesi ndeki Klasik Hava Kirletici Ölçümlerinin Değerlendirilmesi Raporu
 Nilüfer İlçesi ndeki Klasik Hava Kirletici Ölçümlerinin Değerlendirilmesi Raporu (Periyot: 15-21 Nisan 2016) Prof. Dr. Yücel TAŞDEMİR 1 Özet Nilüfer Belediyesi nin BEBKA destekli projesi kapsamında Nilüfer
6.1. SU VE TOPRAK YÖNETİMİ İSTATİSTİKLERİ 2. Mevcut Durum
 6.1. SU VE TOPRAK YÖNETİMİ İSTATİSTİKLERİ 2. Mevcut Durum Su kalitesi istatistikleri konusunda, halen Devlet Su İşleri Genel Müdürlüğü (DSİ) tarafından 25 havzada nehir ve göl suyu kalitesi izleme çalışmaları
HAVA KALİTESİ YÖNETİMİ
 HAVA KALİTESİ YÖNETİMİ Prof.Dr.Abdurrahman BAYRAM Prof.Dr. Tolga ELBİR Dr.Öğr.Üyesi Yetkin DUMANOĞLU CEV-3616 Hava Kirliliği ve Kontrolu Hava Kalitesi Yönetimi Bir bölgede hava kalitesi seviyelerinin iyileştirilmesi
TÜİK ENERJİ SEKTÖRÜ. Dr. Ali CAN. T.C.BAŞBAKANLIK Türkiye İstatistik Kurumu
 ENERJİ SEKTÖRÜ Dr. Ali CAN 10.03.2010 24 3.ENERJİ - 3.1. Yakıt Yanması IPCC ye göre, enerji sektöründen kaynaklanan emisyon büyük ölçüde yakıt yanmasını içermektedir. Hemen hemen bütün ülkelerde görülebildiği
(Change of Water Masses-Dust Storms Interaction in Syria and Iraq) Suriye ve Irak taki Su Kütlelerindeki Değişimin Toz Fırtınaları ile İlişkisi
 Suriye ve Irak taki Su Kütlelerindeki Değişimin Toz Fırtınaları ile İlişkisi") V. ULUSLARARASI KUM VE TOZ FIRTINASI ÇALIŞTAYI ORTA DOĞU TOZ KAYNAKLARI VE ETKİLERİ 23-25 EKİM 2017, İSTANBUL (Change of Water Masses-Dust Storms Interaction in Syria and Iraq) Suriye ve Irak taki Su Kütlelerindeki
V. ULUSLARARASI KUM VE TOZ FIRTINASI ÇALIŞTAYI ORTA DOĞU TOZ KAYNAKLARI VE ETKİLERİ 23-25 EKİM 2017, İSTANBUL (Change of Water Masses-Dust Storms Interaction in Syria and Iraq) Suriye ve Irak taki Su Kütlelerindeki
Prof.Dr. Mustafa ODABAŞI
 Prof.Dr. Mustafa ODABAŞI Dokuz Eylül Üniversitesi, Çevre Mühendisliği Bölümü, Tınaztepe Yerleşkesi, 35160 Buca/İzmir E-mail : mustafa.odabasi@deu.edu.tr Stratosferde Fotokimyasal Reaksiyonlar ve Ozon Ozon
Nilüfer İlçesi ndeki Klasik Hava Kirletici Ölçümlerinin Değerlendirilmesi Raporu
 Nilüfer İlçesi ndeki Klasik Hava Kirletici Ölçümlerinin Değerlendirilmesi Raporu (Periyot: 08-14 Nisan 2016) Prof. Dr. Yücel TAŞDEMİR 1 Özet Nilüfer Belediyesi nin BEBKA destekli projesi kapsamında Nilüfer
Nilüfer İlçesi ndeki Klasik Hava Kirletici Ölçümlerinin Değerlendirilmesi Raporu
 Nilüfer İlçesi ndeki Klasik Hava Kirletici Ölçümlerinin Değerlendirilmesi Raporu (Periyot: 13-19 Kasım 2017) Prof. Dr. Yücel TAŞDEMİR 1 Özet Nilüfer Belediyesi nin BEBKA destekli projesi kapsamında Nilüfer
JAA ATPL Eğitimi (METEOROLOJİ)
") JAA ATPL Eğitimi (METEOROLOJİ) Hazırlayan: Ibrahim CAMALAN Meteoroloji Mühendisi 2012 YEREL RÜZGARLAR MELTEMLER Bu rüzgarlar güneşli bir günde veya açık bir gecede, Isınma farklılıklarından kaynaklanan
JAA ATPL Eğitimi (METEOROLOJİ) Hazırlayan: Ibrahim CAMALAN Meteoroloji Mühendisi 2012 YEREL RÜZGARLAR MELTEMLER Bu rüzgarlar güneşli bir günde veya açık bir gecede, Isınma farklılıklarından kaynaklanan
ATMOSFERDEKİ YAĞIŞA GEÇERİLİR SURUHARI MİKTARININ HESAPLANMASI
 ATMOSFERDEKİ YAĞIŞA GEÇERİLİR SURUHARI MİKTARININ HESAPLANMASI SEMA TOPÇU* 1. GİRİŞ Dünya üzerindeki büyük su kütlelerinden meydana gelen buharlaşma ve canlıların terleme olayı atmosferdeki subuharının
AKTİVİTE KATSAYILARI Enstrümantal Analiz
 1 AKTİVİTE KATSAYILARI Enstrümantal Analiz Bir taneciğin, aktivitesi, a M ile molar konsantrasyonu [M] arasındaki bağıntı, a M = f M [M] (1) ifadesiyle verilir. f M aktivite katsayısıdır ve birimsizdir.
Megakent- Çevreye Yakından Bakış: Hava Kirliği için Olası Çözümler-Doğu Akdeniz 4 th of April 2012
 Institute of Marine Sciences Megakent- Çevreye Yakından Bakış: Hava Kirliği için Olası Çözümler-Doğu Akdeniz 4 th of April 212 Mustafa Koçak Institute of Marine Sciences Middle East Technical University
PROJE AŞAMALARI. Kaynak Envanterinin Oluşturulması. Emisyon Yükü Hesaplamaları
 PROJENİN AMACI Bölgesel Temiz Hava Merkezlerinden olan Ankara merkez olmak üzere; Bartın, Bolu, Çankırı, Düzce, Eskişehir, Karabük, Kastamonu, Kırıkkale, Kırşehir, Kütahya, Yozgat ve Zonguldak illerinde
İKLİM ELEMANLARI SICAKLIK
 İKLİM ELEMANLARI Bir yerin iklimini oluşturan sıcaklık, basınç, rüzgâr, nem ve yağış gibi olayların tümüne iklim elemanları denir. Bu elemanların yeryüzüne dağılışını etkileyen enlem, yer şekilleri, yükselti,
EK YAKIT OLARAK ÇİMENTO FABRİKALARINDA KULLANILABİLECEK ATIKLAR
 EK YAKIT OLARAK ÇİMENTO FABRİKALARINDA KULLANILABİLECEK ATIKLAR 1) Kullanılmış lastikler 2) I ve II nci kategori atık yağlar 3) Boya çamurları 4) Solventler 5) Plastik atıklar 6) Çevre ve Orman Bakanlığı
Nilüfer İlçesi ndeki Klasik Hava Kirletici Ölçümlerinin Değerlendirilmesi Raporu
 Nilüfer İlçesi ndeki Klasik Hava Kirletici Ölçümlerinin Değerlendirilmesi Raporu (Periyot: 27 Şubat 05 Mart 2017) Prof. Dr. Yücel TAŞDEMİR 1 Özet Nilüfer Belediyesi nin BEBKA destekli projesi kapsamında
SANAYİ SEKTÖRÜ. Mevcut Durum Değerlendirme
 SANAYİ SEKTÖRÜ Mevcut Durum Değerlendirme Sera Gazı Emisyonaları 1990 1995 2000 2005 2008 CO 2 141,36 173,90 225,43 259,61 297,12 CH 4 33,50 46,87 53,30 52,35 54,29 N 2 0 11,57 16,22 16,62 14,18 11,57
Nilüfer İlçesi ndeki Klasik Hava Kirletici Ölçümlerinin Değerlendirilmesi Raporu
 Nilüfer İlçesi ndeki Klasik Hava Kirletici Ölçümlerinin Değerlendirilmesi Raporu (Periyot: 27 Mart 02 Nisan 2017) Prof. Dr. Yücel TAŞDEMİR 1 Özet Nilüfer Belediyesi nin BEBKA destekli projesi kapsamında
IPCC 1.5 C Küresel Isınma Özel Raporu ve Türkiye ye Etkileri
 IPCC 1.5 C Küresel Isınma Özel Raporu ve Türkiye ye Etkileri 16 Ekim 2018 Prof. Dr. Murat Türkeş IPPC Başyazarlarından, TEMA Vakfı Bilim Kurulu Üyesi, BÜ İklim Değişikliği ve Politikaları Uygulama ve Araştırma
Emisyon ve Hava Kalitesi Ölçüm Yöntemleri: Temel Prensipler
 Emisyon ve Hava Kalitesi Ölçüm Yöntemleri: Temel Prensipler Prof.Dr.Abdurrahman BAYRAM Dokuz Eylül Üniversitesi, Çevre Mühendisliği Bölümü Tınaztepe Yerleşkesi 35160 Buca-İzmir Tel: 0232 3017113 Faks:
RÜZGAR ENERJİSİ. Cihan DÜNDAR. Tel: Faks :
 RÜZGAR ENERJİSİ Cihan DÜNDAR Tel: 312 302 26 88 Faks : 312 361 20 40 e-mail :cdundar@meteor.gov.tr Devlet Meteoroloji İşleri Genel Müdürlüğü A r a ş t ı r m a Ş u b e M ü d ü r l ü ğ ü Enerji Kullanımının
SIFIR KARBONDİOKSİT SALINIMI
 SIFIR KARBONDİOKSİT SALINIMI HAZIRLAYAN ÖĞRENCİLER SARP BARIŞ ORHON (7-E) ARDA KÖROĞLU (7-E) DANIŞMAN ÖĞRETMEN Meral BEŞİRACI İZMİR 2014 İÇİNDEKİLER 1. Proje özeti...2 2. Projenin amacı...2 3. Giriş...2-3
TÜRKİYE NİN DEĞİŞİK BÖLGELERİNDE ÖLÇÜLEN AEROSOL KOMPOZİSYONLARININ KARŞILAŞTIRILMASI
 169 TÜRKİYE NİN DEĞİŞİK BÖLGELERİNDE ÖLÇÜLEN AEROSOL KOMPOZİSYONLARININ KARŞILAŞTIRILMASI ÖZET Güray DOĞAN (*), Gürdal TUNCEL ODTÜ Mühendislik Fakültesi, Çevre Mühendisliği Bölümü 06531 Ankara Bu çalışmada
Online teknik sayfa MCS100E HW SEOS ÇÖZÜMLERI
 Online teknik sayfa MCS100E HW A B C D E F H I J K L M N O P Q R S T 15267 14181 certified certified Sipariş bilgileri Tip MCS100E HW Stok no. Talep üzerine Uygulama yeri ve müşteri gereklilikleri doğrultusunda
MARMARA DENİZİ ARAŞTIRMALARI NİSAN 1994 ÖLÇÜMLERİ İLK BULGULAR M. Levent Artüz
 İ.T.Ü. Gemi İnşaatı ve Deniz Bilimleri Fakültesi 1994 MARMARA DENİZİ ARAŞTIRMALARI NİSAN 1994 ÖLÇÜMLERİ İLK BULGULAR M. Levent Artüz 25Nisan 1994-4 Mayıs 1994 tarihleri arasında Marmara Denizi nde Marmara
SERA GAZI EMİSYONU HAKAN KARAGÖZ
 İKLİM DEĞİŞİKLİĞİ VE SERAGAZI EMİSYONU İklim değişikliği, nedeni olursa olsun iklim koşullarındaki büyük ölçekli (küresel) ve önemli yerel etkileri bulunan, uzun süreli ve yavaş gelişen değişiklikler olarak
T.C. ÇEVRE VE ŞEHİRCİLİK BAKANLIĞI ÇEVRE YÖNETİMİ GENEL MÜDÜRLÜĞÜ YER SEVİYESİ OZON KİRLİLİĞİ BİLGİ NOTU
 T.C. ÇEVRE VE ŞEHİRCİLİK BAKANLIĞI ÇEVRE YÖNETİMİ GENEL MÜDÜRLÜĞÜ YER SEVİYESİ OZON KİRLİLİĞİ BİLGİ NOTU Temmuz 2014 OZON NEDİR Ozon (O 3 ) üç tane oksijen atomunun birleşmesi ile oluşmaktadır. Ozon, atmosferde
Akreditasyon Sertifikası Eki (Sayfa 1/6) Akreditasyon Kapsamı
 Akreditasyon Kapsamı") Akreditasyon Sertifikası Eki (Sayfa 1/6) Deney Laboratuvarı Adresi : Yavuz Sultan Selim Cad. 118. Sokak No: 29 Dilovası 41455 KOCAELİ/TÜRKİYE Tel : 0 262 754 17 81 Faks : 0 262 754 19 84 E-Posta : EHSTurkey@sgs.com
Akreditasyon Sertifikası Eki (Sayfa 1/6) Deney Laboratuvarı Adresi : Yavuz Sultan Selim Cad. 118. Sokak No: 29 Dilovası 41455 KOCAELİ/TÜRKİYE Tel : 0 262 754 17 81 Faks : 0 262 754 19 84 E-Posta : EHSTurkey@sgs.com
Nilüfer İlçesi ndeki Klasik Hava Kirletici Ölçümlerinin Değerlendirilmesi Raporu
 Nilüfer İlçesi ndeki Klasik Hava Kirletici Ölçümlerinin Değerlendirilmesi Raporu (Periyot: 11-17 Eylül 2017) Prof. Dr. Yücel TAŞDEMİR 1 Özet Nilüfer Belediyesi nin BEBKA destekli projesi kapsamında Nilüfer
İklim Değişikliği. Dr. Aslı Numanoğlu Genç. Atılım Üniversitesi, İnşaat Mühendisliği Bölümü
 İklim Değişikliği Dr. Aslı Numanoğlu Genç Atılım Üniversitesi, İnşaat Mühendisliği Bölümü İKLİM DEĞİŞİKLİĞİ? İklimi değiştiren nedir? Gerçekten iklim değişikliği var mı? Var ise nasıl kanıtlıyoruz? Bizi
Akreditasyon Sertifikası Eki (Sayfa 1/7) Akreditasyon Kapsamı
 Akreditasyon Kapsamı") Akreditasyon Sertifikası Eki (Sayfa 1/7) Deney Laboratuvarı Adresi : Yenişehir Mahallesi Fıratlı sk. No:12 D:1-2-3 KOCAELİ 41050 KOCAELİ / TÜRKİYE Tel : 0 262 321 29 00 Faks : 0 262 321 29 04 E-Posta :
Akreditasyon Sertifikası Eki (Sayfa 1/7) Deney Laboratuvarı Adresi : Yenişehir Mahallesi Fıratlı sk. No:12 D:1-2-3 KOCAELİ 41050 KOCAELİ / TÜRKİYE Tel : 0 262 321 29 00 Faks : 0 262 321 29 04 E-Posta :
TEKNOLOJİK ARAŞTIRMALAR
 www.teknolojikarastirmalar.com ISSN:1305-631X Yapı Teknolojileri Elektronik Dergisi 2006 (1) 43-50 TEKNOLOJİK ARAŞTIRMALAR Kısa Makale Yılmaz İÇAĞA 1, Yalçın BOSTANOĞLU 2, Erhan KAHRAMAN 1 1 Afyon Kocatepe
İçerik. Gemi Kaynaklı Deniz Kirliliği Uydu (U) Destekli Deniz (De) Kirliliği (Ki) Tanımlama (T) (UDeKiT Lab.)
 Destekli Deniz (De) Kirliliği (Ki) Tanımlama (T) (UDeKiT Lab.)") Uydu (U) Destekli Deniz (De) Kirliliği (Ki) Tanımlama (T) (UDeKiT Lab.) Hazırlayanlar: Dr. Burcu Özsoy Çiçek, Dr. Sevilay Can, Kpt A. Tuğsan İşiaçık Çolak, MSc Yer: İTÜ Denizcilik Fakültesi Tuzla/IST Mart
Uydu (U) Destekli Deniz (De) Kirliliği (Ki) Tanımlama (T) (UDeKiT Lab.) Hazırlayanlar: Dr. Burcu Özsoy Çiçek, Dr. Sevilay Can, Kpt A. Tuğsan İşiaçık Çolak, MSc Yer: İTÜ Denizcilik Fakültesi Tuzla/IST Mart
İKLİM DEĞİŞİKLİĞİ KURAKLIK ANALİZİ
 T.C. ÇEVRE VE ORMAN BAKANLIĞI DEVLET METEOROLOJİ İŞLERİ GENEL MÜDÜRLÜĞÜ İKLİM DEĞİŞİKLİĞİ VE KURAKLIK ANALİZİ Bülent YAĞCI Araştırma ve Bilgi İşlem Dairesi Başkanı İklim... Ortalama özellikleri kaynak
Nilüfer İlçesi ndeki Klasik Hava Kirletici Ölçümlerinin Değerlendirilmesi Raporu
 Nilüfer İlçesi ndeki Klasik Hava Kirletici Ölçümlerinin Değerlendirilmesi Raporu (Periyot: 01 07 Ocak 2018) Prof. Dr. Yücel TAŞDEMİR 1 Özet Nilüfer Belediyesi nin BEBKA destekli projesi kapsamında Nilüfer
OTEKOLOJİ TOPRAK FAKTÖRLERİ
 OTEKOLOJİ TOPRAK FAKTÖRLERİ - Kayaların ayrışması + organik maddeler - Su ve hava içerir - Bitki ve hayvanlar barındırır - Mineral maddeler TOPRAKLARI OLUŞTURAN ANA MATERYAL TİPLERİ - Toprak tipi-ana materyalin
ONDOKUZ MAYIS ÜNİVERSİTESİ MÜHENDİSLİK FAKÜLTESİ ÇEVRE MÜHENDİSLİĞİ BÖLÜMÜ 2014 YILI ANALİZ LABORATUVARI FİYAT LİSTESİ
 ONDOKUZ MAYIS ÜNİVERSİTESİ MÜHENDİSLİK FAKÜLTESİ ÇEVRE MÜHENDİSLİĞİ BÖLÜMÜ 2014 YILI ANALİZ LABORATUVARI FİYAT LİSTESİ A. NUMUNE ALMA/ÖRNEKLEME A.1.Emisyon Kapsamında Numune Alma/Örnekleme Uçucu Organik
EMİSYON ENVANTERİ NASIL HAZIRLANIR
 EMİSYON ENVANTERİ NASIL HAZIRLANIR Dr. Ali CAN 17.07.2009 1 EMISYON ENVANTERI Bir ülkenin emisyon envanteri 2 bileşenden oluşmaktadır. 17.07.2009 2 EMISYON ENVANTERI Ulusal Emisyon Envanter Raporu Metodolojiler
4. SINIF FEN VE TEKNOLOJİ DERSİ II. DÖNEM GEZEGENİMİZ DÜNYA ÜNİTESİ SORU CEVAP ÇALIŞMASI
 4. SINIF FEN VE TEKNOLOJİ DERSİ II. DÖNEM GEZEGENİMİZ DÜNYA ÜNİTESİ SORU CEVAP ÇALIŞMASI 1. Dünya mızın şekli neye benzer? Dünyamızın şekli küreye benzer. 2. Dünya mızın şekli ile ilgili örnekler veriniz.
Hava Kalitesi Ölçümleri: - Planlama - PM örnekleme ve ölçümleri - Gaz kirleticilerin ölçümleri
 Hava Kalitesi Ölçümleri: - Planlama - PM örnekleme ve ölçümleri - Gaz kirleticilerin ölçümleri Prof.Dr.Abdurrahman BAYRAM Dokuz Eylül Üniversitesi, Çevre Mühendisliği Bölümü Tınaztepe Yerleşkesi 35160
Sodyum Hipoklorit Çözeltilerinde Aktif Klor Derişimini Etkileyen Faktörler ve Biyosidal Analizlerindeki Önemi
 Sodyum Hipoklorit Çözeltilerinde Aktif Klor Derişimini Etkileyen Faktörler ve Biyosidal Analizlerindeki Önemi Umut ŞAHAR Ege Üniversitesi EgeMikal Çevre Sağlığı Birimi 19.03.2014 Ulusal Biyosidal Kongresi
Karbonmonoksit (CO) Oluşumu
 Oluşumu") Yanma Kaynaklı Emisyonların Oluşum Mekanizmaları Karbonmonoksit (CO) Oluşumu Karbonmonoksit emisyonlarının ana kaynağı benzinli taşıt motorlarıdır. H/Y oranının CO emisyonu üzerine etkisi çok fazladır.
Yanma Kaynaklı Emisyonların Oluşum Mekanizmaları Karbonmonoksit (CO) Oluşumu Karbonmonoksit emisyonlarının ana kaynağı benzinli taşıt motorlarıdır. H/Y oranının CO emisyonu üzerine etkisi çok fazladır.
Meteoroloji. IX. Hafta: Buharlaşma
 Meteoroloji IX. Hafta: Buharlaşma Hidrolojik döngünün önemli bir unsurunu oluşturan buharlaşma, yeryüzünde sıvı ve katı halde farklı şekil ve şartlarda bulunan suyun meteorolojik faktörlerin etkisiyle
T.C. ÇEVRE VE ŞEHİRCİLİK BAKANLIĞI ÇED, İzin ve Denetim Genel Müdürlüğü ÇEVRE ÖLÇÜM VE ANALİZLERİ YETERLİK BELGESİ EK LİSTE-1/7
 ÇED, İzin ve Denetim lüğü EK LİSTE-1/7 (1, 2, 3,4) SU, ATIK SU ph Elektrometrik Metot SM 4500 H+ B Sıcaklık Laboratuvar ve Saha Metodu SM 2550 B İletkenlik Elektrokimyasal Metot SM 2510 B Renk Spektrofotometrik
Nilüfer İlçesi ndeki Klasik Hava Kirletici Ölçümlerinin Değerlendirilmesi Raporu
 Nilüfer İlçesi ndeki Klasik Hava Kirletici Ölçümlerinin Değerlendirilmesi Raporu (Periyot: 06-12 Haziran 2016) Prof. Dr. Yücel TAŞDEMİR 1 Özet Nilüfer Belediyesi nin BEBKA destekli projesi kapsamında Nilüfer
Modern Tekniklerle Gözlemevi Yerleşkesi Yer Seçimi Çalışmaları
 Üniversitesi Modern Tekniklerle Gözlemevi Yerleşkesi Yer Seçimi Çalışmaları Tansel AK İstanbul Üiversitesi Fen Fakültesi Astronomi ve Uzay Bilimleri Bölümü Üniversitesi Teleskop Çapı? Gözlem Yöntemi? Dalgaboyu?
İÇİNDEKİLER ÖN SÖZ...
 İÇİNDEKİLER ÖN SÖZ... v GİRİŞ... 1 1. İSTATİSTİK İN TARİHÇESİ... 1 2. İSTATİSTİK NEDİR?... 3 3. SAYISAL BİLGİDEN ANLAM ÇIKARILMASI... 4 4. BELİRSİZLİĞİN ELE ALINMASI... 4 5. ÖRNEKLEME... 5 6. İLİŞKİLERİN
Normandy Madencilik A.Ş. Ovacõk Altõn Madeni
 Normandy Madencilik A.Ş. Ovacõk Altõn Madeni İÇİNDEKİLER YÖNETİCİ ÖZETİ... 3 1 Toz ve Gaz Emisyonlarõnõn Kontrolü...4-5 Toz...4-5 Havada Hidrojen Siyanür (HCN) Gazõ... 6 2 Gürültü Kontrolü... 7 3 Kimyasal
9.7 ISIL İŞLEM SIRASINDA GIDA BİLEŞENLERİNİN PARÇALANMASI
 9.7 ISIL İŞLEM SIRASINDA GIDA BİLEŞENLERİNİN PARÇALANMASI 9.7.1 Sabit Sıcaklıkta Yürütülen Isıl işlemde Bileşenlerin Parçalanması 9.7.2 Değişen Sıcaklıkta Yürütülen Isıl İşlemde Bileşim Öğelerinin Parçalanması
2- Bileşim 3- Güneş İç Yapısı a) Çekirdek
 Çekirdek") GÜNEŞ 1- Büyüklük Güneş, güneş sisteminin en uzak ve en büyük yıldızıdır. Dünya ya uzaklığı yaklaşık 150 milyon kilometre, çapı ise 1.392.000 kilometredir. Bu çap, Yeryüzünün 109 katı, Jüpiter in de 10
GÜNEŞ 1- Büyüklük Güneş, güneş sisteminin en uzak ve en büyük yıldızıdır. Dünya ya uzaklığı yaklaşık 150 milyon kilometre, çapı ise 1.392.000 kilometredir. Bu çap, Yeryüzünün 109 katı, Jüpiter in de 10
ORTA ANADOLU BÖLGESİNDE ATMOSFERİN KOMPOZİSYONUNUN BELİRLENMESİ
 TMMOB Çevre Mühendisleri Odası V. ULUSAL ÇEVRE MÜHENDİSLİĞİ ONGRESİ ORTA ANADOLU BÖLGESİNDE ATMOSFERİN OMPOZİSYONUNUN BELİRLENMESİ Ebru Yörük, Canan Yeşilyurt 2, Banu Bayar 3, Gürdal Tuncel 4 () MSc. Öğrencisi,